materials Article
Immobilization of Magnetic Nanoparticles onto Amine-Modified Nano-Silica Gel for Copper Ions Remediation Marwa Elkady 1,2, *, Hassan Shokry Hassan 3, * and Aly Hashim 1 1
2 3
*
Fabrication Technology Department, Advanced Technology and New Materials Researches Institute, City of Scientific Researches and Technological Applications, New Borg El-Arab City, Alexandria 21934, Egypt;
[email protected] Chemical and Petrochemical Engineering Department, Egypt-Japan University of Science and Technology, New Borg El-Arab City, Alexandria 21934, Egypt Electronic Materials Researches Department, Advanced Technology and New Materials Researches Institute, City of Scientific Researches and Technological Applications, New Borg El-Arab City, Alexandria 21934, Egypt Correspondence:
[email protected] (M.E.);
[email protected] (H.S.H.); Tel.: +20-1227-209936 (M.E.); +20-1282-305425 (H.S.H.)
Academic Editor: George Zhao Received: 26 April 2016; Accepted: 2 June 2016; Published: 9 June 2016
Abstract: A novel nano-hybrid was synthesized through immobilization of amine-functionalized silica gel nanoparticles with nanomagnetite via a co-precipitation technique. The parameters, such as reagent concentrations, reaction temperature and time, were optimized to accomplish the nano-silica gel chelating matrix. The most proper amine-modified silica gel nanoparticles were immobilized with magnetic nanoparticles. The synthesized magnetic amine nano-silica gel (MANSG) was established and characterized using X-ray diffraction (XRD), transmission electron microscopy (TEM), scanning electron microscopy (SEM), Fourier transform infrared (FTIR), thermal gravimetric analysis (TGA), differential scanning calorimetry (DSC) and vibrating sample magnetometry (VSM). The feasibility of MANSG for copper ions’ remediation from wastewater was examined. MANSG achieves a 98% copper decontamination from polluted water within 90 min. Equilibrium sorption of copper ions onto MANSG nanoparticles obeyed the Langmuir equation compared to the Freundlich, Temkin, Elovich and Dubinin-Radushkevich (D-R) equilibrium isotherm models. The pseudo-second-order rate kinetics is appropriate to describe the copper sorption process onto the fabricated MANSG. Keywords: nano-magnetic silica gel hybrid; amine-functionalized silica gel; copper remediation; equilibrium and kinetics modelling
1. Introduction Water pollution by trace heavy metals is well known as a serious environmental and public problem. Where the increasing in industrial activities has caused many water bodies to receive loads of heavy metals that exceed the maximum permissible limit for wastewater, discharge is designed to protect the environment, humans and animals. These metals, in addition to their high toxicity, do not have any tendency to be degraded or destroyed. Accordingly, in order to provide long-term high quality water or to enable water recycling, there has been research into alternative remediation processes involving filtration, chemical precipitation, solvent extraction, electrolysis, ion exchange, electrochemical deposition and membrane process. However, these methods are either inefficient or expensive, especially when the concentration of the heavy metal ion is low [1].
Materials 2016, 9, 460; doi:10.3390/ma9060460
www.mdpi.com/journal/materials
Materials 2016, 9, 460
2 of 24
Solid phase extraction (SPE) has commonly been used as a technique for pre-concentration/separation of various inorganic and organic species. It is used to enhance the selectivity and sensitivity of the method, as it allows for discriminatory binding of the analyte to a solid support, where it will be accumulated and subsequently eluted with a small volume of solvent. This technique has the advantages of a higher enrichment factor, the absence of emulsion, safety with respect to hazardous samples, minimal costs due to low consumption of reagent, being environmentally friendly, flexibility and easier incorporation into automated analytical techniques [2,3]. For this purpose, new sorbent materials, such as polymeric resins, activated carbon, naphthalene and silica gel, have been developed for more effective extraction. However, some of these sorbents, especially the organic ones, such as polymeric resin, suffer from a number of drawbacks, such as slow kinetics, irreversible adsorption of organics, swelling, sensitivity towards many chemical environments and loss of mechanical stability in modular operation. These problems lead to developing inorganic sorbent nanomaterials as alternatives for polymeric resin; where most of these nano-inorganic materials are distinguished by their good selectivity, no swelling, rapid sorption of metal ions and good mechanical stability [4]. The development of novel and cost-effective nanomaterials for environmental remediation, pollution detection and other applications has attracted considerable attention. Recent advances suggest that many of the issues involving water quality could be resolved or greatly ameliorated using nanoparticles, nanofiltration or other products resulting from the development of nanotechnology. One of the potential and inexpensive inorganic sorbent nanomaterials that could be used in water treatment is nano-silica gel. In addition to its high mechanical, thermal and chemical resistance, it also is distinguished by its local availability and has many microsized pores on the surface to induce and adsorb various molecules into the pores [5,6]. These characteristic features provide silica gel materials the possibility of their surface modification or to be coated with an impregnation medium or reagent. Subsequently, they can be chemically modified with different functional groups either with inorganic or organic functionalities to improve their removal performance. These modified materials have been commonly used in various areas, most notably in the separation and preconcentration of trace metal ions from aqueous systems. With respect to the immobilization (modification or fictionalization), reactions on silica gel materials are relatively simple and show fast kinetics in metal ions’ uptake [4,7]. Therefore, silica gel will be functionalized with an amine group as an effective functional group to chelate copper ions from polluted waste water. The factors that affect the silica gel functionalization process will be optimized to attain silica gel with a high affinity for copper ion sorption. The most proper functionalized silica gel that poses the highest copper sorption affinity will be immobilized with nano-magnetite to fabricate a novel nano-magnetic silica gel hybrid material. This magnetic nano-hybrid is characterized by its unique and useful magnetic property that facilitates its separation from the treatment media using an external magnetic field. Moreover, the copper sorption process using the fabricated magnetic amine silica gel nano-material (MANSG) will be monitoring as a function of the processing parameters, such as copper concentration, dosage of adsorbent material, pH of copper solution and temperature. Finally, different theoretical models will be proposed for describing the equilibrium and kinetic copper sorption process onto the MANSG. 2. Materials and Methods 2.1. Materials A stock solution of copper of 5000 mg/L was prepared by dissolving copper(II) chloride 2-hydrate (170.48 g/mol, Riedel, Germany) in distilled water. Different concentrations ranging between 10 and 5000 mg/L were prepared from the copper stock solution. Before mixing the adsorbent material with the copper-polluted waste water, the pH of each solution was adjusted to the required value with dilute solutions from 0.1 N HCl and 0.1 N NaOH. All of the other chemicals utilized for the non-magnetic amine-functionalized silica gel synthesis process were of analytical reagent grade.
Materials 2016, 9, 460 Materials 2016, 9, 460
3 of 24 3 of 24
2.2. Methods 2.2. Methods 2.2.1. Preparation of Amine-Functionalized Nano-Silica Gel 2.2.1. Preparation of Amine-Functionalized Nano-Silica Gel Firstly, the raw silica gel of a micro-scale diameter (20 µm) was activated through mixing 10 g of Firstly, the Fluka, raw silica gel of a micro-scale diameter (20 µm)acid was(4 activated through mixing Riedel, 10 g silica gel (GF254; Switzerland) with 50 mL hydrochloric M) (37%; 36.46 g/mol, ˝ of silica gel (GF254; Fluka, 50 mL hydrochloric acid (4produced M) (37%; 36.46 g/mol,silica Riedel, Germany) under stirring forSwitzerland) 4 h at a 70 with C refluxing temperature. The activated cake Germany) under stirring for 4 h at a 70 °C refluxing temperature. The produced activated silica cake was washed several times with distilled water then filtered under vacuum suction. The produced wasprecipitate washed several timesat with then filtered under vacuum suction. The produced ˝ C for 5 water white was dried 150distilled h. white precipitate was dried at 150 °C for 5 h. In order to chemically modify and functionalize the previously-activated silica gel, it was In order to chemically modify and functionalize the previously-activated silica gel, it was co-condensated with 3-amino propyl triethoxy silane to be functionalized with the amine group. co-condensated with 3-amino propyl triethoxy silane to be functionalized with the amine group. One One gram from the dried powdered material was mixed with various volumes of toluene solution (0.5, gram from the dried powdered material was mixed with various volumes of toluene solution (0.5, 1, 1, 2, 4 and 6 mL/g) and a specific volume of 3-amino propyl triethoxy silane (0.05, 0.1, 0.25, 0.4 and 2, 4 and 6 mL/g) and a specific volume of 3-amino propyl triethoxy silane (0.05, 0.1, 0.25, 0.4 and 0.6 mL/g) under a refluxing system in the presence of argon. The refluxed reaction mixture stands 0.6 mL/g) under a refluxing system in the presence of argon. The refluxed reaction mixture stands ˝ C) for different reaction time intervals (2, 4, 6, 12, under different temperatures under different temperatures(40, (40,50, 50,60, 60,70 70 and and 80 80 °C) for different reaction time intervals (2, 4, 6, 12, 19 19 and 2222 h).h). The filtered under undervacuum vacuumfiltration filtrationand and washed with and Themodified modifiedsilica silicagel gelproduced produced was was filtered washed with ˝ C. The copper sorption efficiency of all toluene and acetone, then dried in a vacuum oven for 3 h at 70 toluene and acetone, then dried in a vacuum oven for 3 h at 70 °C. The copper sorption efficiency of synthesized samples at the various studied preparation screenedtotoattain attain the most all synthesized samples at the various studied preparationconditions conditions was was screened the most efficient amine-functionalized coppersorption sorptioncapacity. capacity. efficient amine-functionalizedsample samplethat thatrecords records the the maximum maximum copper 2.2.2. Preparation ofofMagnetic Gel 2.2.2. Preparation MagneticAmine-Functionalized Amine-Functionalized Nano-Silica Nano-Silica Gel The most proper amine-functionalized silica gel that the highest coppercopper sorption capacity The most proper amine-functionalized silica gel recorded that recorded the highest sorption was immobilized with nano-magnetite using theusing co-precipitation technique to attaintoa attain magnetic capacity was immobilized with nano-magnetite the co-precipitation technique a nano-hybrid. Three grams of dry amine-functionalized silica gelsilica weregel suspended in 400 mL of mL ferric magnetic nano-hybrid. Three grams of dry amine-functionalized were suspended in 400 offerrous ferric and ferrous salt solution. was of 15chloride mmol ferric and and salt solution. This solutionThis was solution composed of composed 15 mmol ferric and 10chloride mmol ferrous 10 mmol sulfate. The previous suspension heated under a constant rate (400 rpm) sulfate. Theferrous previous suspension was heated underwas a constant mixing rate (400mixing rpm) using a magnetic ˝ C inhot usinghot a magnetic stirring at 60of°CNin presence of sodium N2. Then, 3 mol/L sodium stirring plate at 60 the plate presence Then, 3 mol/L hydroxide solutionhydroxide was added 2 . the solution was added dropwise to the previous heated suspension under continuous heating and dropwise to the previous heated suspension under continuous heating and stirring in the presence of a N2 stirring in the presence of a N 2 atmosphere until the complete addition of the sodium hydroxide atmosphere until the complete addition of the sodium hydroxide solution. A black precipitate appeared solution. A black precipitate appeared the NaOH (of addition, converting the white suspension during the NaOH addition, converting theduring white suspension the chemically-modified silica gel) into the (of the chemically-modified silica gel) into the black precipitate of the magnetic silica gel hybrid. This black precipitate of the magnetic silica gel hybrid. This black precipitate was filtered and dried overnight black precipitate was filtered and dried overnight under vacuum drying at 60 °C. After complete ˝ under vacuum drying at 60 C. After complete dryness of the black precipitate, its magnetic performance dryness of the black precipitate, its magnetic performance was tested using a magnetic bar; the was tested using a magnetic bar; the magnetization of the prepared magnetic composite is evident from magnetization of the prepared magnetic composite is evident from Figure 1, where the black powder Figure 1, where the black powder material has a high attraction affinity toward the magnetic field. material has a high attraction affinity toward the magnetic field.
Figure 1. Magnetic performance the fabricated amine-functionalized silica gel Figure 1. Magnetic performance of theof fabricated magneticmagnetic amine-functionalized silica gel nano-hybrid nano-hybrid material (MANSG). material (MANSG).
Materials 2016, 9, 460
4 of 24
2.2.3. Characterization of the Magnetic Amine-Functionalized Nano-Silica Gel Different characterization techniques have been used to identify the fabricated MANSG’s properties. X-ray powder diffraction (XRD) was carried out using an X-ray diffractometer (Schimadzu-7000, Kyoto, Japan) with a CuKα radiation beam (λ = 0.154060 nm). The fine black powdered sample was packed into a flat aluminum sample holder. Data were collected between 10˝ and 80˝ in 2θ. In order to assign the characteristic functional groups present in the fabricated MANSG hybrid material, the dried black powder was analyzed as KBr discs using Fourier transform infrared (FTIR) (Shimadzu FTIR-8400 S, Kyoto, Japan) in the frequency range 600–4000 cm´1 at room temperature. The morphological features of the adsorbent material were determined using a transmission electron microscope (JEOL JEM 1230, Tokyo, Japan). The carbon-coated copper grid was immersed into the ultrasonic homogenized fully-dispersed suspension composed of MANSG nano-powder and ethanol. Then, the coated grid was dried at room temperature to be examined under an acceleration voltage of 100 kV. The thermal stability of the magnetic amine-functionalized nano-silica gel was evaluated by a thermogravimetric analyzer (Shimadzu TGA-50, Kyoto, Japan) and a differential scanning colorimeter (Shimadzu DSC-60, Kyoto, Japan). The measurements were carried out with a heating rate of 20 ˝ C/min under N2 flow to avoid thermal oxidation of the powder samples, starting from the ambient condition up to 800 ˝ C. The magnetization properties of the fabricated MANSG hybrid were determined at room temperature up to a maximum magnetic field of 900 Tesla using a vibrating sample magnetometer (VSM, Dexing, Model: 250, Lake Zurich, IL, USA). 2.2.4. Adsorption Technique for Copper Remediation from Polluted Water Using the MANSG Nano-Hybrid The batch experiments were carried out using a digital heating controlled magnetic stirrer (J.P. Selecta, Barcelona, Spain). The copper sorption process was evaluated as a function of the variation in the processing parameters of the nano-magnetite immobilized amine-modified silica gel (MANSG). A known volume (25 mL) from metal solutions with varying initial concentrations (10–5000 ppm) was taken in a 100-mL conical glass stopper. This solution was shaken with variant doses from the adsorbent material (5–60 g/L) at different contact time periods (5–240 min) at various agitation speeds (0–400 rpm) under different solution temperatures (25–85 ˝ C) and different solution pH (2–12). The residual copper ion concentration in the solution after the treatment process was analyzed using an inductive coupled plasma mass spectrophotometer (ICP-AES, Santa Clara, CA, USA). All of the experiments were carried out in duplicate, and mean values are presented. The copper ion measurements on the ICP equipment were repeated three times to obtain an accurate copper concentration. The percentage error in the measurement of copper ion concentration is ˘0.1. The mean copper concentration values were obtained and used for the calculation of the percentage of ion removal by the MANSG from the following Equation (1): %R “ p
CO ´ C q100 CO
(1)
where R is the ion removal, Co is the initial concentration of the metal ions in solution and C is the final metal ion concentration in aqueous solution after solid phase separation. In order to elucidate the uptake capacity of the metal ion, the up take amounts per gram of MANSG were evaluated from the change in solution concentration using Equation (2): Qpmg/gq “
VpCO ´ Cq M
(2)
where Q is the uptake capacity (mg/g), V is the volume of the solution (mL) and M is the mass of the solid material (g).
Materials 2016, 9, 460
5 of 24
Materials 2016, 9, 460
5 of 24
2.2.5. Desorption of Copper Ions from the Contaminated MANSG Nano-Hybrid after the Materials 2016, 9, 460 5 of 24 2.2.5. Desorption Treatment Process of Copper Ions from the Contaminated MANSG Nano-Hybrid after the Treatment Process 2.2.5. Desorption of Copper Ions from thewas Contaminated MANSG after the ions after the In order to regenerate MANSG that contaminated withNano-Hybrid the adsorbed copper In order to regenerate MANSG that was contaminated with the adsorbed copper ions after the Treatment Process treatment process, copper ions’ desorption was conducted by batch experiments. A 1-L solution treatment process, copper ions’ desorption was conducted by batch experiments. A 1-L solution containing 1000 ppm of copper ions was treated with 20 g/L 200-rpm mixing In order to regenerate MANSG that was contaminated withof theMANSG adsorbedunder copperaions after the containing 1000 ppm of copper ions was treated with 20 g/L of MANSG under a 200-rpm mixing treatment process, copper ions’ the desorption wasperiod, conducted batch experiments. AMANSG 1-L solution speed for 90 min. After finishing treatment the by copper-contaminated material speed for 90 1000 min. Afteroffinishing the was treatment period, the MANSGmixing material containing copper ions with 20field g/Lcopper-contaminated of MANSGbar), underand a 200-rpm was separated fromppm the treatment media bytreated a magnetic (magnetic the residual filtrate was separated fromAfter the treatment media by a magnetic field (magnetic bar), andMANSG the residual filtrate for 90 finishing the treatment period, the copper-contaminated was speed analyzed formin. copper ions. Copper containing the MANSG adsorbent material wasmaterial transferred was analyzed for copper ions. Copper containing the MANSG adsorbent material transferred was separated from the treatment media by a magnetic field (magnetic bar), and the was residual filtrate to to another beaker and stirred for 90 min at 200 rpm with 1 L of 0.02 N EDTA to determine desorbed another beaker for and stirred forCopper 90 mincontaining at 200 rpm 1 L ofadsorbent 0.02 N EDTA to was determine desorbed was analyzed copper ions. thewith MANSG material transferred to copper ions from MANSG. Liquid samples were withdrawn at predetermined predeterminedtime timeintervals intervals and copper ions from MANSG. Liquid samples were withdrawn at another beaker and stirred for 90 min at 200 rpm with 1 L of 0.02 N EDTA to determine desorbedand analyzed forions stripped copper analyzed for stripped copperion ionconcentration. concentration. copper from MANSG. Liquid samples were withdrawn at predetermined time intervals and analyzed for stripped copper ion concentration.
3. 3. Results Resultsand andDiscussion Discussion
3. Results and Discussion
3.1. Preparation of the Amine-Functionalized Nano-Silica Gel Silica Gel Activation Process 3.1. Preparation of the Amine-Functionalized Nano-Silica Gel Silica Gel Activation Process 3.1. Preparation ofactivation the Amine-Functionalized Nano-Silica Gel Silica Gel Activation Processgel functionalization. The silica gelgel preliminary stepininsilica silica The silica activationprocess processrepresented represented a a preliminary step gel functionalization. Silica gel was immersed in hydrochloric acid solution to remove the trace impurities associated with The silica gel activation process represented a preliminary step in silica gel functionalization. Silica gel was immersed in hydrochloric acid solution to remove the trace impurities associated with Silica gel was immersed in hydrochloric acid solution to remove the trace impurities associated with powdered material, then dried to evaporate the water molecules that bonded with the silanol group powdered material, then dried to evaporate the water molecules that bonded with the silanol group powdered material, then dried to evaporatehydrogen the water bonding. molecules Accordingly, that bonded with thefree silanol group (Si-OH) inside thethe silica these silanol groups (Si-OH) inside silicagel gelmatrix matrixthrough through hydrogen bonding. Accordingly, these free silanol groups (Si-OH) inside the silica gel matrix through hydrogen bonding. Accordingly, these free silanol groups inside thethe silica gel silica matrix matrixtotoform forma acovalent covalentbond bond with inside silica gelmatrix matrixgive givethe theopportunity opportunity for for the the silica with inside the silica gel matrix give the opportunity for the silica matrix to form a covalent bond with new functional groups from thethe reaction media. Moreover, this loss ofof water new functional groups from reaction media. Moreover, this loss watermolecules moleculesfrom fromsilica silicagel new functional groups from the reaction media. Moreover, this loss of water molecules from silica improves its surface area and its pores, the physical chemical adsorption gel improves its surface area and itswhich pores,enhances which enhances the adsorption, physical adsorption, chemical gel improves its surface area and its pores, which enhances the physical adsorption, chemical and capillary condensation processes, becoming more efficient and effective, as illustrated andadsorption capillary condensation processes, becoming more efficient and effective, as illustrated Scheme 1; adsorption and capillary condensation processes, becoming more efficient and effective, as illustrated 1; on the other hand, this drying process is important because much water is left in the on Scheme the other hand, this drying process is important because much water is left in the mesopores, Scheme 1; on the other hand, this drying process is important because much water is left in the mesopores, which may cause an oligomerization of the silanes and pore blocking [8,9]. which may cause an oligomerization of the silanes pore blocking mesopores, which may cause an oligomerization ofand the silanes and pore [8,9]. blocking [8,9].
Scheme 1. Chemical silica gel. Scheme Chemicalactivation activationofof Scheme 1.1.Chemical activation of silica silicagel. gel.
3.2. Optimization of the Chemical Modification Process of the Activated Silica Gel Optimization ChemicalModification ModificationProcess Process of of the Activated Activated Silica 3.2.3.2. Optimization of of thetheChemical SilicaGel Gel Activated silica gel was modified chemically using 3-amino propyl triethoxy silane (APTS). Activatedsilica silicagel gelwas wasmodified modified chemically chemically using (APTS). Activated using 3-amino 3-aminopropyl propyltriethoxy triethoxysilane silane (APTS). During the modification, silane coupling agents that attain the amine functional groups are During the modification, silane coupling agents that attain the amine functional groups are During the modification, silane present coupling that attain the amine functional groups are substituted substituted by silanol groups onagents the silica surface according to the mechanism of electrophilic substituted by silanol groups present on the silica surface according to the mechanism of electrophilic by silanol present on the silica surface according to the the mechanism of electrophilic proton protongroups substitution, as illustrated in Scheme 2. In this mechanism, contribution of the centers of proton substitution, as illustrated in Scheme 2. In this mechanism, the contribution of the centers substitution, as illustrated in Scheme 2. In this mechanism, the contribution of the centers of of this this surface has been taken into account [10].
this surface hastaken been taken into account surface has been into account [10]. [10].
Scheme 2. Chemical functionalization of activated silica gel with silanol groups.
Scheme Chemicalfunctionalization functionalization of of activated activated silica Scheme 2.2.Chemical silicagel gelwith withsilanol silanolgroups. groups.
Materials 2016, 9, 460
Materials 2016, 9, 460
6 of 24
6 of 24
Different factors will influence the chemical substitution process of the activated silica gel, such as the reaction time,factors the reactant concentration and the reaction temperature. These factors will be Different will influence the chemical substitution process of the activated silica gel, such optimized functionalize activated silica geland with aminetemperature. functional group. as the to reaction time, thethe reactant concentration thethe reaction These factors will be Firstly, thetoeffect of reaction on the sorption efficiency the produced optimized functionalize the time activated silica gel with the amineoffunctional group.ANSG was monitored Firstly, effect of reaction time of onthe themodified sorption silica efficiency of the produced ANSG was to determine the the copper removal capacity gel produced at each studied reaction monitored to determine the copper removal capacity of the modified silica gel produced at each time interval (Figure 2A). It was elucidated by this figure that as the reaction period increased, studiedremoval reaction time interval (Figure 2A). It was elucidated this figure that as the reaction periodto the the copper capacity of the produced material wasby incremented. This may be related increased, the copper removal capacity of the produced material was incremented. This may be short time reaction intervals leading to an incomplete chemical modification process for the activated related to the short time reaction intervals leading to an incomplete chemical modification process silica gel. Consequently, it was suggested that the optimum reaction time for the chemical medication for the activated silica gel. Consequently, it was suggested that the optimum reaction time for the of silica gel ismedication 22 h. Thisofreaction compatible with many researchers’ chemical silica geltime is 22interval h. This isreaction time interval is compatible withresults many [11], where they stated that [11], 24 h where is a sufficient period for completing chemical modification process of researchers’ results they stated that 24 h is a sufficient the period for completing the chemical silicamodification gel [9]. process of silica gel [9].
Figure 2. Effect of chemical modification parameters on amine-functionalized silica gel copper
Figure 2. Effect of chemical modification parameters on amine-functionalized silica gel copper sorption sorption capacity. (A) Effect of reaction time; (B) effect of the variation of the solvent to silica gel ratio; capacity. (A) Effect of reaction time; (B) effect of the variation of the solvent to silica gel ratio; (C) effect (C) effect of the variation of the propyl triethoxy silane (APTS) to silica gel ratio; (D) effect of the of thereaction variation of the propyl triethoxy silaneof(APTS) ratio; (D) effect of the temperature. Solution concentration copper to ionsilica = 100gel ppm; amount of ANSG = 0.2reaction g; temperature. Solution concentration of copper ion = 100 ppm; amount of ANSG = 0.2 g; agitation agitation time = 90 min; agitation speed = 200 rpm; solution volume = 25 mL; pH = 7. time = 90 min; agitation speed = 200 rpm; solution volume = 25 mL; pH = 7. The solvent has a critical role in the reaction rate because solvents may or may not surround a nucleophile, notin hindering its approach to the carbon atom [12].or Therefore, ratio The solventthus has hindering a critical or role the reaction rate because solvents may may notthe surround a of toluene solvent to silica gel will be firstly optimized to adjust the reactant ratio of the reaction nucleophile, thus hindering or not hindering its approach to the carbon atom [12]. Therefore, the ratio mixturesolvent to prepare the most for copper sorption at the predetermined of toluene to silica gelefficient will besorbent firstly material optimized to adjust the reactant ratio of the22-h reaction
mixture to prepare the most efficient sorbent material for copper sorption at the predetermined 22-h reaction time. The effect of the changing toluene to silica gel concentration from 5–60 mL/g at a fixed
Materials 2016, 9, 460
7 of 24
3-amino propyl triethoxy silane (APTS) concentration was monitored for the copper sorption affinity of the produced ANSG. Figure 2B demonstrates that the increment in the toluene concentration improves the copper removal affinity of the produced ANSG. This may return to the competition between both the solvent and organic groups for the reaction with the surface silanol groups present in the pores by means of an interaction with APTS generated through hydrogen bonds during the functionalization process. As the solvent concentration increased, a preference of hydrogen bonding occurs between the central region of APTS and the silanol groups of silica gel, rather than the weak van der Waals forces on the periphery. As such, the molecules of the APTS are more thermodynamically stabilized by hydrogen bonds than by the van der Waals interactions within the toluene solvent [13]. Finally, it can be concluded that the optimum toluene to silica gel ratio was recorded to be 20 mL/g. Based on this optimum toluene to silica gel ratio, the most proper amount of APTS-functionalized agent utilized for grafting the activated silica gel to produce a highly efficient copper sorption adsorbent material will be determined. The studied reaction ratio of APTS to silica gel in the reaction mixture was varied from 0.5–6 mL/g using 20 mL/g toluene solvent. The influence of APTS concentration on the copper sorption performance of the produced sorbent materials was illustrated in Figure 2C. It was evident from this figure that the increment in the amount of APTS in the reaction mixture was associated with improvement in the copper removal capacity of the produced modified silica gel. This observation may return to incrementing in the degree of silica gel functionalized with amine groups as the amount of APTS coupling agent increased [13]. That is, it improves the adsorption capacity of modified silica gel for copper removal. Accordingly, the optimum APTS to silica gel ratio was determined to be equal to 2.5 mL/g. The effect of the reaction temperature on the silica gel amine grafting process was elucidated using all of the predetermined optimum silica gel modification process conditions. The copper removal capacity of the produced modified silica gel at different reaction temperatures was investigated at Figure 2D. It is clear that the reaction temperature has a positive effect on the copper sorption affinity for the produced modified silica gel. This may be in regards to the fact that the increase in the reaction temperature favors the diffusion rate of reactants. That is, it improves the reaction rate and subsequently increases the degree of silica gel grafting by amine groups, which enhance the adsorption behavior of the modified silica gel to increase its affinity for copper removal. Accordingly, the optimum reaction temperature was 70 ˝ C for the chemical modification process, where it produces adsorbent material with a 98% copper removal affinity. According to the optimized preparation conditions, the most proper amine-functionalized silica gel (ANSG) that attains the optimum copper decontamination of 98% was synthesized through the co-condensation of 1 g silica gel with 20 mL toluene and 2.5 mL silane for 22 h at 70 ˝ C. This functionalized silica gel was immobilized with nano-magnetite to attain nano-magnetic amine-functionalized silica gel using a co-precipitation technique. 3.3. Characterization of the Magnetic Amine-Functionalized Nano-Silica Gel The properties of MANSG were mostly compared to its parent amine-functionalized silica gel (ANSG) before immobilization to record the main difference between the two matrices. The FTIR spectra of both amine-functionalized silica gel and its magnetic immobilized matrices are investigated in Figure 3 to determine their main functional groups. Comparing the two spectrums, they show relatively similar spectra and reveal the presence of an amine-functionalized band (NH2 ) at around 1650 cm´1 . Additionally, both matrices demonstrated the stretching band at 3200 cm´1 for functionalized silica gel that shifted to 2943.17 cm´1 for the magnetic silica gel, which was assigned to a C-H weak band of the carbon chain of the pendant group attached to the inorganic silica matrix [14]. The shoulder band at 960 cm´1 present in the FTIR spectra of these matrices is associated to SiOH vibrations and composed of Si-O-H stretching. A new observed band was recorded in the magnetic immobilized silica gel spectrum around 750 cm´1 , which is responsible for the vibration of the M-O-M of
Materials 2016, 9, 460
8 of 24
Materials 2016, 9, 460 Materials 2016, 9, 460
8 of 24 8 of 24
theFTIR magnetite immobilized the silica gel matrix FTIR confirm the amine resultsparticle confirm the amine onto functionalization of silica[15]. gel,These as well as results the immobilization of FTIR results confirm the amine functionalization of silica gel, as well asthe the immobilization ofgel. functionalization of silica gel, as well as the immobilization of magnetite onto functionalized silica magnetite onto the functionalized silica gel. magnetite onto the functionalized silica gel. Figure 4 exemplifies materialsofofthe theamine-functionalized amine-functionalized Figure 4 exemplifiesthe theXRD XRDpatterns patterns of of the the mesoporous mesoporous materials Figure 4 exemplifies the XRD patterns of the mesoporous materials of the amine-functionalized silica (ANSG) anditsitsmagnetic magneticmatrices matrices (MANSG). (MANSG). The of of a broad silica gelgel (ANSG) and The two twopatterns patternsappear appeartotoconsist consist a broad silica gel (ANSG) and its magnetic matrices (MANSG). The two patterns appear to consist of a broad peak a low 2θ angle suggests the presence of ordering mesoporous structure peak in ainlow 2θ angle range,range, whichwhich suggests the presence of ordering mesoporous structure materials. peak in a low 2θ angle range, which suggests the presence of ordering mesoporous structure materials. the Meanwhile, the ANSG pattern (Figure 4A)a displayed a well-resolved pattern at lowwith 2θ a Meanwhile, ANSG pattern (Figure 4A) displayed well-resolved pattern at low 2θ values materials. Meanwhile, the ˝ANSG pattern (Figure 4A) displayed a well-resolved pattern at low 2θ values with a sharp 8.2° and apeak less at intensive peak at ˝the angle of 23° sharp diffraction peak diffraction at 8.2 andpeak a lessatintensive the angle of 23 associated withassociated (370), (222) values with a sharp diffraction peak at 8.2° and a less intensive peak at the angle of 23° associated with (370), (222) reflections, respectively. The at absence of peaks at a higher angle confirms that thean reflections, The absence of peaks a higher angleat confirms theconfirms silica layer with (370),respectively. (222) reflections, respectively. The absence of peaks a higherthat angle thathas the silica layer has an amorphous structure [14]. On the other hand, noticeable characteristic peaks were 2θ amorphous [14]. On the other hand, noticeable peaks were observed at were high silica layerstructure has an amorphous structure [14]. On the othercharacteristic hand, noticeable characteristic peaks observed at XRD high 2θ values for the4A) XRD pattern (Figure 4A) of magnetic-functionalized silica gel values for the pattern of pattern magnetic-functionalized silica gel (ANSG) that explored observed at high 2θ values(Figure for the XRD (Figure 4A) of magnetic-functionalized silica gel (ANSG) that explored the crystallinity of this matrix compared to the functionalized silica gel. the(ANSG) crystallinity of this matrix compared to silicatogel. 4B showssilica the sum that explored the crystallinity of the thisfunctionalized matrix compared theFigure functionalized gel. of Figure 4B shows the sum of reflection intensities ˝(red ˝highlighted) 2θ of 35.5°, 43°, 57° and 63°, ˝ and 63at ˝ , which reflection intensities (red highlighted) at 2θ of 35.5 , 43 , 57 correspond to the (311), Figure 4B shows the sum of reflection intensities (red highlighted) at 2θ of 35.5°, 43°, 57° and 63°, which correspond to the (311), (400), (511) and (440) planes of the cubic crystal of iron oxide Fe3O4, (400), (511) and (440) planes of the cubic crystal of iron oxide Fe O , which confirmed by standard which correspond to the (311), (400), (511) and (440) planes of the3 cubic crystal of iron oxide Fe3O4, 4 which confirmed by standard data for magnetite (Ref: 04007-1060) [16]. These peaks confirm the data for magnetite 04007-1060) [16]. These peaks the presence of crystalline magnetite which confirmed (Ref: by standard data for magnetite (Ref:confirm 04007-1060) [16]. These peaks confirm the presence of crystalline magnetite nanoparticles. However, the intensity of the immobilized magnetite presence of crystalline magnetite nanoparticles. However, the intensity of the immobilized nanoparticles. However, the intensity of the immobilized magnetite characteristic peaks is not magnetite high enough characteristic peaks is not high enough compared to the pure magnetite reference characteristic peaks is notreference high enough comparedThis to may thebepure magnetite reference compared to the pure magnetite (Ref: inofregards to the incorporation (Ref: 04-007-1060). This may be in regards to04-007-1060). the incorporation of some magnetite nanoparticles 04-007-1060). This may be inwithin regards the incorporation ofmesoporous some of magnetite nanoparticles of (Ref: some magnetite thetopores of the silica gel structure [16]. withinofthe pores of nanoparticles the silica gel mesoporous structure [16]. within the pores of the silica gel mesoporous structure [16].
Intensity Intensity
Figure 3. FTIR for amine-functionalized (dashed line) and magnetic immobilized functionalized Figure (dashed line) line) and and magnetic magneticimmobilized immobilizedfunctionalized functionalized Figure3. 3.FTIR FTIRfor foramine-functionalized amine-functionalized (dashed (straight line) silica gel. (straight line) silica (straight line) silicagel. gel. 400 400 350 350 300 300 250 250 200 200 150 150 100 100 50 50 0 0 10 10
20 20
30 30
40 40
50
60
50 60 2 degree 2 degree
(A) (A)
Figure 4. Cont.
70 70
80 80
90 90
10 0 10 0
Materials 2016, 9, 460 Materials 2016, 9, 460
9 of 24 9 of 24
(B) Figure 4. XRD spectrums of (A) amine-functionalized silica gel (ANSG) and (B) magnetic Figure 4. XRD spectrums of (A) amine-functionalized silica gel (ANSG) and (B) magnetic amine-functionalized silica gel (MANSG). amine-functionalized silica gel (MANSG).
Figure 5 represents the SEM micrographs of the amine-functionalized silica gel (Figure 5A) and Figure 5 represents the SEM micrographs of the amine-functionalized silica gel (Figure 5A) and its magnetic immobilized hybrid (Figure 5B). It was indicated that the particle morphology of the two its matrices magnetichas immobilized hybridwith (Figure 5B). and It was indicated that the particle of the two spherical shapes 100-nm 50-nm average diameters for morphology ANSG and MANSG, matrices has spherical shapes with 100-nm and 50-nm average diameters process for ANSG MANSG, respectively. However, the raw silica gel before the chemical modification hasand an average respectively. However, the raw silica gel before the chemical modification process has an average diameter equal to 20 µm (as indicated from its suppliers). Accordingly, these results designated that diameter equal to 20 µm (as indicated from its suppliers). Accordingly, these results designated that both the chemical functionalization and magnetite immobilization processes reduce the silica gel both the chemical and magnetite immobilization reduce the silica gel particle diameter functionalization from the micro-scale into the nano-scale. This may beprocesses owed to the severe chemical particle diameter from the micro-scale intothe the nano-scale. This mayinto be nanospherical owed to the severe conditions of these processes that deform silica gel bulk particles shapeschemical as the conditions these processes that deform under the silica geltemperature bulk particles into nanospherical shapes as action ofofchemical treatment processes high [17]. Moreover, the magnetic silica gel treatment hybrid wasprocesses subjected to further chemical treatment conditions of thethe magnetite theimmobilized action of chemical under high temperature [17]. Moreover, magnetic immobilization afterwas thesubjected chemical to modification process of silica conditions gel functionalization that immobilized silicaprocess gel hybrid further chemical treatment of the magnetite may explain the reduction of the nanosize of the magnetic matrices and its uniform shape compared immobilization process after the chemical modification process of silica gel functionalization that to explain the amine-functionalized one.nanosize Moreover, of magnetite nanoparticles the may the reduction of the of the the immobilization magnetic matrices and its uniform shape onto compared silica gel matrix is confirmed in Figure 6B. It was indicated from this figure that there are black spots to the amine-functionalized one. Moreover, the immobilization of magnetite nanoparticles onto the of magnetic nanoparticles (highlighted red) present over thefrom silicathis gel figure matrix.that Thisthere figureare gives silica gel matrix is confirmed in Figure in 6B. It was indicated black predictions that the mechanism of magnetite immobilization onto the silica gel matrix is based on the spots of magnetic nanoparticles (highlighted in red) present over the silica gel matrix. This figure uniform dispersion of small nanoparticles of magnetite onto the porous structure of the gives predictions that the mechanism of magnetite immobilization onto the silica gel matrix is based functionalized silica gel matrix. This suggested mechanism is in accordance with other mechanisms on the uniform dispersion of small nanoparticles of magnetite onto the porous structure of the described for the immobilization of magnetite onto the zeolite matrix to fabricate the magnetite functionalized silica gel matrix. This suggested mechanism is in accordance with other mechanisms zeolite nanocomposite [18]. This result confirms the formation of the magnetic amine-functionalized described for the immobilization of magnetite onto the zeolite matrix to fabricate the magnetite zeolite silica gel hybrid. nanocomposite [18]. This result confirms the formation of the magnetic amine-functionalized silica The particle size reduction and the regularity of the magnetic amine-functionalized silica gel are gelconfirmed hybrid. in Figure 6; where TEM imaging showed the reduction in the particles of the magnetic Thegel particle size reduction and the regularity of the magnetic silica gelinare silica hybrid and its homogeneity in Figure 6B compared to amine-functionalized the amine-functionalized one confirmed in Figure 6; where TEM imaging showed the reduction in the particles of the magnetic Figure 6A. Moreover, the immobilization of magnetite nanoparticles onto the silica gel matrix is silica gel hybrid and 6B, its where homogeneity Figure 6Bmagnetic compared to the amine-functionalized one in confirmed in Figure the blackin spots of the nanoparticles (highlighted in red) were Figure 6A.over Moreover, of magnetite nanoparticles onto the silica gel matrix is present the silicathe gelimmobilization matrix, confirming the formation of the magnetic amine-functionalized confirmed FigureFinally, 6B, where black spots of the magnetic nanoparticles (highlighted in red) were silica gelin hybrid. the the conversion of bulk silica gel to the nanosilica gel gives the prediction that the amine-functionalized magneticthe immobilized materials present the potentialsilica to present over the silica gel matrix,and confirming formationsilica of thegel magnetic amine-functionalized employed as adsorbents for metal ion uptake. Moreover, the coupling agentsthe of prediction amine group gelbehybrid. Finally, the conversion of bulk silica gel to the nanosilica gel gives that on the surface and of silica gel induce hydrophobicity at materials the material surface. theadsorbed amine-functionalized magnetic immobilized silica gel present theTherefore, potential the to be silica gelasmatrices’ surface assumes an organophilic character that enhances performance as employed adsorbents for metal ion uptake. Moreover, the coupling agents oftheir amine group adsorbed adsorbent materials [10]. on the surface of silica gel induce hydrophobicity at the material surface. Therefore, the silica gel matrices’ surface assumes an organophilic character that enhances their performance as adsorbent materials [10].
Materials 2016, 9, 460
10 of 24
Materials 2016, 9, 460
10 of 24
Materials 2016, 9, 460
10 of 24
(A) (A)
(B) (B)
(A) (A)
(B) (B)
Figure 5. SEM morphological structure of (A) amine-functionalized silica gel (ANSG) and (B) Figure 5. SEM morphological structure of (A) amine-functionalized silica gel (ANSG) and (B) magnetic Figure 5. amine-functionalized SEM morphological silica structure of (A) amine-functionalized silica gel (ANSG) and (B) magnetic gel (MANSG). amine-functionalized silica gel (MANSG). magnetic amine-functionalized silica gel (MANSG).
Figure 6. TEM imaging of (A) amine-functionalized silica gel (ANSG) and (B) magnetic Figure 6. TEM imaging of (A) amine-functionalized silica gel (ANSG) and (B) magnetic amine-functionalized silica gel Figure 6. TEM imaging of (MANSG). (A) amine-functionalized silica gel (ANSG) and (B) magnetic amine-functionalized silica gel (MANSG). amine-functionalized silica gel (MANSG).
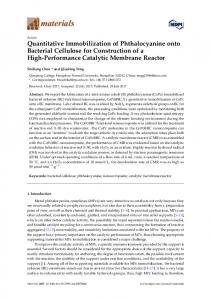
In order to investigate the magnetic properties of the fabricated magnetic amine-functionalized order to investigate thethe magnetic properties of the magnetic amine-functionalized silicaIngel hybrid (MANSG), magnetization curve offabricated the material at room temperature was In order to investigate the magnetic properties of the fabricated magnetic amine-functionalized silica gel hybrid (MANSG), the magnetization curve of thehysteresis material loop at room temperature was elucidated at Figure 7. It was indicated that the magnetization appears with an S-like silica gel hybrid (MANSG), the magnetization curve of the material at roomloop temperature was an elucidated elucidated It was indicated that the magnetization hysteresis appears silica with shape; thusat itFigure does 7.not display magnetic remanence. Accordingly, the magnetic gelS-like was at Figure 7.thus It was indicated that the magnetic magnetization hysteresis loop appears an S-like shape; it shape; not display remanence. Accordingly, the7with magnetic silica gel thus was considered toitbedoes a super-paramagnetic matrix. It is observed from Figure that the magnetization is does not display remanence. the magnetic silica was to be considered to bemagnetic a super-paramagnetic matrix. is the observed from Figure 7gel that the considered magnetization is a completely saturated at a value of 22.775Accordingly, emu/g Itfor MANSG matrix. The comparatively low value super-paramagnetic matrix. It is observed from Figure 7 that the magnetization is completely saturated completely saturated at a value of(MS) 22.775may emu/g the MANSG matrix. comparatively low value of the saturation magnetization be for in regards to the good The dispersion of the magnetite at aof value of 22.775 emu/g thematrices, MANSG matrix. Thetocomparatively low valueofofthe themagnetite saturation the saturation (MS) may which be in regards tothe theeasiest good dispersion nanoparticles in magnetization the silicaforgel lead formation the magnetic magnetization may be ingel regards tothat the good dispersion the magnetite nanoparticles nanoparticles matrices, which lead to the of easiest formation of the magnetic domain [18]. (MS) Itincanthe be silica readily observed the smaller particle sizes exhibit a smaller value of in Ms,the silica gel matrices, which lead toobserved the easiest ofparticle the magnetic domain [18]. It value can beofreadily domain [18]. due It can that the smaller sizes exhibit a smaller Ms, as expected, to be thereadily surface disorder andformation modified cationic distribution [19]. as expected, duesmaller to the surface and modified cationic distribution [19]. observed that the particle sizes exhibit a smaller value of Ms, as expected, to the surface The thermal profile of thedisorder fabricated MANSG hybrid is investigated in Figure due 8. The resulting thermal profile of the fabricated MANSG hybrid is investigated in Figureof 8. 26–128 The resulting disorder and modified cationic distribution [19]. TGAThe material profile (Figure 8A) showed two main degradation steps at mid-points °C and TGA profile (Figure showed two main steps at mid-points ofloss 26–128 °C and 302–633 °C. The first gradual loss step assigned withdegradation a low percent of material equivalent Thematerial thermal profile of the8A) fabricated MANSG hybrid is investigated in weight Figure 8. The resulting ˝ C and 302–633 The first(Figure gradual loss stepof assigned withdegradation aand low water percent of material weight loss equivalent to material 7% °C. corresponds to the loss humidity contamination in of the magnetic TGA profile 8A) showed two main steps at mid-points 26–128 ˝ to 7% corresponds to the loss of humidity and water contamination in the magnetic amine-functionalized silica gel matrix. The second degradation step represents the de-hydroxylation 302–633 C. The first gradual loss step assigned with a low percent of material weight loss equivalent to silica matrix. The second degradation step represents the de-hydroxylation of the organic to amine group, which wasand grafted onto the silica surface [20]. Generally, the total weight 7%amine-functionalized corresponds the loss of gel humidity water contamination in the magnetic amine-functionalized of the organic amine group, which was grafted onto the silica surface [20]. Generally, the total weight losses with respect to the surface water and amine group degradation of the magnetic matrix silica gel matrix. The second degradation step represents the de-hydroxylation of thehybrid organic amine losses with respect to the results surfaceindicate water and amine group degradation of the magnetic hybrid hybrid matrix are less than 15%. These the high thermal stability of the fabricated MANSG group, which was grafted onto the silica surface [20]. Generally, the total weight losses with respect are less than results indicate the high thermal stability of the fabricated MANSG hybrid material up water to15%. 800 These °C. to the surface and amine group degradation of the magnetic hybrid matrix are less than 15%. material up to 800 °C. These results indicate the high thermal stability of the fabricated MANSG hybrid material up to 800 ˝ C.
Materials 2016, 9, 460
11 of 24
Materials 2016, 2016, 9, 9, 460 460 Materials
11 of of 24 24 11 30 30
M om ent/M ass u/g) M om ent/M ass(em (em u/g)
20 20 10 10 0 0 -10 -10 -20 -20 -30 -30 -20000 -15000 -10000 -5000 -20000 -15000 -10000 -5000
0 5000 0 5000 Field (G) Field (G)
10000 10000
15000 15000
20000 20000
Figure 7. Isothermal M-H hysteresis curve of the magnetic amine-functionalized silica
Figure 7. Isothermal M-H hysteresis curve of the magnetic amine-functionalized silica Figure 7. Isothermal M-H hysteresis curve of the magnetic amine-functionalized silica gel (MANSG). gel (MANSG). gel (MANSG).
(A) (A)
(B) (B) Figure 8. Thermal profile of magnetic amine-functionalized silica gel (MANSG): (A) TGA; (B) DSC.
Figure 8. Thermal profile magneticamine-functionalized amine-functionalized silica (MANSG): (A)(A) TGA; (B) DSC. Figure 8. Thermal profile ofofmagnetic silicagel gel (MANSG): TGA; (B) DSC.
The DSC DSC pattern pattern of of the the MANSG MANSG hybrid hybrid material material (Figure (Figure 8B) 8B) verifies verifies the the previously previously discussed discussed TheThe DSC pattern of the MANSG hybrid material (Figure 8B) The verifies the previously discussed TGA results, where it shows two main endothermic peaks. first broad endothermic peakTGA TGA results, where it shows two main endothermic peaks. The first broad endothermic peak results, where it shows two main endothermic peaks. The first broad endothermic peak represented represented around around 100 100 °C °C was was attributed attributed to to the the heat heat losses losses due due to to the the gradual gradual loss loss of of external external water water represented around 100 ˝ Cfrom wasthe attributed toThis the isheat lossesby due to the gradual loss of external water molecules molecules material. followed a narrow shoulder, which terminates in another molecules from the material. This is followed by a narrow shoulder, which terminates in another
from the material. This is followed by a narrow shoulder, which terminates in another broad peak at a temperature of around 300 ˝ C, which may be ascribed to the combustion of the amine group grafted onto the silica gel surface [20].
Materials 2016, 9, 460
12 of 24
Materials 9, at 460a temperature of around 300 °C, which may be ascribed to the combustion of the amine 12 of 24 broad2016, peak
group grafted onto the silica gel surface [20].
3.4.3.4. Copper Sorption Nano-SilicaGel Gel Copper SorptionProfile Profileofofthe theMagnetic MagneticAmine-Functionalized Amine-Functionalized Nano-Silica The amine-functionalizedsilica silicagelgelafter after Thecopper coppersorption sorption properties properties of of the the optimized optimized amine-functionalized nano-magnetite immobilization (MANSG) were investigated to explore the diversity of its behavior nano-magnetite immobilization (MANSG) were investigated to explore the diversity of its behavior toward thethe copper ions. toward copper ions. Firstly, amine-functionalizednano-silica nano-silica Firstly,the thecopper coppersorption sorption profiles profiles of of both both magnetic magnetic amine-functionalized gelgel hybrid (MANSG) and its parent activated silica gel before amine functionalization were compared hybrid (MANSG) and its parent activated silica before amine functionalization were compared to to investigate the effect on the thecopper coppersorption sorptionprocess. process. other investigate the effectofofamine aminegroup groupfunctionalization functionalization on OnOn thethe other hand, a comparableinvestigation investigationbetween between the the copper sorption magnetic hybrid hand, a comparable sorptionbehavior behaviorofofboth boththe the magnetic hybrid (MANSG) and amine-functionalizedsilica silica gel gel before magnetite showed thethe (MANSG) and amine-functionalized magnetiteimmobilization immobilization(ANSG) (ANSG) showed effect of the magnetite immobilization process. Figure 9A implies that the copper decontamination effect of the magnetite immobilization process. Figure 9A implies that the copper decontamination of of activated gel improved 10%–98% forfabricated the fabricated MANSG. confirms the activated silicasilica gel improved fromfrom 10%–98% for the MANSG. This This confirms that that the amine amine functional group has a great influence on the copper removal process of the magnetic silica gel functional group has a great influence on the copper removal process of the magnetic silica gel hybrid. hybrid. Figure 9B evidences that the magnetic hybrid (MANSG) attains 80% copper removal Figure 9B evidences that the magnetic hybrid (MANSG) attains 80% copper removal compared to compared to 72% using copperANSG. removal using ANSG. Accordingly, the presence magnetite in the 72% copper removal Accordingly, the presence of magnetite in theofamine-functionalized amine-functionalized silica gel slightly increases the capacity of the hybrid for the copper sorption silica gel slightly increases the capacity of the hybrid for the copper sorption process. Finally, it was process. Finally, it was indicated from the comparable investigation (Figure 9) that both MANSG and indicated from the comparable investigation (Figure 9) that both MANSG and ANSG have a high ANSG have a high copper sorption efficiency and compared to their parent material of activated copper sorption efficiency and compared to their parent material of activated silica gel. Furthermore, silica gel. Furthermore, the sorption process onto these materials occurred rapidly and reached the sorption process onto these materials occurred rapidly and reached equilibrium after 90 min equilibrium after 90 min compared to the activated silica gel. This is likely due to the higher compared to the silicathrough gel. Thisthe is amine likely due to present the higher accessibility of copper analyte accessibility of activated copper analyte group in both the amine-functionalized through the and amine present in both the amine-functionalized silica gel andprocess its magnetic hybrid silica gel its group magnetic hybrid matrices [21]. The copper decontamination onto both matrices [21]. The copper decontamination process onto both MANSG and ANSG showed a fast rate MANSG and ANSG showed a fast rate of sorption during the first hour of the sorbate-sorbent contact, of and sorption during the first hour of the sorbate-sorbent contact, and the rate of copper percent removal the rate of copper percent removal became almost insignificant due to the quick exhaustion of became almost active insignificant due to thethe quick of the sorption active sites.was Moreover, the rate the sorption sites. Moreover, rateexhaustion of the percent of copper ion removal higher in the of beginning the percentdue of copper removal wasarea higher in the beginning due available to the larger area ofofthe to the ion larger surface of the adsorbent being for surface the sorption adsorbent being available for the sorption of the ions [22]. the ions [22].
Figure 9. Comparable investigation of the influence of contact on copper sorption process: Figure 9. Comparable investigation of the influence of contact timetime on copper sorption process: (A) for (A) for both MANSG and its parent activated silica gel (Activated SG); (B) for both MANSG and its both MANSG and its parent activated silica gel (Activated SG); (B) for both MANSG and its parent parent amine-functionalized nano-silica gel (ANSG). Solution concentration of ion = 1000 ppm; amine-functionalized nano-silica gel (ANSG). Solution concentration of ion = 1000 ppm; amount of amount of adsorbent = 0.25 g; agitation speed = 200 rpm; solution volume = 25 mL; pH = 7. adsorbent = 0.25 g; agitation speed = 200 rpm; solution volume = 25 mL; pH = 7.
The effect of adsorbent dosage on the adsorption process was examined at the equilibrium time. The effect of adsorbent dosage on the adsorption process was examined at the equilibrium Figure 10 indicates that the percentage of copper ion removal increased from 62%–99.9% as the time. Figuredosage 10 indicates thatfrom the percentage of copper removal fromin62%–99.9% MANSG increased 5–60 g/L. This may be ion in regards to increased the increment the numberasofthe MANSG dosage increased from 5–60 g/L. This may be in regards to the increment in the number of sorption sites (functional groups) at the adsorbent surface, which increase by increasing the dose of the adsorbent material toward the fixed copper ion concentration. These functionalized chemical groups of MANSG were important in the formation of van der Waals bonding with copper ions.
Materials 2016, 9, 460
13 of 24
Materials 2016, 9, 460
13 of 24 sorption Materials 2016,sites 9, 460(functional groups) at the adsorbent surface, which increase by increasing the dose 13 of of 24
sorption sites (functional groups) at fixed the adsorbent surface, which increase increasing thechemical dose of the adsorbent material toward the copper ion concentration. Theseby functionalized the adsorbent material the fixed ion concentration. These functionalized chemical groups of MANSG weretoward important in thecopper formation of van der Waals bonding with copper ions. Therefore, theMANSG additional functional silica gelbonding hybridplayed played essential groups of were importantgroups in the inside formation of van dersilica Waals with copper ions. Therefore, the additional functional groups inside the the magnetic magnetic gel hybrid anan essential rolerole in metal ions’ binding adsorption process, in addition addition tothe the adsorption properties Therefore, theions’ additional functional inside the magnetic silica to gel hybrid playedproperties an essential in metal bindingduring duringthe thegroups adsorption process, in adsorption of of immobilized nano-magnetite onto optimum dosageof ofMANSG MANSG maybeproperties be considered role in metal ions’ binding during thesilica adsorption process, in addition to the adsorption of immobilized nano-magnetite ontothe silicagel. gel. The The optimum dosage may considered as 20 g/L [22,23]. immobilized nano-magnetite onto the silica gel. The optimum dosage of MANSG may be considered as 20 g/L [22,23]. as 20 g/L [22,23].
Figure Effectofofthe theMANSG MANSGdose dose on on the the copper copper sorption sorption process of of Figure 10.10.Effect process (solution (solutionconcentration concentration ion = 1000 ppm; time = 90 min; agitation speed = 200 rpm; solution volume = 25 mL; pH = 7). Figure 10. Effect of the MANSG dose on the copper sorption process (solution concentration of ion = 1000 ppm; time = 90 min; agitation speed = 200 rpm; solution volume = 25 mL; pH = 7). ion = 1000 ppm; time = 90 min; agitation speed = 200 rpm; solution volume = 25 mL; pH = 7).
The effect of initial metal ion concentration depends on the immediate relation between the The effect of initial metal ion concentration depends on the immediate relation between the The effectofofthe initial ionavailable concentration depends immediate relation the concentration ion metal and the binding sites ononanthe adsorbent surface. It isbetween clear from concentration of the ion and the available binding sites on an adsorbent surface. It is clear from concentration ion andinthe available sitessolution on an adsorbent surface. is clear from Figure 11 that of thethe increase ionic strengthbinding of copper from 10–1000 ppmIt using a fixed Figure 11 that the increase in ionic strength of copper solution from 10–1000 ppm using a fixed MANSG Figure 11amount that thedecreases increase in strength of copper solution a fixed MANSG theionic magnetic hybrid efficiency from from 89% 10–1000 down to ppm 80%.using Moreover, a amount decreases the magnetic hybrid from 89% down to 80%. Moreover, a dramatic decline MANSG amount the magnetic hybrid efficiency from 89% Moreover, a dramatic decline indecreases the percentage ofefficiency copper decontamination from 80%down downtoto80%. 17% was noticed in the percentage of in copper decontamination from 80%above down1000 to from 17% was as17% theusing ionicnoticed dramatic decline the percentage of copper decontamination 80% down was as the ionic strength of the copper solution increased ppm, up noticed to 5000to ppm, astrength fixed of the copper solution increased above ppm, up to 5000 ppm, a5000 fixed MANSG as the ionic strength of the copper solution increased 1000 ppm, up tothe ppm, using aamount. fixed MANSG amount. This may be due to the1000 saturation ofabove adsorption sitesusing onto MANSG surface with This may be due to the saturation of adsorption sites onto the MANSG surface with copper ions; where MANSGions; amount. This be due to the saturation of adsorption sites onto the MANSG copper where atmay a low copper concentration, there will be unoccupied active surface sites onwith the at amagnetic low copper concentration, there willconcentration, be unoccupied active sites on the the active magnetic surface. copper ions; where at a As lowthe copper there will be unoccupied active sites on the hybrid surface. initial copper concentration increases, siteshybrid required for As copper the initial copper concentration increases, the concentration active sites required forthe copper ions’ will magnetic hybrid surface. Asbe thelacking initial copper increases, active sitesadsorption required for ions’ adsorption will [22]. be lacking [22]. adsorption will be lacking [22]. copper ions’
Figure 11. Effect of initial copper ion concentration on the copper sorption process using MANSG (time = 11. 90 min; amount of MANSG 0.25 g; agitation = 200 sorption rpm; solution volume 25 mL; Figure Effect of initial copper ion=concentration concentration on speed the copper copper process using Figure 11. Effect of initial copper ion on the sorption process using=MANSG MANSG pH = 7). (time = 90 min; amount of MANSG = 0.25 g; agitation speed = 200 rpm; solution volume = 2525 mL; (time = 90 min; amount of MANSG = 0.25 g; agitation speed = 200 rpm; solution volume = mL; pH = 7). pH = 7).
Materials 2016, 9, 460 Materials 2016, 9, 460
14 of 24 14 of 24
The acidity of waste solution has two effects on metal ion adsorption onto a specific adsorbent material. material. Firstly, Firstly, concerning concerning the the acidic acidic media, media, the the protons’ protons’ presence presence in in the the acidic solutions can protonate the binding sites of the chelating molecules. However, the hydroxide presence in the basic However, solutions order to to elucidate thethe influence of solutions may may be becomplex complexand andprecipitates precipitatesmany manymetal metalions ions[9]. [9].InIn order elucidate influence this important parameter in the sorption process, the the pH pH of the copper solution waswas varied overover the of this important parameter in the sorption process, of the copper solution varied 2–12 range through the batch procedure. FigureFigure 12 declares that the adsorption percentage of Cu(II) the 2–12 range through the batch procedure. 12 declares that the adsorption percentage of sorption onto MANSG increases with the increase in the in pHthe values for thefor studied pH range. This Cu(II) sorption onto MANSG increases with the increase pH values the studied pH range. may be related to the factfact thatthat at aatlow pH, thethe MANSG This may be related to the a low pH, MANSGsurface surfacetends tendstotobe bemore more positive, positive, and electrostatic electrostatic repulsion repulsion with with copper copper cations cations takes takes place, inhibiting inhibiting the sorption process, resulting in decreasing copper coppersorption sorptiononto ontoMANSG. MANSG. Therefore, optimum pH values formaximum the maximum Therefore, thethe optimum pH values for the Cu(II) Cu(II) were at pH ≥ 7. In order to avoid hydrolyzing, which may cause copper ion precipitation at were at pH ě 7. In order to avoid hydrolyzing, which may cause copper ion precipitation at higher higher pH values was chosen as the optimum for screening the influence pH values (above (above seven),seven), pH 7.0pH was7.0 chosen as the optimum pH forpH screening the influence of the of the remaining processing parameters on the sorption process. Moreover, this pHthe simulates remaining processing parameters on the sorption process. Moreover, this pH simulates natural the pH natural pH of drinking water [24]. This result of the optimum pH value for copper removal onto of drinking water [24]. This result of the optimum pH value for copper removal onto MANSG was MANSG many other researchers [9,25]. confirmedwas by confirmed many otherbyresearchers [9,25].
Figure Figure 12. 12. Effect Effect of of copper copper solution solution pH pH on on the the copper copper sorption sorption process process using using MANSG MANSG (solution (solution concentration = 200 concentration of of ion ion == 1000 1000 ppm; ppm; amount amount of of MANSG MANSG == 0.25 0.25 g; g; agitation agitation speed speed = 200 rpm; rpm; solution solution volume volume == 25 25 mL; mL; time time == 90 90 min). min).
The The effect effect of of agitation agitation speed speed on on the the percent percent of of copper copper removal removal using using MANSG MANSG was was monitored. monitored. The percentageof ofcopper copperremoval removalseemed seemedtoto affected agitation speed values between 0 The percentage bebe affected byby thethe agitation speed for for values between 0 and and 200 rpm, thus confirming that the influence of external diffusion on the copper sorption kinetics 200 rpm, thus confirming that the influence of external diffusion on the copper sorption kinetics plays plays a significant role; the where the increase in the speed agitation speed the decreases the layer boundary layer a significant role; where increase in the agitation decreases boundary resistances, resistances, which the transfer copper mass transfer into theincreasing bulk solution, increasing the process. copper which improve the improve copper mass into the bulk solution, the copper sorption sorption process. However, as the mixing rate was improved above 200 rpm, the percentage of copper However, as the mixing rate was improved above 200 rpm, the percentage of copper removal was still removal was still almost constant. Accordingly, a 200-rpm shaking rate is sufficient to assure that almost constant. Accordingly, a 200-rpm shaking rate is sufficient to assure that the entirety of the the entirety of the surface binding sites onto MANSG is readily available for copper ions’ uptake and is surface binding sites onto MANSG is readily available for copper ions’ uptake and is selected as the selected as the optimum mixing speed [24]. optimum mixing speed [24]. The onon thethe copper sorption process is illustrated in Figure 13. This The effect effectof ofsolution solutiontemperature temperature copper sorption process is illustrated in Figure 13. figure displays that the adsorption process of copper ions onto MANSG may be an exothermic This figure displays that the adsorption process of copper ions onto MANSG may be an exothermic process. process. This This sorption sorption behavior behavior may may tend tend to to decrease decrease the the copper copper sorption sorption onto onto MANSG MANSG as as the the ˝ solution temperature improved above 25 °C. This decline in the copper sorption with the increment solution temperature improved above 25 C. This decline in the copper sorption with the increment in in temperature may decrease the adsorptiveforces forcesbetween betweenthe themetal metalions ionsand andthe the active active sites sites on on the temperature may decrease the adsorptive the MANSG adsorbent surface as a result of decreasing its adsorption capacity [22]. MANSG adsorbent surface as a result of decreasing its adsorption capacity [22].
Materials 2016, 9, 460 Materials 2016, 9, 460 Materials 2016, 9, 460
15 of 24 15 of 24 15 of 24
Figure 13. Effect of solution temperature on the copper sorption process using MANSG (solution Figure of temperature the sorption process using concentration of ion = 1000 ppm; amount on of = 0.25 g; agitation 200 rpm;(solution solution Figure 13. 13. Effect Effect of solution solution temperature on MANSG the copper copper sorption processspeed= using MANSG MANSG (solution concentration of ion amount volume = 25 mL; timeppm; = 90 min). concentration of pH ion ===7;1000 1000 ppm; amount of of MANSG MANSG == 0.25 0.25 g; g; agitation agitation speed= speed= 200 200 rpm; rpm; solution solution volume 90 min). min). volume== 25 25 mL; mL; pH pH == 7; 7; time time = = 90
3.5. Regeneration of the Magnetic Amine-Functionalized Nano-Silica Gel 3.5. 3.5. Regeneration Regeneration of of the the Magnetic Magnetic Amine-Functionalized Amine-Functionalized Nano-Silica Nano-Silica Gel Gel Above all, magnetic-based nano-adsorbents can be produced at relatively low cost. The high Above magnetic-based nano-adsorbents can produced at low cost. adsorption capacity, low cost, easy separation and regeneration make Above all, all, magnetic-based nano-adsorbents can be be produced at relatively relatively lowmagnetic-based cost. The The high high adsorption capacity, low cost, easy separation and regeneration make magnetic-based nano-adsorbents nano-adsorbents technologically and easy economically advantageous. The main purpose of the recovery adsorption capacity, low cost, separation and regeneration make magnetic-based technologically and economically advantageous. The main purpose thepurpose recovery reuseand of and reuse of magnetic-based nanoparticles is to reduce the overall water treatment process nano-adsorbents technologically and economically advantageous. The of main ofand thecosts recovery magnetic-based nanoparticles is to properties reduceisthe overall water treatment process costs andcosts energy energy consumption. The magnetic these the materials facilitate their separation from the and reuse of magnetic-based nanoparticles toofreduce overall water treatment process and consumption. The magnetic properties of these materials facilitate their separation from the treatment treatment media usingThe an external magnetic field thefacilitate water treatment process from without energy consumption. magnetic properties ofafter thesefinishing materials their separation the media using an external field after the water treatment without any any requirement for power sources, such as finishing the centrifugational forcetreatment for process material separation. treatment media using an magnetic external magnetic field after finishing the water process without requirement forcontaminated power sources, such as such the centrifugational force for material Therefore, Therefore, the magnetic amine-functionalized nano-silica (MANSG) with the any requirement for power sources, as the centrifugational force gel forseparation. material separation. the contaminated magnetic amine-functionalized nano-silica gel (MANSG) with the adsorbed copper adsorbed ions collected magnetic after the treatment process was regenerated EDTA to be reused Therefore,copper the contaminated amine-functionalized nano-silica using gel (MANSG) with the ions collected after the treatment process wascopper regenerated using EDTA tousing be reused again as an again as ancopper efficient adsorbing material the sorption process from polluted wastewater. It adsorbed ions collected after thefor treatment process was regenerated EDTA to be reused efficient adsorbing material for the copper sorption process from polluted wastewater. It is indicated is indicated by Figureadsorbing 14 that the percentage of copper sorption desorption was increased with increasing theIt again as an efficient material for the process from polluted wastewater. by Figure 14by that the ofalmost coppercomplete desorption was increased with increasing the copper copper desorption timepercentage reaches desorption (100%) within 50with min.increasing Accordingly, is indicated Figure 14and that the percentage of copper desorption was increased the desorption time and reaches almost complete desorption (100%) within 50 min. Accordingly, MANSG MANSG was completely activated to be reused as a magnetic adsorbent material within 50 min using copper desorption time and reaches almost complete desorption (100%) within 50 min. Accordingly, was completely activated to bebeing reused a magnetic adsorbent material within min using 0.02 N 0.02 N EDTA solution; EDTA hexadentate chelating ligand that forms 50 awithin stronger complex MANSG was completely activated to abeas reused as a magnetic adsorbent material 50 min using 2+ EDTA solution; EDTA being a hexadentate chelating ligand that forms a amine-functionalized stronger the with the Cu ion compared to the amine group present in the magnetic silica 0.02 N EDTA solution; EDTA being a hexadentate chelating ligand that forms a complex stronger with complex 2+ ion compared to the amine group present in the magnetic amine-functionalized silica gel material. Cu 2+ gel material. with the Cu ion compared to the amine group present in the magnetic amine-functionalized silica gel material.
Figure Figure 14. 14. Desorption Desorption kinetics kinetics of of copper copper ions ions from from MANSG MANSG using using 0.02 0.02 N N EDTA. EDTA. Figure 14. Desorption kinetics of copper ions from MANSG using 0.02 N EDTA.
Materials 2016, 9, 460
16 of 24
3.6. Equilibrium Isotherm Modelling for Copper Decontamination Using Magnetic Amine-Functionalized Nano-Silica Gel The copper sorption data of MANSG recorded at equilibrium conditions have been analyzed using the linear forms of different equilibrium isotherm models. The applicability of these isotherm equations to the sorption systems was compared by judging the correlation coefficients, R2 [26]. 3.6.1. Langmuir Isotherm The linear form of the Langmuir isotherm is presented in Equation (3): 1 1 Ce “ Ce ` qe qm qm b
(3)
where qe is the amount of solute adsorbed per unit weight of adsorbent at equilibrium (mg/g), Ce the equilibrium concentration of the solute in the bulk solution (mg/L), qm the maximum adsorption capacity (mg/g) and b the constant related to the free energy of adsorption (L/mg) [27]. The adsorption data for copper ions onto MANSG at equilibrium were analyzed to fit the linearized expression of the Langmuir isotherm model that is investigated in Figure 15a. The calculated correlation coefficient value of this model was ranged between R2 = 0.9981-0.9223 indicates that there is strong positive evidence that the adsorption of Cu onto MANSG follows the Langmuir isotherm. Accordingly, the copper sorption process is suggested to take place as mono-layer adsorption onto the fabricated magnetic hybrid. These results confirm the amine functionality of silica gel; where, the mono-layer adsorption of copper gives the prediction of some sort of chemical reaction happening between the adsorbent matrix and copper ions [28]. Therefore, it can be concluded that the copper ions’ decontamination using MANSG takes place through the chelation process. Langmuir parameters for copper ions sorption, qm and b, were calculated from the slope and intercept of this figure and are tabulated in Table 1. It was indicated from this table that the maximum mono-layer adsorption capacity of 140.845070 mg/g was recorded at room temperature (25 ˝ C). Moreover, Table 1 evidences that the increase in the solution temperature is associated with decline of the value of the maximum mono-layer adsorption capacity (qm ). These results confirm the exothermic nature of the copper sorption process onto MANSG. The essential characteristics of the Langmuir isotherm are defined by a dimensionless separation factor, RL , which is indicative of the isotherm shape that predicts whether an adsorption system is favorable or unfavorable. RL is defined as [27]: RL “
1 1 ` bCO
(4)
where (Co ) is the initial concentration of copper ions in the solution; the calculated values of RL are tabulated in Table 1. The calculating values of RL for copper ions’ sorption using MANSG showed favorable adsorption, since the RL values fall between zero and one [29]. This again confirms that the Langmuir isotherm was favorable for the sorption of copper ions onto MANSG under the conditions used in this study. Table 1. Estimated parameters of the Langmuir isotherm for copper sorption onto MANSG at different solution temperatures. Solution Temperature (˝ C)
qm (mg/g)
b (L/mg)
R2
RL
25 35 50 65 75 85
140.85 136.99 126.58 122.21 115.135 109.87
0.0052 0.0042 0.0039 0.0026 0.0014 0.001
0.9981 0.9981 0.9943 0.9875 0.9028 0.9223
0.951–0.037 0.957–0.043 0.962–0.049 0.975–0.072 0.986–0.123 0.988–0.142
Materials 2016, 9, 460 Materials 2016, 9, 460
17 of 24 17 of 24
Figure 15. Equilibrium Equilibrium isotherm isotherm models models for for the the copper copper sorption sorption process process at at different different solution temperatures temperatures (amount (amount of of MANSG MANSG == 0.25 0.25 g; g; agitation agitation speed speed == 200 200 rpm; rpm; solution solution volume volume == 25 25 mL; mL; pH == 7): 7): (a) (a) Langmuir Langmuir isotherm isotherm model; model; (b) (b) Freundlich Freundlich isotherm isothermmodel; model;(c) (c) Temkin Temkin isotherm isotherm model; model; (d) Elovich isotherm model.
3.6.2. Freundlich Freundlich Isotherm that encompasses thethe heterogeneity of sites and The Freundlich Freundlich isotherm isothermisisan anempirical empiricalequation equation that encompasses heterogeneity of sites the exponential distribution of sites and their energies. The sorption data have using and the exponential distribution of sites and their energies. The sorption data been have analyzed been analyzed the logarithmic form of the of Freundlich isotherm as shown below:below: using the logarithmic form the Freundlich isotherm as shown 1 ln qqee “ Kf ` 1 ln C Ce ln K n n
(5) (5)
where KF and n are Freundlich constants related to adsorption capacity and adsorption intensity, where KF and n are Freundlich constants related to adsorption capacity and adsorption intensity, respectively; the constant KF is related to the sorption capacity of the sorbent material, and the respectively; the constant KF is related to the sorption capacity of the sorbent material, and the parameter 1/n is indicative of the intensity of the adsorption between the adsorbent-adsorbate, parameter 1/n is indicative of the intensity of the adsorption between the adsorbent-adsorbate, calculated in Figure 15b. The inverse of n indicates how strongly the copper ions attached to the calculated in Figure 15b. The inverse of n indicates how strongly the copper ions attached to the MANSG surface [26]. The magnitude of the exponent n gives an indication of the favorability of MANSG surface [26]. The magnitude of the exponent n gives an indication of the favorability of adsorption. It is generally stated that the calculated values of n ranged from 2–10, which represent adsorption. It is generally stated that the calculated values of n ranged from 2–10, which represent good adsorption. However, if the n value falls to 1–2, this gives a prediction of the difficulty of the good adsorption. However, if the n value falls to 1–2, this gives a prediction of the difficulty of the adsorption process. If the n value is less than one, this represents poor adsorption characteristics. adsorption process. If the n value is less than one, this represents poor adsorption characteristics. Regarding our case study that deals with copper sorption onto MANSG, the calculated n value Regarding our case study that deals with copper sorption onto MANSG, the calculated n value was was equal to 2.3 at 25 ˝ C (Table 2). Therefore, MANSG represents a good adsorbent for copper equal to 2.3 at 25 °C (Table 2). Therefore, MANSG represents a good adsorbent for copper ions. ions. However, it is indicated by Table 2 that the calculated n value was decreased with increasing However, it is indicated by Table 2 that the calculated n value was decreased with increasing solution solution temperature, indicating the negative effect of heat on the copper ions’ adsorption process on temperature, indicating the negative effect of heat on the copper ions’ adsorption process MANSG [30]. on MANSG [30].
Materials 2016, 9, 460
18 of 24
Table 2. Estimated parameters of the Freundlich isotherm for copper ions’ sorption onto MANSG at different solution temperatures. Solution Temperature (˝ C)
Kf
n
R2
25 35 50 65 75 85
5.55 4.6 3.74 2.31 1.18 0.76
2.37 2.27 2.2 1.99 1.68 1.57
0.88 0.86 0.82 0.8 0.71 0.76
Comparing the correlation coefficient values (0.8709–0.7082) of the Freundlich linearity with that of the Langmuir linearity, it can be observed that the Langmuir isotherm model was more suitable to describe the copper sorption process onto MANSG because of its higher correlation coefficient values compared to the Freundlich isotherm [30]. These results give an indication of the prevalence of the mono-layer adsorption of copper ions onto MANSG, rather than the multi-layer adsorption. These results show the vital role of the amine functional group in silica gel in the copper ions’ chelation process rather than physical adsorption onto the magnetic surface. 3.6.3. Temkin Isotherm The linear form of the Temkin isotherm is shown in Equation (6): qe “ B ln KT ` B ln Ce
(6)
where B“
RT b
(7)
The Temkin isotherm assumes that the adsorption is characterized by a uniform distribution of the binding energies, up to some maximum energy B, which is related to the heat of adsorption; R is the universal gas constant (J/mol¨ K); T is the temperature (K); b is the variation of the adsorption energy (J/mol); and KT is the equilibrium binding constant (L/mg) corresponding to the maximum binding energy. A plot of qe vs. lnCe (Figure 15c) enables the determination of the isotherm constants B and KT from the slope and the intercept, respectively [28]. The adsorption data for copper ions onto MANSG at equilibrium were analyzed by a regression analysis to fit the Temkin isotherm model; the higher values of the correlation coefficient that ranged between 0.9868 and 0.9258 show a good linearity. Therefore, the Temkin isotherm model can describe the copper adsorption process onto MANSG [30]. The calculated Temkin isotherm parameters are listed in Table 3. The variation in the adsorption energy (b) is positive over the studied temperature range, which confirms that the copper adsorption reaction onto MANSG is exothermic [30]. Table 3. Estimated parameters of Temkin isotherm for copper ions sorption onto MANSG at different solution temperatures. Solution Temperature (˝ C)
KT (L/mg)
B
b (J/mol)
R2
25 35 50 65 75 85
0.12 0.09 0.08 0.05 0.03 0.02
22.497 22.794 21.91 23.192 24.601 23.875
0.11 0.11 0.12 0.12 0.12 0.12
0.99 0.99 0.98 0.97 0.95 0.93
3.6.4. Elovich Isotherm The linear form of the Elovich isotherm is shown in Equation (8):
Materials 2016, 9, 460
19 of 24
Materials 2016, 9, 460
ln
19 of 24
qe qe “ lnpKE ˆ qm q ´ Ce qm
qe
(8)
qe
qm )as the correlation coefficients for the(3) KEwell The Elovich isotherm constants, KElnand qmln( , as copper Ce qm ions’ adsorption system using MANSG are obtained from Figure 16d. The value of the maximum The Elovich isotherm constants, K E and the qm, aslinear well astransformation the correlation coefficients for theequation copper is adsorption capacity (qm ) determined using of the Elovich ions’ adsorption system using MANSG are obtained from Figure 16d. The value of the maximum equivalent to 39.6825 mg/g, which is much lower than that estimated from the Langmuir equation adsorption capacity (qm)temperature, determined using the linear transformation of the equation is (140.845 mg/g) at ambient as shown in Table 4. This means thatElovich the assumption of the equivalent to 39.6825 mg/g, which is much lower than that estimated from the Langmuir equation exponential covering of adsorption sites that implies multilayer adsorption is not accepted. This result (140.845 mg/g) at ambient temperature, as shown in Table 4. This means that the assumption of the gives the predication that the copper ion sorption process takes place through mono-layer sorption exponential covering of adsorption sites that implies multilayer adsorption is not accepted. This onto MANSG, confirming that the process is mainly chelation and confirming the previous results. result gives the predication that the copper ion sorption process takes place through mono-layer Therefore, the Elovich modelconfirming is not suitable to describe adsorption ofand copper ions onto sorption onto MANSG, that the process isthe mainly chelation confirming the MANSG previous [30]. Furthermore, Table 4 illustrates theisvalues of thetocorrelation coefficients not high results. Therefore, the Elovichthat model not suitable describe the adsorption are of copper ionsenough onto to confirm the linearity of the Elovich MANSG [30]. Furthermore, Tableequation. 4 illustrates that the values of the correlation coefficients are not
high enough to confirm the linearity of the Elovich equation. Table 4. Estimated parameters of the Elovich isotherm for the adsorption of copper ions onto MANSG Table 4. Estimated parameters of the Elovich isotherm for the adsorption of copper ions onto MANSG at different solution temperatures. at different solution temperatures.
Solution Temperature (˝ C) (°C)Ke K (L/mg) Solution Temperature e (L/mg) 25 25 0.040.04 35 35 0.023 0.023 50 50 0.020.02 65 65 0.010.01 75 75 0.003 0.003 85 0.002 85 0.002
(mg/g) qqmm(mg/g) 39.68 39.68 41.67 41.67 42.37 42.37 51.55 51.55 76.92 76.92 85.47 85.47
2
R2 R 0.890.89 0.880.88 0.8 0.8 0.690.69 0.350.35 0.33 0.33
Figure 16. Kinetic models coppersorption sorptionprocess process (solution = 25 of of Figure 16. Kinetic models forfor thethe copper (solutiontemperature temperature = °C; 25 ˝amount C; amount MANSG = 0.25 g; agitation speed = 200 rpm; solution volume = 25 mL; pH = 7): (a) pseudo-first-order MANSG = 0.25 g; agitation speed = 200 rpm; solution volume = 25 mL; pH = 7): (a) pseudo-first-order rate model; (b) pseudo-second-order rate model; (c) the simple Elovich model. rate model; (b) pseudo-second-order rate model; (c) the simple Elovich model.
Materials 2016, 9, 460
20 of 24
3.6.5. Dubinin-Radushkevich Isotherm The Langmuir and Freundlich isotherms are insufficient to explain the physical and chemical characteristics of the adsorption process. The Dubinin-Radushkevich (D-R) isotherm is commonly used to describe the sorption isotherms of single solute systems. The D-R isotherm, apart from being the analogue of the Langmuir isotherm, is more general than the Langmuir isotherm, as it rejects the homogeneous surface or constant adsorption potential. The D-R isotherm is expressed as [31]: ln qe “ ln qm ´ βε2
(9)
ˆ ˙ 1 ε “ RTln 1 ` a “ 1 Ce
(10)
where
where qe is the amount of metal ions adsorbed per unit weight of MANSG (mg/g), qm is the maximum sorption capacity (mg/g), β is the activity coefficient related to adsorption mean energy (mol2 /kJ2 ) and ε is the Polanyi potential described as a function of Ce that represents the equilibrium concentration of the Cu(II) in solution (mg/L), R is the gas constant (8.314 J/mol K) and T is the temperature [32]. The D-R isotherm model is applied to the equilibrium data obtained from the empirical studies for copper ions’ removal using MANSG to determine the nature of the sorption processes whether it is physical or chemical. A plot of lnqe against ε2 (figure not investigated) yields a straight line with R2 values ranging between 0.8381 and 0.8159 (table not investigated), indicating that the D-R model is less fit to the experimental data compared to the Langmuir and Temkin isotherm models, indicating that the D-R model was not able to describe adequately the relationship between the amount of Cu ions sorbed by MANSG and its equilibrium concentration in the solution [33]. 3.7. Copper Sorption Kinetic Modelling 3.7.1. Pseudo-First-Order Rate Model The first-order rate equation of Lagergren is one of the most widely-used ones for the sorption of a solute from liquid solution and is represented as: lnpqe ´ qt q “ ln qe ´ K1 t
(11)
where qe and qt are the amounts of ions sorbed (mg/g) at equilibrium and at time t (min), respectively, and K1 (min´1 ) is the first-order reaction rate constant. The first-order-rate constant K1 can be obtained from the slope of the plot ln(qe ´ qt ) vs. time, as illustrated in Figure 16a. The pseudo-first-order considers the rate of occupation of adsorption sites to be proportional to the number of unoccupied sites. The estimated reaction rate constant and the correlation coefficient (R2 ) values of the first-order rate model fitting are reported in Table 5. It was indicated from this table that the correlation coefficients are not high enough for all studied copper concentrations (R2 ~ 0.93), Furthermore, the estimated values of qe calculated from the equation differ from the experimental values, which indicate that the kinetics of copper sorption onto MANSG cannot be described by the first-order equation [34].
Materials 2016, 9, 460
21 of 24
Table 5. Estimated kinetic parameters for the first-order rate kinetic model at different copper concentrations. Initial Concentration of Cu Ion (ppm)
R2
K1 (min´1 )
qe (cal.) (mg/g)
qe (exp.) (mg/g)
100 500 750 1000 2000 3000 4000 5000
0.93 0.95 0.95 0.94 0.99 0.98 0.97 0.95
0.025 0.032 0.041 0.021 0.03 0.037 0.03 0.037
0.616 3.194 3.758 4.559 7.798 7.53 7.464 7.716
0.86 4.52 6.667 8.05 8.333 6.667 8 6.663
3.7.2. Pseudo-Second-Order Rate Model This model is based on the sorption equilibrium capacity and may be expressed in the form: t 1 t “ ` qt qe K2 q2e
(12)
where K2 is the second-order reaction rate equilibrium constant (g/mg min). A plot of t/qt against t should give a linear relationship for the applicability of the second-order kinetic. Figure 15b shows the linearized form of the pseudo-second-order model for describing the sorption process of different initial copper ion concentrations onto MANSG. The correlation coefficients (R2 ) for the pseudo-second-order rate model and its parameters are investigated in Table 6. The results obtained from applying the second order kinetic model indicated that the correlation coefficient (R2 ) values of model fitting are high enough (