... ABBOTT,t Sylvia MESSMER,* Michael MACKNESS,t Paul DURRINGTON,t ...... 27 Steinberg, K. K., Cooper, G. R., Graiser, S. R. and Rosseneu, M. (1983) Clin.
Biochem. J.
Biochem.
J.
549
(1 994) 304, 549-554 (Printed in Great Britain) (1994)
304,
549-554
Quantification of human serum paraoxonase by enzyme-linked immunoassay: population differences in protein concentrations Marie-Claude BLATTER GARIN,* Caroline ABBOTT,t Sylvia MESSMER,* Michael MACKNESS,t Paul DURRINGTON,t Daniel POMETTA* and Richard W. JAMES*: *Division of Diabetology, Department of Medicine, University Hospital, 24 rue Micheli-du-Crest, 1211 Geneva 14, Switzerland, and tDepartment of Medicine, University of Manchester, The Royal Infirmary, Manchester M13 9WL, U.K.
Paraoxonase is a serum protein bound to high-density lipoproteins (HDLs). The physiological function of the enzyme is unknown, but a role in lipid metabolism has been postulated. To date, studies of the protein have had to rely on measurements of enzyme activity with various substrates. We have developed a highly specific, competitive e.l.i.s.a. using a previously characterized monoclonal antibody. The assay can detect 20 ng of paraoxonase with a working range of 75-600 ng. Intra- and interassay coefficients of variation were 6.5 and 7.9 % respectively. Serum concentrations of paraoxonase in healthy subjects from Geneva and Manchester ranged from 25 to 118 4ug/ml. There were significant differences in mean concentrations between the two groups (Geneva, 79.3 + 18.7 ,ug/ml; Manchester, 59.9 + 24.1 ,ug/ml: P < 0.001), differences also apparent when
subjects were compared according to paraoxonase phenotype. These appeared to be largely a consequence of differences in apolipoprotein A-I concentrations between the two populations, suggesting that HDL particle number may be important in determining serum levels of paraoxonase. Paraoxonase specific activities were also significantly different between the two groups of subjects (Geneva, 2.08+0.96 units/mg; Manchester, 3.08 + 1.73 units/mg: P < 0.001), which may reflect differences in HDL particle composition. The e.l.i.s.a. should furnish the necessary complement to studies of paraoxonase enzymic activity and has already provided evidence for differences with respect to serum levels of the protein both between populations and between phenotypes within populations.
INTRODUCTION
probably influencing the active site of the enzyme [17,18]. To what extent the polymorphism, which is a particular feature of Europid (caucasoid) populations, is of physiological relevance is unknown, especially as this property is not exhibited with all substrates [1]. Despite the substantial data concerning its enzymic properties, correlation of enzyme activity with protein levels has not been possible. This constitutes a major drawback in clinical studies and is due, in part, to the difficulties encountered in attempts to purify the enzyme; the affinity of paraoxonase for the structural protein of HDL [apolipoprotein (apo) A-I] is probably the principal source of these difficulties. They have only recently been surmounted [19,20]. In a recent series of studies we extensively characterized the association of paraoxonase with human HDL [12]. We now report the development of an immunoassay specific for paraoxonase. The characteristics of the assay, and its application to two, apparently healthy, populations are described. The assay should provide the necessary complement to enzyme-activity measurements and allow a more complete picture of paraoxonase in different clinical and epidemiological settings.
Serum paraoxonase (aryldialkylphosphatase EC 3.1.8.1) is an intriguing protein whose clinical interest presently resides in its ability to hydrolyse toxic organophosphorus anti-cholinesterase nerve gases and insecticides [1]. Studies stretching back over four decades have provided a wealth of information about its enzymic properties with respect to exogenous substrates. Attempts to identify natural endogenous substrate(s) have so far been unsuccessful [1]. One area which has attracted attention is a potential role in blood lipid metabolism [1-3]. Several reports have alluded to this possibility, with indications of reduced paraoxonase activity in subjects with decreased high-density lipoprotein (HDL) [4,5], correlations between enzyme activity and plasma lipid levels [6] and modified paraoxonase activity in familial hypercholesterolaemia, insulin-dependent diabetes and in myocardialinfarction survivors [7-9]. However, it would be premature, on the basis of currently available evidence, to conclude that the function of the protein is lipid-oriented. Likewise, the highly interesting proposal that the enzyme may detoxify chemically modified and potentially atherogenic lipids [10] requires confirmation. Nevertheless, speculation on a role in lipid metabolism is warranted and requires exploration, given the tight association of paraoxonase with one of the principal plasma lipid-transport vectors, high-density lipoproteins (HDLs) [12,13]. Paraoxonase displays substrate-dependent polymorphism with low- (type A) and high- (type B) activity phenotypes [1,14,15]. High salt concentrations preferentially augment the activity of the B isoform, providing the means of phenotyping sera [16]. The structural basis for this polymorphism would appear to involve amino acid substitutions at position 191 of the peptide sequence,
MATERIALS AND METHODS Study populations Participants (all Europids) in this study were recruited in Geneva and Manchester. In Geneva, serum samples were obtained from apparently healthy blood donors who were not all fasting. In Manchester, serum was obtained after a 12 h fast from healthy subjects who were recruited from the staff of the Manchester Royal Infirmary (n 33) and people attending for routine health =
Abbreviations used: HDL, high-density lipoprotein; apo, apolipoprotein; mAb, monoclonal antibody; 1D (2D), one(two)-dimensional; RAMIG, rabbit anti-mouse IgG. * To whom correspondence should be addressed.
550
M.-C. Blatter Garin and others
screening at a local general practice (n = 49). Subjects with familial hypercholesterolaemia, diabetes mellitus, liver and renal disease were excluded, as were those taking medication. Serum samples were frozen and transported on solid CO2 between the two centres. All e.l.i.s.a.s were performed in Geneva, and all enzymic activities were determined in Manchester.
Preparation of monoclonal antibodies The monoclonal antibody (mAb) F41F2-K specific for paraoxonase was identified and characterized as described previously [12]. For studies reported herein, the antibody was purified from conditioned medium by Protein A-Sepharose affinity chromatography according to the manufacturer's (Pharmacia, Uppsala, Sweden) instructions. Purified mAb was stored at -70 °C in PBS [sodium phosphate buffer (10 mM) (pH 7.4)/NaCl (140 mM)/KCl (2.7 mM)/sodium azide (0.02 %)].
relative to the hydrolysis of phenyl acetate, as described in [15], except that all incubations were performed at 22 'C.
SOS/PAGE/Western blotting Known volumes of a pooled serum sample or quantities of purified paraoxonase were subjected to SDS/PAGE on ID slab gels [12,25]. After electrophoresis, the protein profiles were electrotransferred to nitrocellulose sheets and further analysed by immunoblotting [26]. Briefly, the sheets were incubated with mAb F41F2-K then with l25l-labelled rabbit anti-mouse IgG (RAMIG) and subsequently exposed to photographic film (16 h, -70 °C). Resulting autoradiograms were scanned with a Molecular Dynamics densitometer, and the intensities of bands corresponding to paraoxonase were quantified with the ImageQuant software package. A calibration curve was constructed from the staining intensities of purified paraoxonase samples and used to quantify paraoxonase in the reference pool.
Lipoprotein fractionation
E.l.i.s.a. for paraoxonase
Human and rat sera were obtained by centrifuging clotted blood samples for 30 min at 3000 g (4 °C). Samples were either stored at 4 °C, or frozen at -70 'C. HDL was isolated by sequential ultracentrifugation [21], dialysed against PBS and stored at -20 °C.
On the basis of the use of monoclonal antibody F41F2-K, a competitive e.l.i.s.a. was developed to quantify human paraoxonase. Microtitre plate wells were coated with rat HDL [density (p) 1.063-1.21 g/ml; 10 mg/l; 100 ,ul in 50 mM carbonate/ bicarbonate buffer, pH 9.6] overnight at room temperature. The wells were emptied by inverting the microtitre plates, and the remaining absorption sites were blocked with BSA (200 ,ul; 1 % in the same buffer; 1 h at 37 °C). After washing (PBS/BSA, 0.1 0% w/v) aliquots (100 1a1) of a calibrated human serum pool (0.02-2.3 mg/l) or test sera (diluted 1: 250 or 1: 500) were added to the wells together with an equivalent volume of antiparaoxonase (final concn. 0.11 mg/l) and incubated for 3 h at 37 'C. The wells were then washed, incubated with alkaline phosphatase-labelled RAMIG (Sigma) (100 ,1 of a 1:500 dilution, 2h, 37 °C) and washed a third time. The enzyme substrate, p-nitrophenyl phosphate [50 ,ul in diethanolamine (10 %, w/v), pH 9.8, containing 0.05 mM MgCl2and 0.02 % NaN3] was subsequently added to the wells and the AA405 was monitored for 10 min using a Molecular Dynamics microplate reader in kinetic mode. Results were expressed as AA/min and those for the standard curve fitted with a four-parameter equation.
Assays of lipids and apos In Geneva samples, serum cholesterol, triacylglycerols and HDL cholesterol were quantified enzymically as described previously [22]. Apos A-I and B were assayed by immunoelectrophoresis [23] and apo A-1I by radial immunodiffusion (Immuno AG, Vienna, Austria). Total protein was measured by the Lowry procedure [24]. In Manchester, serum lipids were also measured enzymically [7], with HDL cholesterol being quantified after precipitation of lower-density lipoproteins with heparin/Mn2+. Apo B was analysed by rate immunonephelometry [7]. Apo A-I concentrations in the Manchester subjects were measured in frozen serum samples, which were transported to Geneva.
Isolation of paraoxonase Human serum paraoxonase was purified by a modification of the procedure of Gan et al. [19]. Briefly, a partially purified fraction was obtained by affinity chromatography on Cibracron Blueagarose followed by two ion-exchange-chromatography cycles on Whatman DE-52. To remove remaining traces of apo A-I and albumin, pooled fractions were subjected to one-dimensional (ID) SDS/PAGE [25]. After electrophoresis, strips were cut from either side of the gel, rapidly stained with Coomassie Blue, then re-aligned with the gel in order to localize the paraoxonase band in the non-stained gel. The band was excised, transferred to dialysis tubing containing 3 ml of buffer (25 mM Tris/192 mM glycine/0. I % SDS) and electroeluted (20 mA for 4 h in a Shandon 600 mm x 100 mm chamber). The electroeluted samples were checked for purity by SDS/PAGE and stored at -20 'C. Purified paraoxonase samples were also analysed by two-dimensional (2D) PAGE as described in [26]. 2D-PAGE gels were either silver-stained to reveal the protein pattern or the protein profiles electrotransferred to nitrocellulose sheets for analysis by Western blotting (see bekow).
Paraoxonase enzyme activity Basal paraoxonase activity was determined by the method of Mackness et al. [7]. Serum samples were phenotyped by determining the hydrolysis of paraoxon in the presence of 1 M NaCl
Statistical analyses The Student's non-paired t test was used for comparisons of population differences in protein concentrations measured by e.l.i.s.a. and enzyme activities determined with phenyl acetate as substrate. Owing to the activity polymorphism with paraoxon as substrate, comparisons of population differences in this case were effected with the Mann-Whitney non-parametric test.
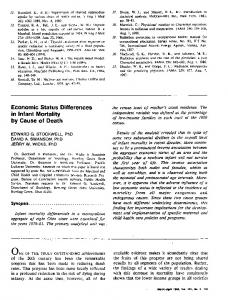
RESULTS E.l.i.s.a. for paraoxonase The purity of the paraoxonase preparation is demonstrated by the high-resolution 2D-PAGE profile given in Figure l(a). The principal protein bands were visible at the expected molecular mass for the protein (45 kDa), together with minor bands (molecular mass < 25 kDa), which probably represent degradation products. The bands revealed by silver staining were recognized by mAb F41F2-K (Figure Ib). Purified paraoxonase was used to quantify the enzyme in a pool of human sera obtained from healthy, normolipaemic (triacylglycerols < 2.0 mM, cholesterol < 5.5 mM) men and women (n = 5), as illustrated in Figure l(b). The calibration curves were obtained by scanning the gels in the regions corresponding to the molecular
551
Quantification of human serum paraoxonase Table 1 Characteristics of Geneva and Manchester subjects
(a)
Imm u noblot
Silver-stained 2D PAGE
M (kDa)
Values are means+ S.D. or geometric means with 95% confidence intervals. Lipid values are in mmol/l and apolipoproteins in g/l. Statistical comparisons were made by Student's nonpaired t test (triacylglycerols were converted into logarithmic values). *P < 0.0001; **P < 0.005 versus Geneva subjects. Abbreviations: ND, not determined; BMI, body mass index
66 -*
A
(weight/height2).
...
45 -*
A
Value
25 -O
.1I
Parameter n
E E c
(b)
15
L
C:
IX o
30 0 Amount of paraoxonase
60
(ngi
0.8
0
(Sly)
Age (years) BMI (kg/mi2) Cholesterol Triacylglycerols HDL cholesterol Apo A-I Apo A-Il Apo B
Ib
10
Subjects ...
Geneva
Manchester
98 (68/30) 45.8 +12.8 24.0 + 3.6 5.96 + 0.99 1.59 (1.40-1.80) 1.34 + 0.36 1.25 + 0.17 0.54 + 0.08 1.20 + 0.42
82 (24/58) 40.8 + 12.3 24.0 + 3.4 5.68 + 1.30 1.03 (0.91-1.16)* 1.51 + 0.41 ** 0.92 + 0.25* ND 0.91 + 0.26*
1.6
Volume of serum
(p) Table 2 Paraoxonase protein concentrations in Geneva and Manchester subjects
Figure 1 SOS/PAGE and immunoblot analyses of
serum
and purffled
Mean values+S.D. are given. Statistical comparisons were made by Student's non-paired t test. *P < 0.0001; **P < 0.002; ***P = 0.05 versus the corresponding category in the Geneva group. tP < 0.05 versus AA for comparisons within the Manchester group.
paraoxonase
(a) Purified paraoxonase (1.0 ,ug) was subjected to 2D PAGE and the gels either silver-stained or the peptide profile was electrotransferred to a nitrocellulose sheet. The latter was incubated with anti-paraoxonase antibody (F41 F2-K), then with 1251-labelled rabbit anti-mouse IgG. Bound antibody was revealed by exposure (-70 °C) to photographic film. M is molecular mass. (b) The indicated quantities of purified paraoxonase or human serum were analysed by 1 D SDS/PAGE and immunoblotted, after transfer to nitrocellulose sheets, with mAb F41 F2-K and 1251-labelled rabbit anti-mouse IgG. In the resulting autoradiogram, the whole area of each band was scanned and band intensity calculated as A/mm2 using the Image0uant software package. Correlation coefficients () were 0.94 (purified paraoxonase) and 0.985 (serum).
nu
E
Group Geneva Total AA AB BB Manchester Total AA AB BB
Phenotype distribution (%)
[Protein]
55 40 5
79.3 + 18.7 76.1 + 19.5 82.2 +17.6 89.0 +17.4
46 42 12
59.9 + 24.1* 53.1 + 20.1 ** 64.4 + 28.3**t 68.6+17.9* t
(,ug/ml)
.52 ' 40
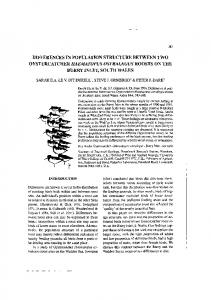
the range 75-600 ng (serum dilution of 1: 250 to 1: 500). Routinely, duplicate measurements were made for each point of the calibration curve, and quadruplicate measurements were made for test sera.
0)
0) C 0 x 0 C
O
-2.0
Concentrations of human serum paraoxonase
-1.0 0 log{[Paraoxonase protein) (,ug/ml)}
Figure 2 Calibration curve developed by competitive e.I.i.s.a. using mAb F41F2-K and a pool of human serum Results are the means of quadruplicate determinations (±S.D.). Values AA405/min, and the curve was fitted with a four-parameter equation.
were
measured as
mass of paraoxonase. The standard serum pool was subsequently used to develop a calibration curve for assaying human serum paraoxonase (Figure 2). The serum pool was found to give highly reproducible calibration curves if stored in aliquots at -70 °C. Intra- and inter-assay coefficients of variation were 6.5 and 7.9 % respectively, and paraoxonase could be assayed with precision in
The demographic details of the Geneva and Manchester populations are given in Table 1. Although not all Geneva subjects were fasting, there was no indication of differences in paraoxonase protein concentrations between postprandial and postabsorptive sera, as previously observed for analyses of enzyme activity. There were differences between the two groups with respect to several lipid and apo parameters, notably apo A-I, which was lower in the Manchester subjects, although within the reference range for this population (70-153 mg/dl). This reflects, to a certain extent, differences in the composition of the two groups. The phenotypic distributions of paraoxonase determined from enzyme activities were similar in both groups, corresponding to that normally found in Europid populations. Mean serum concentrations of paraoxonase are given in Table 2. Protein levels were significantly higher in the Geneva
M.-C. Blatter Garin and others
552
Subjects.... .Geneva
Manchester
-6
I
(a) a
a A
,x, 3 co
A
(d)I 1A A0 I
%
O
0
.I
0
O
0 x 0
OA '
-
B.-. (b)
0.
a,
0
0 Cu Cu
v,
-.
0
A
A (b 0 A 8k
0
Xn
0
13
A
A0A
. . ---
.
-.
-
d3
A
%3
04
0
.
0 000
0
-I
A
00
A
0
0
A90 A
0 ~
50
~
~
90
110
30 [Protein] (,g/ml)
Figure 3 Basal and salt-stimulated (1 M NaCI) serum paraoxonase activities populations Symbols:
0,
AA phenotype; El, AB phenotype;
A,
a
.
000A*?
tb
hA
,,(_j
~
70
.
0
0
30
o
(f)
a-C
.0
A
cPpA 0o0 O%A% A
. .t .
U,
EE
-
(c)
aC
0l
A
ofiP8eb°~~~~~~~~~~~~~~~~#
0~
I A
Danaw*Olev°ow
Cu
0
(e)
03a
a
Ea
° I~~~~~~ °S-
A
(.9
0
0
0
'A
a0 go a
0
4co0Q7
E 4
0
013
o
it
u
0 A
~
03
A
3
130
vFz °
as a function of
50
70
90
110
:~~~~~~~~~~~~~
log [paraoxonase protein] in the Geneva and Manchester
BB phenotype.
subjects, whether considering the whole group or individual phenotypes. However, when analysed by analysis of co-variance ('ANCOVA'), correcting for population differences in apo A-I, mean serum concentrations of paraoxonase were no longer significantly different between Geneva and Manchester subjects (e.g. total population: Geneva, 73.8+22.9#4g/ml; Manchester 70.5 + 21.1 ,ug/ml; P0.083). Within the two populations there was a tendency for protein levels to rise when passing from AA to AB to BB phenotypes, although this was only significant for the Manchester group. This was not due to differences in apo A-I concentrations between the phenotypes. Enzyme activities for hydrolysis of paraoxon [basal activity (geometric mean with 95 % confidence intervals)] in Geneva and Manchester subjects were 144.3 (129.8-160.5) units/ml and 142.9 (122.9-164.1) units/ml respectively. Corresponding values for phenyl acetate hydrolysis (mean + S.D.) were 96.3 + 26.7 units/ml and 55.4+41.9 units/ml (P < 0.0001).
Correlations between protein levels and enzyme activities Highly significant, positive correlations were observed between protein levels assayed by e.l.i.s.a. and measurements of enzyme
activity using paraoxon or phenyl acetate as substrates. This is illustrated for both the Geneva and Manchester groups in Figures 3(a)-3(f). Individual phenotypes also exhibited strong positive correlations between these parameters. Indeed, correlation coefficients tended to be higher for individual phenotypes when considering paraoxon as substrate, owing to intrinsic differences in enzyme activities between phenotypes [e.g. combined Geneva and Manchester groups: all phenotypes (n = 180), r = 0.66 (P < 0.0001); AA (n = 92), r = 0.80 (P < 0.0001); AB (n = 72), r = 0.87 (P < 0.0001); BB (n = 16), r = 0.65 (P < 0.005)] for correlations between protein levels and salt-stimulated paraoxon hydrolysis.
Correlations between paraoxonase protein levels and plasma
lipids/apos Several studies have reported significant correlations between paraoxonase, expressed as enzyme activity, and various serum lipids and apos [1,6]. When correlations were examined with respect to paraoxonase protein levels, qualitatively similar results
observed for the Geneva and Manchester groups (Table 3). Thus significant, positive correlations were observed with HDL
were
Quantification of human serum paraoxonase Table 3 CorrelatIons between paraoxonase protein and apos
mass
and serum lipids
Correlations were determined with the Pearson correlation coefficient. Triacylglycerols converted into logarithmic values before analysis. *P K 0.05; **P < 0.001.
were
Correlation coefficient (D
Subjects ... Geneva
Parameter
Triacylglycerols
-0.18 0.10 -0.05 0.30* 0.36** 0.34**
Cholesterol Apo B HDL cholesterol
Apo A-I Apo A-l1
120r *
-0.18 0.04 -0.02 0.43** 0.37** -
Control +5 mM EGTA
80' 0
Ct
0
40
0
2
1 lime
EGTA sera were respectively 55.9 + 7.7% and 45.9 + 4.5% of the values in corresponding non-treated samples. Samples treated for 3 days were also examined by SDS/PAGE and Western blotting using F41F2-K. Densitometric scanning of the autoradiograms (results not shown) revealed no significant differences in the intensity of signals corresponding to the paraoxonase bands in either EDTA/EGTA-free or treated sera.
Manchester
+5 mM EDTA
0
553
3
(days)
Figure 4 Serum concentrations of paraoxonase measured In the presence absence of EDTA or EGTA (5 mM)
or
Paraoxonase protein levels were quantified by e.l.i.s.a. in freshly obtained human sera and on consecutive days (storage at 4 OC). Results (mean +S.D., n = 4) are expressed as the percentage of protein concentrations observed in the untreated sera at day 1.
cholesterol, and the principal protein components of HDL, apos A-I and A-II (the latter being measured only in the Geneva population). Conversely, the correlations observed with the three other principal cardiovascular lipid risk factors, namely total cholesterol, triacylglycerols and apo B, were not significant (Table 3). It mirrors the absence of significant correlations between these risk factors and paraoxonase enzyme activity.
Influence of EDTA/EGTA on paraoxonase analysis by e.i.i.s.a. Chelation of calcium is known to inhibit paraoxonase activity, probably attributable to attendant conformational changes. To examine whether removal of calcium also influenced e.l.i.s.a. quantification of paraoxonase, sera obtained from four fasting subjects were divided into aliquots and EDTA or EGTA (5 mM final concn.) added to an aliquot from each subject. An untreated aliquot served as control. Paraoxonase concentrations were quantified daily for 3 days, the sera being stored at 4 'C. Slight reductions in the levels of the protein were apparent in both treated samples when assayed immediately. Whilst there was no loss of paraoxonase protein in EDTA/EGTA-free sera over the next 3 days, there appeared to be a decrease in treated sera (Figure 4): mean paraoxonase concentrations in EDTA and
DISCUSSION The e.l.i.s.a. described herein furnishes a rapid, sensitive, specific and highly reproducible means of quantifying human serum paraoxonase. It represents an important addition to the techniques available for investigating the protein and provides the necessary complement to enzyme activity measurements. Mean serum concentrations of paraoxonase determined in two centres (79.3 + 18.7 and 59.9 + 24.1 -mg/l respectively) are of the same order of magnitude as previous, indirect estimations [19]. One of the principal problems encountered in developing the e.l.i.s.a. was the source of antigen for coating the microtitre plate wells. Isolated paraoxonase can be unstable. Indeed, our attempts to use the purified protein in the e.l.i.s.a. setting were unsuccessful, as there was a rapid loss of immunoreactivity towards the monoclonal antibody. This is a problem which often plagues immunochemical studies of apos, where their removal from the hydrophobic environment of the lipoprotein particle can modify their conformational and antigenic properties [27]. Human HDL isolated by ultracentrifugation also proved unsuitable, since the paraoxonase content was too low, probably on account of its desorption during ultracentrifugation, a phenomenon well known for apo components of lipoproteins [28,29]. However, we observed strong cross-reaction of the monoclonal antibody with rat paraoxonase, which appeared to be less readily desorbed from rat HDL during ultracentrifugation (M. C. Blatter Garin and R. W. James, unpublished work). Thus, rat HDL was adopted as the coating antigen, providing an easily available, rapidly obtainable, bulk source of paraoxonase which could also be stored frozen at -20 'C for several months without apparent modification of antigenic or enzymic reactivity. A calibration curve was developed with a reference human serum pool calibrated with purified paraoxonase. This was rendered possible by complete denaturation of the protein during SDS/PAGE. Presumably, such treatment eliminated any differences in reactivity towards F41 F2-K of purified or serum forms of paraoxonase (Figure 2). Paraoxonase protein levels were significantly different between the two groups of subjects (Table 2). The differences were eliminated by correction for apo A-I levels, but not by correction for HDL cholesterol, suggesting that apo A-I may be a determinant of plasma concentrations of the enzyme. However, these observations presently need to be interpreted with a certain degree of caution, given the differences between the two populations. Another point of interest is that phenyl acetate-hydrolytic activity differed between the two groups, whereas basal paraoxon hydrolysis did not. The reasons for these differences are unclear, but may reflect an influence of the lipoprotein microenvironment on enzyme activity. Such an influence may be particularly marked for hydrophobic (paraoxon) as opposed to hydrophilic (phenyl acetate) substrates. Studies are underway to examine this possibility. Within both groups of subjects there was a tendency for the mean serum concentration of paraoxonase to increase when going from the low- to the high-enzyme-activity phenotypes. This trend warrants further study, as it may reflect an increased stability or modified HDL association of the B isoform, possibly
554
M.-C. Blatter Garin and others
related to the recently described sequence differences [17,18,30]. In this respect, recent studies of another HDL-associated apo, apo E, are of interest, as they demonstrate that point mutations giving rise to two isoforms also modulate the capacity of these isoforms to bind to different lipoprotein subfractions, with important pathophysiological consequences [31]. The highly significant, positive correlations observed between protein levels measured by e.l.i.s.a. and enzyme activities, whether using paraoxon or phenyl acetate as substrates, are illustrative of the specificity of our assay. In addition, the correlation coefficients are similar for all three phenotypes, which is consistent with our belief that the mAb does not differentiate between the A and B isoforms. In contrast, the results with EDTA and EGTA are quite intriguing. There was a loss of paraoxonase when quantified by e.l.i.s.a. in the presence of these calcium chelators. However, this loss could not be confirmed when the protein was quantified under denaturing conditions. We suggest that the apparent loss of protein in the presence of EDTA/EGTA is due to conformational changes that diminish the binding of the mAb. It is tempting to speculate that these correspond to conformational changes thought to underlie inhibition of enzyme activity in the presence of EDTA/EGTA, although the latter occurs much more rapidly. Further investigations should study whether the observation represents a generalized conformational modification of paraoxonase in the presence of EDTA/EGTA or more limited changes which specifically influence the epitope recognized by F41F2-K. Finally, we examined whether previously reported correlations between paraoxonase enzyme activity and serum lipids and apos [6] also applied to paraoxonase protein levels. As shown in Table 3, our results correspond to those previously reported, notably significant correlations with various HDL components. That the coefficients are low is to be expected, given that HDL is composed of numerous subpopulations [32,33] and paraoxonase appears to be associated with a minor subpopulation [12]. What is intriguing, however, is that apos A-I and A-II show similar correlations with paraoxonase protein. This has been previously reported with paraoxonase expressed as enzyme activity [34]. Both apos are structural components of HDL, but we had found paraoxonase to be preferentially associated with HDL subfractions containing apo A-I but no apo A-II [12]. Further studies are necessary to clarify this observation. In contrast with a recent report [6], we could obtain no evidence for significant correlations between paraoxonase protein and the three major pro-atherogenic lipid risk factors, cholesterol, apo B and triacylglycerols. It may be due to intrinsic differences in paraoxonase polymorphism between the non-Europid populations, which were the subject of the latter study, and Europid populations, the subject of this study. In conclusion, we have developed a highly specific and reproducible assay for human paraoxonase. It should prove particularly useful in attempts to define the clinical importance of the enzyme. Several important questions can now be addressed, among which is the potential influence of the association of paraoxonase with its blood transport vehicle, HDL, on the stability and the activity of the enzyme. This is of particular relevance given the highly dynamic nature of this lipoprotein Received 14 January 1994/5 July 1994; accepted 11 July 1994
species, where extensive compositional and distributional modifications can occur over a 24 h period. This study was supported by grants from the Swiss National Research Foundation (no. 32-30782.91), the Roche Research Foundation (to R.W.J.), the Medical Research Council (U.K.), and the North Western Regional Health Authority (U.K.).
REFERENCES
30
La Du, B. N. (1992) in Pharmacogenetics of Drug Metabolism (Kalow, W., ed.), pp. 51-91, Pergamon Press, New York La Du, B. N. (1988) Am. J. Hum. Genet. 43, 227-229 Mackness, M. I. (1989) Biochem. Pharmacol. 38, 385-390 Mackness, M. I., Peuchant, E., Dumon, M.-F., Walker, C. H. and Clerc, M. (1989) Clin. Biochem. 22, 475-478 Mackness, M. I., Walker, C. H. and Carlson, L. A. (1987) Clin. Chem. 33, 587-588 Saha, N., Roy, A. C., Teo, S. H., Tay, J. S. H. and Ratnam, S. S. (1991) Clin. Genet. 40, 277-282 Mackness, M. I., Harty, D., Bhatnagar, D., Winocour, P. H., Arrol, S., Ishola, M. and Durrington, P. N. (1991) Atherosclerosis 86, 193-199 McElveen, J., Mackness, M. I., Colley, C. M., Peard, T., Warner, S. and Walker, C. H. (1986) Clin. Chem. 32, 671-673 Szab6, I., R6na, K., Czinner A., Gachalyi, B. and Kaldor, A. (1987) Clin. Chem. 33, 742-743 Mackness, M. I., Arrol, S. and Durrington, P. N. (1991) FEBS Lett. 286, 152-154 Mackness, M. I., Abbott, C. A. and Durrington, P. N. (1993) Atherosclerosis 104, 129-135 Blatter, M.-C., James, R. W., Messmer, S., Barja, F. and Pometta, D. (1993) Eur. J. Biochem. 211, 871-879 Mackness M. I., Hallam, S. D., Peard, T., Warner, S. and Walker, C. H. (1985) Comp. Biochem. Physiol. 825, 675-677 Krisch, K. (1968) Z. Klin. Chem. Klin. Biochem. 6, 41-45 Eckerson, H. W., Romson, J., Wyte, C. and La Du, B. N. (1983) Am. J. Hum. Genet. 35, 214-227 Eckerson, H. W., Wyte, C. M. and La Du, B. N. (1983) Am. J. Hum. Genet. 35, 1126-1138 Humbert, R., Adler, D. A., Disteche, C. M., Hassett, C., Omiecinski, C. J. and Furlong, C. E. (1993) Nature Genet. 3, 73-76 Adkins, S., Gan, K. N., Mody, M. and La Du, B. N. (1993) Am. J. Hum. Genet. 52, 598-608 Gan, K. N., Smolen, A., Eckerson, H. W. and La Du, B. N. (1991) Drug Metab. Dispos. 19, 100-106 Furlong, C. E., Richter, R. J., Chapline, C. and Crabb, J. W. (1991) Biochemistry 30, 10133-10140 James, R. W. and Pometta, D. (1990) Atherosclerosis 83, 35-45 James, R. W. and Pometta, D. (1991) Diabetologia.34, 246-252 James, R. W. and Pometta, D. (1990) Diabetes 39, 1158-1164 Lowry, 0. H., Rosebrough, N. J., Farr, A. L. and Randall, P. J. (1951) J. Biol. Chem. 193, 265-275 Laemmli, Lt. K. (1970) Nature (London}.227, 680-685 James, R. W., Hochstrasser, D., Tissot, J.-D., Funk, M., Appel, R., Barja, F., Pellegrini, C., Muller, A. F. and Pometta, D. (1988) J. Lipid Res. 29,1557-1571 Steinberg, K. K., Cooper, G. R., Graiser, S. R. and Rosseneu, M. (1983) Clin. Chem. 29, 415-426 Kunitake, S. T. and Kane, J. P. (1982) J. Lipid Res. 23, 936-940 Bisgaier, C. L., Sachdev, 0. P., Megna, L. and Glickman, R. M. (1985) J. Lipid Res. 26, 11-25 La Du, B. N., Adkins, S., Kuo, C.-L. and Lipsig, D. (1993) Chem.-Biol. Interact. 87,
31
25-34 Steinmetz, A., Jakobs, C., Motzny, S. and Kaffarnik, H. (1989) Arteriosclerosis 9,
1 2 3 4
5 6 7
8 9
10 11 12
13 14 15 16 17 18 19 20 21 22 23 24
25 26 27 28 29
405-411 32 Alaupovic, P. (1984) in Clinical and Metabolic Aspects of High-Density Lipoproteins (Miller, N. E. and Miller, G. J., eds.), vol. 3, pp. 1-45, Elsevier, Amsterdam 33 Cheung, M. C. and Albers, J. J. (1984f S. Biol. Chemr ,259, 12201-12209 34 Boman, H. (1980) Acta Genet. Med. Gemellol. 29, 281-287