Biogeosciences Discuss., doi:10.5194/bg-2016-491, 2016 Manuscript under review for journal Biogeosciences Published: 15 November 2016 c Author(s) 2016. CC-BY 3.0 License.
1!
Impact of annual and seasonal precipitation and air
2!
temperature on gross primary production in Mediterranean
3!
ecosystems in Europe
4! 5!
Svenja Bartsch1, Bertrand Guenet1, Christophe Boissard1, Juliette Lathiere1, Jean-
6!
Yves Peterschmitt1, Annemiek Stegehuis1, Ilja-M Reiter2, Thierry Gauquelin3,
7!
Virginie Baldy3, Catherine Fernandez3
8! 9!
1
Laboratoire des Sciences du Climat et de l’Environnement, LSCE/IPSL, CEA-
10!
CNRS-OVSQ, Université Paris-Saclay, F-91191 Gif-sur-Yvette, France.
11!
2
12!
CNRS FR3098 ECCOREV, Domaine du Petit Arbois Avenue Louis Philibert,
13!
Bâtiment du CEREGE - BP 80, 13545 Aix-en-Provence Cedex 04, France
14!
3
15!
Méditerranéen de Biodiversité et d’Ecologie marine et continental), 3 Place Victor
16!
Hugo, 13331 Marseille, France
Fédération de Recherche Ecosystèmes Continentaux et Risques Environnementaux
Aix Marseille Université, Avignon Université, CNRS, IRD, IMBE (Institut
17! 18! 19!
Corresponding author:
[email protected]
20!
!
1!
Biogeosciences Discuss., doi:10.5194/bg-2016-491, 2016 Manuscript under review for journal Biogeosciences Published: 15 November 2016 c Author(s) 2016. CC-BY 3.0 License.
21!
Abstract
22!
Mediterranean ecosystems are significant carbon sinks but are also particularly
23!
sensitive to climate change but the carbon dynamic in such ecosystem is still not fully
24!
understood. An improved understanding of the drivers of the carbon fixation by plants
25!
is needed to better predict how such ecosystems will respond to climate change. Here,
26!
for the first time, a large dataset collected through the FLUXNET network is used to
27!
estimate how the gross primary production (GPP) of different Mediterranean
28!
ecosystems was affected by air temperature and precipitation between the years 1996
29!
and 2013. We showed that annual precipitation was not a significant driver of annual
30!
GPP. Our results also indicated that seasonal variations of air temperature
31!
significantly affected seasonal variations of GPP but without major impact on inter
32!
annual variations. Inter-annual variations of GPP seemed largely controlled by the
33!
precipitation during early spring (March-April), making this period crucial for the
34!
future of Mediterranean ecosystems. Finally, we also observed that the sensitivity of
35!
GPP in Mediterranean ecosystems to climate drivers is not ecosystem type dependent.
36! 37!
!
2!
Biogeosciences Discuss., doi:10.5194/bg-2016-491, 2016 Manuscript under review for journal Biogeosciences Published: 15 November 2016 c Author(s) 2016. CC-BY 3.0 License.
38!
1. Introduction
39!
Mediterranean land ecosystems are of particular interest for research
40!
because their outstanding biodiversity is one of the most important after the
41!
tropical regions (Cowling et al., 1996). This remarkable diversity is due to a
42!
combination of biogeographical and environmental factors (soil types,
43!
precipitation, temperature) but also the presence of human activities for millennia
44!
(Lavorel et al., 1998; Rey Benayas and Scheiner, 2002). It has been hypothesized
45!
that these ecosystems could be severely affected by global climate change in the
46!
future, that includes modification of temperature and precipitation regime (Giorgi
47!
and Lionello, 2008; Polade et al., 2014). CO2 increase may also become an
48!
important driver of species distribution within these regions (Keenan et al., 2011).
49!
Mediterranean ecosystems supply numerous services to people including clean water,
50!
flood protection and carbon sinks with a comparable amount of carbon uptake as
51!
other European forests (Janssens et al., 2003). For instance, Vayreda et al., (2012) and
52!
Pereira et al., (2007) observed a net ecosystem exchange (NEE) of 1.4 Mg C ha-1 yr-1
53!
in a Spanish and Portuguese forest, and of 1.9 Mg C ha-1 yr-1 for a grassland in
54!
Portugal, while an NEE of 2.7 Mg C ha-1 yr-1 was found for forest ecosystems from
55!
the EUROFLUX network throughout Europe (Janssens et al., 2003)
56!
Over the last decade considerable effort has been made to investigate the
57!
effect of precipitation and air temperature on biomass production (Goerner et al.,
58!
2009; Valladares et al., 2008). So far however, most of this research was carried out
59!
using single site experiments (e.g. rain exclusion device (Limousin et al., 2009, 2010;
60!
Martin-Stpaul et al., 2013)), or using only a few sites with a single ecosystem type
61!
(Reichstein et al., 2002). Consequently, contrasting results are reported in the
62!
literature. For instance, Reichstein et al., (2002) observed a high sensitivity to drought
!
3!
Biogeosciences Discuss., doi:10.5194/bg-2016-491, 2016 Manuscript under review for journal Biogeosciences Published: 15 November 2016 c Author(s) 2016. CC-BY 3.0 License.
63!
for three Mediterranean evergreen forests (two dominated by Quercus Ilex and one by
64!
Juniperus phoenicea) whereas Grünzweig et al., (2008) reported that another!
65!
Mediterannean!species!(Quercus calliprinos) was well adapted to drought. Sabaté et
66!
al., (2002) pointed out that Mediterranean oak forests (Quercus Ilex) were particularly
67!
sensitive to summer drought whereas Allard et al., (2008) observed an absence of
68!
response to summer drought for another Mediterranean oak forest composed also by
69!
Quercus Ilex. Moreover, Maselli, (2004) suggests that spring precipitation is the most
70!
important factor controlling inter-annual variations of vegetation stress. To allow
71!
broader conclusions, satellite monitoring on normalized difference vegetation index
72!
has been performed (Maselli et al., 2014). However, the link between a vegetation
73!
index and gross primary production (GPP) is not straightforward and there is a
74!
substantial spread between different satellite products (Garrigues et al., 2008).
75!
Up to now, we are not aware of any other study that has investigated the
76!
impact of annual and seasonal precipitation and air temperature on the primary
77!
production of Mediterranean ecosystems using a large collection of sites, under
78!
different climatic conditions and different vegetation types. Model projections yet
79!
indicate that the Mediterranean region will be strongly affected by future climate
80!
change (Giorgi and Lionello, 2008; Guiot and Cramer, 2016; Polade et al., 2014). Our
81!
approach might therefore be of great importance, providing general regional
82!
information for modeling exercises, and enabling to improve future biomass
83!
projections on a regional scale. A decrease in precipitation and an increase in
84!
temperature, both associated with large spatial variability, are expected for the next
85!
decades (Dubrovsky et al., 2014). This makes the Mediterranean region one of the
86!
most vulnerable regions to climate change (Nissen et al., 2014) worldwide. In this
!
4!
Biogeosciences Discuss., doi:10.5194/bg-2016-491, 2016 Manuscript under review for journal Biogeosciences Published: 15 November 2016 c Author(s) 2016. CC-BY 3.0 License.
87!
context, understanding the response of Mediterranean ecosystems to changes in
88!
temperature and precipitation is of major importance.
89!
The main goal of this study is to identify the impact of annual and seasonal
90!
precipitation (PPT) and air temperature (T) on GPP throughout the European
91!
Mediterranean region, based on a multi-sites analysis. To do so, we applied ANOVAs
92!
and linear mixed effect models to the GPP obtained from 23 different FLUXNET
93!
sites in the European Mediterranean area, representing 5 different ecosystem types.
94! 95!
2. Material and Methods
96!
2.1. Data set & data organization
97!
We used the FLUXNET database (http://www.fluxdata.org), which contains
98!
flux measurements (CO2, water, etc.) based on the eddy covariance method
99!
(Baldocchi et al., 2001) and meteorological measurements at a high temporal
100!
resolution (up to 30-min intervals). The database covers more than 500 registered
101!
sites worldwide and is partly freely available under a Fair-Use policy. All data
102!
provided by the international FLUXNET network are processed according to
103!
standardized formats and data processing protocols (Moffat et al., 2007; Papale et al.,
104!
2006; Reichstein et al., 2005).
105!
In this study we used level 4 data (L4, daily time-steps) of GPP, PPT and T
106!
from the La Thuile collection (see also http://www.fluxdata.org). We selected sites
107!
that are located within the Mediterranean region with the following vegetation types:
108!
shrubs (S), grasslands (G), deciduous broadleaf trees (DBT), evergreen needle trees
109!
(ENT) and evergreen broadleaf trees (EBT). We only focused on the European region.
110!
From the site-year files we calculated the annual mean and sum values of GPP, PPT
111!
and T. We also included the corresponding vegetation types. To be able to investigate
!
5!
Biogeosciences Discuss., doi:10.5194/bg-2016-491, 2016 Manuscript under review for journal Biogeosciences Published: 15 November 2016 c Author(s) 2016. CC-BY 3.0 License.
112!
the impact of different seasons in a rather precise way, we split the year into six parts
113!
using a bi-monthly time step (January & February (JF), March & April (MA), May &
114!
June (MJ), July & August (JA), September & October (SO), November & December
115!
(ND)) (cf. Tab. 2 subset S0-S6).
116!
We only considered the site-year files where at least 90% of the needed data
117!
per year or bi-monthly time step were available. This selection process resulted in 23
118!
sites in three different countries (France, Italy, Spain) as presented in table 1.
119! 120!
2.2. Statistical methods
121!
The statistical analyses were performed using RStudio (version 0.99.473,
122!
2009-2015 RStudio). The impact of annual and seasonal PPT, T and the vegetation
123!
type on annual and seasonal GPP was investigated by employing a linear mixed effect
124!
model ANOVA. The sites were used as random effect, which enabled us to take
125!
potential site-dependency effects into account. Because of non-normality, data were
126!
rank-transformed before analysis, as previously done by e.g. Guenet et al. (2014).
127!
We tested seven different subsets (Tab. 2, S0-S6). We first investigated if the
128!
annual mean PPT, T and/or vegetation type significantly affected the annual mean
129!
GPP (Tab. 2, S0, case A). Then, we analyzed the annual GPP using bi-monthly mean
130!
instead of annual mean PPT and T values (Tab. 2, S1-S6, case A). Note that we
131!
investigated the impact of PPT and T on the average annual GPP of the subsequent
132!
year rather than on the actual year for the ND subset, because in this time of the year
133!
the actual climatic factors hardly control the total growing strength of the actual year
134!
(Tab. 2). In a next step all tests were repeated using the total annual and bi-monthly
135!
sum, instead of mean values for GPP and PPT (Tab. 2, S0-S6, case B). As we applied
136!
several hypotheses on one single data set, we faced the problem of multiple
!
6!
Biogeosciences Discuss., doi:10.5194/bg-2016-491, 2016 Manuscript under review for journal Biogeosciences Published: 15 November 2016 c Author(s) 2016. CC-BY 3.0 License.
137!
comparisons minimizing the probability of receiving a Type I error. Accordingly, we
138!
corrected the original significance level (p = 0.05) by applying the Holm-Bonferroni
139!
method (Holm, 1979). In a last step, we investigated if the PPT and T of specific
140!
seasons (bi-monthly time periods) significantly affected the GPP of the corresponding
141!
seasons (Tab. 2, S1-S6, case C). In the latter case, applying the Holm-Bonferroni
142!
method was not necessary as we used an independent data set for every season and
143!
subset.
144!
To interactively explore which predictors provided a good fit, we applied a
145!
stepwise regression in all cases, which conducts an automatic stepwise model
146!
selection by the AIC (Akaike information criterion).
147! 148!
3. Results
149!
3.1. Inter-annual GPP variability
150!
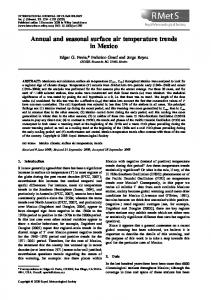
Over the selected sites, the vegetation faced a typical Mediterranean climate,
151!
with usually hot and dry summers as well as mostly mild and moist winters (Fig. 1). T
152!
ranged from -0.1 to 28.4°C (Fig. 1C, bi-monthly averages) and the seasonal PPT from
153!
0 to 11.4 mm d-1 (Fig. 1D, bi-monthly averages). GPP values for shrubs were lowest
154!
but show the highest variability across the different sites (Fig. 1A). For trees (ENT,
155!
DBT, EBT) the GPP values were rather similar to each other. For grassland only two
156!
suitable sites were available (Tab. 1, Fig. 1A).
157!
Surprisingly no significant correlation was found between annual GPP and
158!
annual T or annual PPT across sites and years. A general trend over the vegetation
159!
types was observed but this was not significant according to the Holm-Bonferroni
160!
corrected threshold (Tab. 3). Furthermore, the relationships between the applied
161!
climatic factors and vegetation types were never found to be significant (Tab. 3). We
!
7!
Biogeosciences Discuss., doi:10.5194/bg-2016-491, 2016 Manuscript under review for journal Biogeosciences Published: 15 November 2016 c Author(s) 2016. CC-BY 3.0 License.
162!
did not obtain a clearly relationship between annual and seasonal PPT and annual
163!
GPP, or between annual and seasonal T and annual GPP by simply applying linear
164!
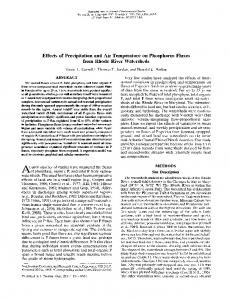
regression models (Fig. 2-5). Nevertheless, annual GPP averages could be explained
165!
(significant p-values) by both precipitation during early spring (MA) and air
166!
temperature during early winter (ND), when using bi-monthly averages or the sum as
167!
explaining variables in the linear mixed effect model (Tab. 3, Fig. 2 & 4).
168!
Furthermore, we found that the annual GPP was not significantly affected by climate
169!
conditions in summer (MJ & JA), even though this time period is the hottest and the
170!
driest for all sites (Fig. 1). Finally, we noticed that none of the interactions between
171!
the explaining variables, vegetation type, T (bi-monthly & annual) and PPT (bi-
172!
monthly & annual), significantly impacted the annual average of GPP (Tab. 3).
173! 174!
3.2. Intra-annual GPP variability
175!
We observed that GPP was low at the beginning of the year (JF) and increased
176!
till MJ (highest median value 6.8 gC m-2 d-1), when looking at the bi-monthly
177!
distribution of GPP (Fig. 1B). During the summer GPP slowly decreased until the
178!
lowest median value in ND (2.2 gC m-2 d-1). The highest variability in GPP was
179!
observed in JA and dominated by broadleaf trees.
180!
During all time periods the bi-monthly average T significantly affected the bi-
181!
monthly average GPP (Tab. 3). In general we observed a positive relationship
182!
between seasonal T and seasonal GPP. The only exception occurred in JA, when the
183!
increasing air temperature caused a decrease in GPP. From May to August the bi-
184!
monthly average GPP was additionally significantly affected by the bi-monthly
185!
average of PPT. Finally, as observed for the inter-annual variations of GPP, none of
!
8!
Biogeosciences Discuss., doi:10.5194/bg-2016-491, 2016 Manuscript under review for journal Biogeosciences Published: 15 November 2016 c Author(s) 2016. CC-BY 3.0 License.
186!
the interactions between the seasonal PPT, seasonal T and vegetation types was
187!
significantly correlated to the bi-monthly average of GPP.
188! 189!
4. Discussion
190!
Interestingly, neither the annual T nor the annual PPT was found to be a major
191!
control on annual biomass production in the Mediterranean region. This underlines
192!
the importance of applying seasonal (or intra-annual) approaches rather than mere
193!
inter-annual studies when investigating potential effects on biomass production within
194!
the Mediterranean region. This result is in contradiction with Jongen et al., (2011)
195!
who observed a positive correlation between annual precipitation and GPP for a
196!
Portuguese grassland. However, we only had data for two grassland sites, hence the
197!
observed trends were largely controlled by forests and shrublands. Our results are
198!
however in accordance with Allard et al. (2008) who observed that the seasonal
199!
averages of precipitation, more than the annual average, were important drivers for
200!
GPP.
201!
The rainfall during the early spring months (MA) had an important impact on
202!
annual GPP. PPT over the other time periods however, did not significantly affect
203!
annual GPP. During MA, when the growing season starts, the rainfall (Fig. 1D) is
204!
high enough to support vegetation growth, whereas the air temperature is not yet too
205!
high to reduce C fixation (Fig. 1C). Hence, early spring does not only provide good
206!
growing conditions, it can also control the soil moisture conditions before extremely
207!
dry and hot summer months (see Fig. 1B & C). The highest GPP values as well as the
208!
highest GPP variability were observed in the summer months (MJ, JA; Fig.1B). MA
209!
can thus be seen as a decisive time period in the year in controlling the annual
210!
biomass production. Allard et al., (2008) concluded that a decrease of precipitation in
!
9!
Biogeosciences Discuss., doi:10.5194/bg-2016-491, 2016 Manuscript under review for journal Biogeosciences Published: 15 November 2016 c Author(s) 2016. CC-BY 3.0 License.
211!
April-June would have a large effect on annual net ecosystem production (NEP),
212!
whereas the impact of decreasing precipitation in July-September on NEP would be
213!
minimal. Our results are also consistent with the work of Maselli (2004), who
214!
reported that normalized difference vegetation index was mainly affected by spring
215!
precipitation. These results highlight the importance of the distribution of
216!
precipitation within a year, rather than the annual precipitation sum.
217!
If climate change would affect early spring precipitation, the effect on GPP
218!
might be highly significant, whereas if precipitation would change during the other
219!
periods, the effect on GPP of Mediterranean ecosystems might be limited. Polade et
220!
al., (2014) showed that Mediterranean climate regions would face a dryer climate in
221!
the future. Using a multi-scenario and a multi-model ensemble, Goubanova & Li
222!
(2007) suggested that the precipitation over the Mediterranean region will be reduced
223!
throughout the 21st century during spring, summer and autumn. Moreover,
224!
Toggweiler & Key (2001) showed that the intensity of precipitation will mostly be
225!
reduced from February to May, using downscaling statistics. Taken together, these
226!
results indicate that the effect of climate change on the GPP of Mediterranean
227!
ecosystems might be very important, leading to a reduction of total carbon storage
228!
from those ecosystems. It furthermore suggests that the effects of climate change
229!
should be estimated using mechanistic models with a fine time resolution or with
230!
statistical models based on precipitation distribution at a seasonal time scale.
231!
Interestingly, the winter T also controls the annual GPP (Tab. 3). Lowest GPP values
232!
were associated to lower air temperatures. Most Mediterranean vegetation is well
233!
adapted to heat and water stress, but not all species might be able to survive low
234!
winter temperatures (Aranda et al., 2005; Ferrio et al., 2003; Karavatas and Manetas,
235!
1999; Larcher, 2000; Llorens et al., 2003). These can induce photoinhibition that
!
10!
Biogeosciences Discuss., doi:10.5194/bg-2016-491, 2016 Manuscript under review for journal Biogeosciences Published: 15 November 2016 c Author(s) 2016. CC-BY 3.0 License.
236!
cannot be reversed during periods with more favorable temperatures (Camarero et al.,
237!
2012; Ogaya et al., 2011). Furthermore, below-zero temperatures may induce
238!
freezing-induced embolism, which can only be partly restored (Cochard et al., 2001;
239!
Nardini et al., 2000). These factors can predispose trees to drought and heat stress that
240!
are often occurring during summer in the Mediterranean region (Peguero-Pina et al.,
241!
2011). Bansal et al., (2015), and Sohn et al., (2012) found that winter conditions are
242!
most likely more decisive for plant growth than summer aridity in some parts of the
243!
Mediterranean region. However, they may also be partly favorable for reducing
244!
summer stress, as they may influence the genetic variation in drought-resistance
245!
because traits of drought- and freezing-resistance can be co-occurring (Bansal et al.,
246!
2015; Blödner et al., 2005; Gimeno et al., 2009) However, future climate projections
247!
suggest an increase of air temperature over the Mediterranean regions (Goubanova
248!
and Li, 2007), reducing the impact of cold winter temperatures on GPP. For air
249!
temperature and precipitation it is interesting to note that interactions with vegetation
250!
types were never significant, suggesting that the observed responses are not dependent
251!
on the vegetation types.
252!
Our results also illustrate that summer PPT as well as summer T (for both MJ
253!
& JA) significantly influenced summer GPP (see Tab.3C). In particular, increasing JA
254!
T caused a decrease in GPP. Allard et al., (2008) presented the Mediterranean region
255!
as an area characterized by a long growing season that is often interrupted during late
256!
summer, when water stress is getting too high (see also Reichstein et al., (2002)). The
257!
authors suggested that under these extreme drought conditions, GPP and ecosystem
258!
respiration (Reco) are partly decoupled, most likely due to stomatal closure. Our results
259!
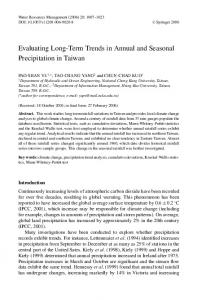
slightly support this finding. We observed a negative correlation between T and GPP
260!
during JA (Fig. 5, second line, right-side plot). Hence, if T reaches a certain threshold,
!
11!
Biogeosciences Discuss., doi:10.5194/bg-2016-491, 2016 Manuscript under review for journal Biogeosciences Published: 15 November 2016 c Author(s) 2016. CC-BY 3.0 License.
261!
GPP starts to decrease. In general, seasonal T seems to control the equivalent seasonal
262!
GPP, which indicates that seasonal T, and not the PPT as expected, generally has a
263!
major effect on seasonal GPP in the Mediterranean regions. However, the seasonal
264!
effect of T on GPP during the same season seems not to directly affect the annual
265!
GPP.
266! 267!
!
5. Conclusions
268!
In this study we investigated the response of the GPP of Mediterranean
269!
ecosystems to different climatic variables. We used the largest collection of sites over
270!
the Mediterranean region that has been considered so far. We showed that seasonal
271!
variations of T significantly impacted seasonal variations of GPP, but without a major
272!
impact on the variation of inter annual GPP. Our results suggest that variations of
273!
inter annual GPP are largely controlled by early spring precipitation, making this
274!
period crucial for the future of Mediterranean ecosystems. Interestingly, we did not
275!
observe an effect of vegetation type, indicating that the response of GPP of
276!
Mediterranean ecosystems to climate drivers is not vegetation-type dependent.
277!
Unfortunately, the studied sites were only located in Europe. To broaden our
278!
conclusions more data would be needed from other non-European parts of the
279!
Mediterranean region. Nevertheless, we showed that in the future, the reduction of
280!
spring precipitation will have a major impact on carbon storage of many different
281!
Mediterranean ecosystems.
282! 283!
!
12!
Biogeosciences Discuss., doi:10.5194/bg-2016-491, 2016 Manuscript under review for journal Biogeosciences Published: 15 November 2016 c Author(s) 2016. CC-BY 3.0 License.
284!
Acknowledgments:
285!
This work was supported by the French National Agency for Research (ANR-
286!
12-BSV7-0016-01, SECPRIME2).
287! 288!
REFERENCES
289! 290! 291! 292!
Allard, V., Ourcival, J. M., Rambal, S., Joffre, R. and Rocheteau, a: Seasonal and annual variation of carbon exchange in an evergreen Mediterranean forest in southern France, Glob. Chang. Biol., 14, 714–725, doi:10.1111/j.13652486.2008.01539.x, 2008.
293! 294! 295! 296!
Aranda, I., Castro, L., Alía, R., Pardos, J. a and Gil, L.: Low temperature during winter elicits differential responses among populations of the Mediterranean evergreen cork oak (Quercus suber)., Tree Physiol., 25(8), 1085–1090, doi:10.1093/treephys/25.8.1085, 2005.
297! 298! 299! 300! 301! 302! 303! 304! 305! 306!
Baldocchi, D., Falge, E., Gu, L. H., Olson, R., Hollinger, D., Running, S., Anthoni, P., Bernhofer, C., Davis, K., Evans, R., Fuentes, J., Goldstein, A., Katul, G., Law, B., Lee, X. H., Malhi, Y., Meyers, T., Munger, W., Oechel, W., U, K. T. P., Pilegaard, K., Schmid, H. P., Valentini, R., Verma, S., Vesala, T., Wilson, K., Wofsy, S., Paw, U. K. T., Pilegaard, K., Schmid, H. P., Valentini, R., Verma, S., Vesala, T., Wilson, K. and Wofsy, S.: FLUXNET: A New Tool to Study the Temporal and Spatial Variability of Ecosystem-Scale Carbon Dioxide, Water Vapor, and Energy Flux Densities, Bull. Am. Meteorol. Soc., 82(11), 2415–2434, doi:10.1175/15200477(2001)0822.3.CO;2, 2001.
307! 308! 309!
Bansal, S., Harrington, C. A., Gould, P. J. and St.Clair, J. B.: Climate-related genetic variation in drought-resistance of Douglas-fir (Pseudotsuga menziesii), Glob. Chang. Biol., 21(2), 947–958, doi:10.1111/gcb.12719, 2015.
310! 311! 312! 313!
Blödner, C., Skroppa, T., Johnsen, Ø. and Polle, A.: Freezing tolerance in two Norway spruce (Picea abies [L.] Karst.) progenies is physiologically correlated with drought tolerance, J. Plant Physiol., 162(5), 549–558, doi:10.1016/j.jplph.2004.09.005, 2005.
314! 315! 316! 317!
Camarero, J. J., Olano, J. M., Arroyo Alfaro, S. J., Fernández-Marín, B., Becerril, J. M. and García-Plazaola, J. I.: Photoprotection mechanisms in Quercus ilex under contrasting climatic conditions, Flora Morphol. Distrib. Funct. Ecol. Plants, 207(8), 557–564, doi:10.1016/j.flora.2012.06.003, 2012.
318! 319! 320!
Cochard, H., Lemoine, D., Améglio, T. and Granier, a: Mechanisms of xylem recovery from winter embolism in Fagus sylvatica., Tree Physiol., 21, 27–33, doi:10.1093/treephys/21.1.27, 2001.
321! 322!
Cowling, R. M., Rundel, P. W., Lamont, B. B., Arroyo, M. K. and Arianoutsou, M.: Plant diversity in mediterranean-climate regions, Trends !
13!
Biogeosciences Discuss., doi:10.5194/bg-2016-491, 2016 Manuscript under review for journal Biogeosciences Published: 15 November 2016 c Author(s) 2016. CC-BY 3.0 License.
323!
Ecol. Evol., 11(9), 362–366, doi:10.1016/0169-5347(96)10044-6, 1996.
324! 325! 326! 327!
Dubrovsky, M., Hayes, M., Duce, P., Trnka, M., Svoboda, M. and Zara, P.: Multi-GCM projections of future drought and climate variability indicators for the Mediterranean region, Reg. Environ. Chang., 14(5), 1907–1919, doi:10.1007/s10113-013-0562-z, 2014.
328! 329! 330!
Ferrio, J. P., Florit, A., Vega, A., Serrano, L. and Voltas, J.: ∆13C and tree-ring width reflect different drought responses in Quercus ilex and Pinus halepensis, Oecologia, 137(4), 512–518, doi:10.1007/s00442-003-1372-7, 2003.
331! 332! 333! 334! 335!
Garrigues, S., Lacaze, R., Baret, F., Morisette, J. T., Weiss, M., Nickeson, J. E., Fernandes, R., Plummer, S., Shabanov, N. V., Myneni, R. B., Knyazikhin, Y. and Yang, W.: Validation and intercomparison of global Leaf Area Index products derived from remote sensing data, J. Geophys. Res. Biogeosciences, 113(2), doi:10.1029/2007JG000635, 2008.
336! 337! 338! 339!
Gimeno, T. E., Pas, B., Lemos-Filho, J. P. and Valladares, F.: Plasticity and stress tolerance override local adaptation in the responses of Mediterranean holm oak seedlings to drought and cold, Tree Physiol., 29(1), 87–98, doi:10.1093/treephys/tpn007, 2009.
340! 341! 342!
Giorgi, F. and Lionello, P.: Climate change projections for the Mediterranean region, Glob. Planet. Change, 63(2–3), 90–104, doi:10.1016/j.gloplacha.2007.09.005, 2008.
343! 344! 345! 346!
Goerner, A., Reichstein, M. and Rambal, S.: Tracking seasonal drought effects on ecosystem light use efficiency with satellite-based PRI in a Mediterranean forest, Remote Sens. Environ., 113(5), 1101–1111, doi:10.1016/j.rse.2009.02.001, 2009.
347! 348! 349! 350!
Goubanova, K. and Li, L.: Extremes in temperature and precipitation around the Mediterranean basin in an ensemble of future climate scenario simulations, Glob. Planet. Change, 57(1–2), 27–42, doi:10.1016/j.gloplacha.2006.11.012, 2007.
351! 352! 353! 354!
Grünzweig, J. M., Carmel, Y., Riov, J., Sever, N., McCreary, D. D. and Flather, C. H.: Growth, resource storage, and adaptation to drought in California and eastern Mediterranean oak seedlings, Can. J. For. Res., 38(2), 331–342, doi:10.1139/X07-152, 2008.
355! 356! 357! 358!
Guenet, B., Danger, M., Harrault, L., Allard, B., Jauset-Alcala, M., Bardoux, G., Benest, D., Abbadie, L. and Lacroix, G.: Fast mineralization of land-born C in inland waters: First experimental evidences of aquatic priming effect, Hydrobiologia, 721(1), 35–44, doi:10.1007/s10750-013-1635-1, 2014.
359! 360! 361!
Guiot, J. and Cramer, W.: Climate change , the Paris Agreement thresholds and Mediterranean ecosystems, Science (80-. )., 4532(October), 4528–4532, doi:10.1126/science.aah5015, 2016.
362! 363! 364!
Hertig, E. and Jocobeit, J.: Assessments of Mediterranean precipitation changes for the 21st century using statistical downscaling techniques, Int. J. Climatol., 28, 1025–1045, doi:10.1002/joc, 2008.
!
14!
Biogeosciences Discuss., doi:10.5194/bg-2016-491, 2016 Manuscript under review for journal Biogeosciences Published: 15 November 2016 c Author(s) 2016. CC-BY 3.0 License.
365! 366! 367! 368! 369!
Janssens, I. a, Freibauer, A., Ciais, P., Smith, P., Nabuurs, G.-J., Folberth, G., Schlamadinger, B., Hutjes, R. W. a, Ceulemans, R., Schulze, E.-D., Valentini, R. and Dolman, a J.: Europe’s terrestrial biosphere absorbs 7 to 12% of European anthropogenic CO2 emissions., Science, 300(5625), 1538–42, doi:10.1126/science.1083592, 2003.
370! 371! 372! 373!
Jongen, M., Pereira, J. S., Aires, L. M. I. and Pio, C. A.: The effects of drought and timing of precipitation on the inter-annual variation in ecosystematmosphere exchange in a Mediterranean grassland, Agric. For. Meteorol., 151(5), 595–606, doi:10.1016/j.agrformet.2011.01.008, 2011.
374! 375! 376! 377!
Karavatas, S. and Manetas, Y.: Seasonal patterns of photosystem 2 photochemical efficiency in evergreen sclerophylls and drought semideciduous shrubs under Mediterranean field conditions, Photosynthetica, 36(1– 2), 41–49, doi:Doi 10.1023/A:1007010502269, 1999.
378! 379! 380! 381!
Keenan, T., Maria Serra, J., Lloret, F., Ninyerola, M. and Sabate, S.: Predicting the future of forests in the Mediterranean under climate change, with nicheand process-based models: CO2 matters!, Glob. Chang. Biol., 17(1), 565–579, doi:10.1111/j.1365-2486.2010.02254.x, 2011.
382! 383! 384!
Larcher, W.: Temperature stress and survival ability of Mediterranean sclerophyllous plants, Plant Biosyst. - An Int. J. Deal. with all Asp. Plant Biol., 134(3), 279–295, doi:10.1080/11263500012331350455, 2000.
385! 386! 387!
Lavorel, S., Canadell, J., Rambal, S. and Terradas, J.: Mediterranean terrestrial ecosystems": research priorities on global change effects, Glob. Ecol. Biogeogr., 7(3), 157–166, doi:10.1046/j.1466-822X.1998.00277.x, 1998.
388! 389! 390! 391!
Limousin, J. M., Misson, L., Lavoir, A. V., Martin, N. K. and Rambal, S.: Do photosynthetic limitations of evergreen Quercus ilex leaves change with longterm increased drought severity?, Plant, Cell Environ., 33(5), 863–875, doi:10.1111/j.1365-3040.2009.02112.x, 2010.
392! 393! 394! 395!
Limousin, J. M., Rambal, S., Ourcival, J. M., Rocheteau, A., Joffre, R. and Rodriguez-Cortina, R.: Long-term transpiration change with rainfall decline in a Mediterranean Quercus ilex forest, Glob. Chang. Biol., 15(9), 2163–2175, doi:10.1111/j.1365-2486.2009.01852.x, 2009.
396! 397! 398! 399!
Llorens, L., Penuelas, J. and Estiearte, M.: Ecophysiological responses of two Mediterranean shrubs, Erica multiflora and Globularia alypum, to experimentally drier and warmer conditiions, Physiol. Plant., 119(Ipcc 2001), 231–243, doi:10.1034/j.1399-3054.2003.00174.x, 2003.
400! 401! 402! 403! 404!
Martin-Stpaul, N. K., Limousin, J. M., Vogt-Schilb, H., Rodríguez-Calcerrada, J., Rambal, S., Longepierre, D. and Misson, L.: The temporal response to drought in a Mediterranean evergreen tree: Comparing a regional precipitation gradient and a throughfall exclusion experiment, Glob. Chang. Biol., 19, 2413– 2426, doi:10.1111/gcb.12215, 2013.
405! 406! 407!
Maselli, F.: Monitoring forest conditions in a protected Mediterranean coastal area by the analysis of multiyear NDVI data, Remote Sens. Environ., 89(4), 423–433, doi:10.1016/j.rse.2003.10.020, 2004. !
15!
Biogeosciences Discuss., doi:10.5194/bg-2016-491, 2016 Manuscript under review for journal Biogeosciences Published: 15 November 2016 c Author(s) 2016. CC-BY 3.0 License.
408! 409! 410! 411! 412!
Maselli, F., Cherubini, P., Chiesi, M., Gilabert, M. A., Lombardi, F., Moreno, A., Teobaldelli, M. and Tognetti, R.: Start of the dry season as a main determinant of inter-annual Mediterranean forest production variations, Agric. For. Meteorol., 194(2014), 197–206, doi:10.1016/j.agrformet.2014.04.006, 2014.
413! 414! 415! 416! 417! 418!
Moffat, A. M., Papale, D., Reichstein, M., Hollinger, D. Y., Richardson, A. D., Barr, A. G., Beckstein, C., Braswell, B. H., Churkina, G., Desai, A. R., Falge, E., Gove, J. H., Heimann, M., Hui, D., Jarvis, A. J., Kattge, J., Noormets, A. and Stauch, V. J.: Comprehensive comparison of gap-filling techniques for eddy covariance net carbon fluxes, Agric. For. Meteorol., 147(3–4), 209–232, doi:10.1016/j.agrformet.2007.08.011, 2007.
419! 420! 421!
Nardini, A., Salleo, S., Lo Gullo, M. A. and Pitt, F.: Different responses to drought and freeze stress of Quercus ilex L. growing along a latitudinal gradient, Plant Ecol., 148(2), 139–147, doi:10.1023/A:1009840203569, 2000.
422! 423! 424!
Nissen, K. M., Leckebusch, G. C., Pinto, J. G. and Ulbrich, U.: Mediterranean cyclones and windstorms in a changing climate, Reg. Environ. Chang., 14(5), 1873–1890, doi:10.1007/s10113-012-0400-8, 2014.
425! 426! 427! 428! 429!
Ogaya, R., Peñuelas, J., Asensio, D. and Llusià, J.: Chlorophyll fluorescence responses to temperature and water availability in two co-dominant Mediterranean shrub and tree species in a long-term field experiment simulating climate change, Environ. Exp. Bot., 73(1), 89–93, doi:10.1016/j.envexpbot.2011.08.004, 2011.
430! 431! 432! 433! 434!
Papale, D., Reichstein, M., Aubinet, M., Canfora, E., Bernhofer, C., Kutsch, W., Longdoz, B., Rambal, S., Valentini, R., Vesala, T. and Yakir, D.: Towards a standardized processing of Net Ecosystem Exchange measured with eddy covariance technique: algorithms and uncertainty estimation, Biogeosciences, 3(4), 571–583, doi:10.5194/bg-3-571-2006, 2006.
435! 436! 437! 438!
Peguero-Pina, J. J., Alquézar-Alquézar, J. M., Mayr, S., Cochard, H. and GilPelegrín, E.: Embolism induced by winter drought may be critical for the survival of Pinus sylvestris L. near its southern distribution limit, Ann. For. Sci., 68(3), 565–574, doi:10.1007/s13595-011-0068-0, 2011.
439! 440! 441! 442! 443!
Pereira, J. S., Mateus, J. a., Aires, L. M., Pita, G., Pio, C., David, J. S., Andrade, V., Banza, J., David, T. S., Paço, T. a. and Rodrigues, a.: Net ecosystem carbon exchange in three contrasting Mediterranean ecosystems – the effect of drought, Biogeosciences, 4(5), 791–802, doi:10.5194/bg4-791-2007, 2007.
444! 445! 446!
Polade, S. D., Pierce, D. W., Cayan, D. R., Gershunov, A. and Dettinger, M. D.: The key role of dry days in changing regional climate and precipitation regimes., Sci. Rep., 4(4364), 8pp, doi:10.1038/srep04364, 2014.
447! 448! 449! 450!
Reichstein, M., Falge, E., Baldocchi, D., Papale, D., Aubinet, M., Berbigier, P., Bernhofer, C., Buchmann, N., Gilmanov, T., Granier, A., Grünwald, T., Havrankova, K., Ilvesniemi, H., Janous, D., Knohl, A., Laurila, T., Lohila, A., Loustau, D., Matteucci, G., Meyers, T., Miglietta, F., Ourcival, J. M.,
!
16!
Biogeosciences Discuss., doi:10.5194/bg-2016-491, 2016 Manuscript under review for journal Biogeosciences Published: 15 November 2016 c Author(s) 2016. CC-BY 3.0 License.
451! 452! 453! 454! 455!
Pumpanen, J., Rambal, S., Rotenberg, E., Sanz, M., Tenhunen, J., Seufert, G., Vaccari, F., Vesala, T., Yakir, D. and Valentini, R.: On the separation of net ecosystem exchange into assimilation and ecosystem respiration: Review and improved algorithm, Glob. Chang. Biol., 11(9), 1424–1439, doi:10.1111/j.1365-2486.2005.001002.x, 2005.
456! 457! 458! 459! 460!
Reichstein, M., Tenhunen, J. D., Roupsard, O., Ourcival, J. M., Rambal, S., Miglietta, F., Peressotti, A., Pecchiari, M., Tirone, G. and Valentini, R.: Severe drought effects on ecosystem CO2 and H2O fluxes at three Mediterranean evergreen sites: Revision of current hypotheses?, Glob. Chang. Biol., 8(10), 999–1017, doi:10.1046/j.1365-2486.2002.00530.x, 2002.
461! 462! 463!
Rey Benayas, J. M. and Scheiner, S. M.: Plant diversity, biogeography and environment in Iberia: Patterns and possible causal factors, J. Veg. Sci., 13(2), 245, doi:10.1658/1100-9233(2002)013[0245:PDBAEI]2.0.CO;2, 2002.
464! 465! 466! 467!
Sabaté, S., Gracia, C. A. and Sánchez, A.: Likely effects of climate change on growth of Quercus ilex, Pinus halepensis, Pinus pinaster, Pinus sylvestris and Fagus sylvatica forests in the Mediterranean region, For. Ecol. Manage., 162(1), 23–37, doi:10.1016/S0378-1127(02)00048-8, 2002.
468! 469! 470! 471!
Sohn, J. A., Kohler, M., Gessler, A. and Bauhus, J.: Interactions of thinning and stem height on the drought response of radial stem growth and isotopic composition of Norway spruce (Picea abies), Tree Physiol., 32(10), 1199– 1213, doi:10.1093/treephys/tps077, 2012.
472! 473! 474! 475!
Valladares, F., Zaragoza-Castells, J., Sanchez-Gomez, D., Matesanz, S., Alonso, B., Portsmuth, A., Delgado, A. and Atkin, O. K.: Is shade beneficial for Mediterranean shrubs experiencing periods of extreme drought and latewinter frosts?, Ann. Bot., 102(6), 923–933, doi:10.1093/aob/mcn182, 2008.
476! 477! 478! 479!
Vayreda, J., Martinez-Vilalta, J., Gracia, M. and Retana, J.: Recent climate changes interact with stand structure and management to determine changes in tree carbon stocks in Spanish forests, Glob. Chang. Biol., 18(3), 1028–1041, doi:10.1111/j.1365-2486.2011.02606.x, 2012.
480! 481! 482!
!
17!
Biogeosciences Discuss., doi:10.5194/bg-2016-491, 2016 Manuscript under review for journal Biogeosciences Published: 15 November 2016 c Author(s) 2016. CC-BY 3.0 License.
483! 484! 485! 486!
List of Figures
487!
types (ENT = evergreen needle trees; DBT = deciduous broadleaf trees; EBT = ever-
488!
green broadleaf trees; G = grasslands; S = Shrubs; numbers in the brackets indicating
489!
the numbers of sites per vegetation type) and (B) the GPP distribution C) the air
490!
temperatures (T) and D) the precipitation distribution observed during the different bi-
491!
monthly time periods (JF = January & February, MA = March & April, MJ = May &
492!
June, JA = July & August, SO = September & October, ND = November &
493!
December).
Fig. 1: Boxplots showing A) the general GPP distribution of the different vegetation
494! 495!
Fig. 2: Seasonal mean PPT versus the annual mean GPP for the different vegetation
496!
types and over the different bi-monthly time periods. See Fig. 1 for the abbreviations.
497!
A simple trend line & R-squared value (including all vegetation types) was added to
498!
those plots where a significant p-value was obtained during our statistical tests (see
499!
Tab. 3).
500! 501!
Fig. 3: Seasonal mean PPT versus the seasonal mean GPP for the different vegetation
502!
types and over the different bi-monthly periods. See Fig. 1 for the abbreviations.
503!
Trend lines & R-squared values (including all vegetation types) were added to those
504!
plots where a significant p-value was obtained during our statistical tests (see Tab. 3).
505! 506!
Fig. 4: Seasonal mean T versus the annual mean GPP for the different vegetation
507!
types and over the different bi-monthly time periods. See Fig. 1 for the abbreviations.
508!
A simple trend line & R-squared value (including all vegetation types) was added to
!
18!
Biogeosciences Discuss., doi:10.5194/bg-2016-491, 2016 Manuscript under review for journal Biogeosciences Published: 15 November 2016 c Author(s) 2016. CC-BY 3.0 License.
509!
those plots where a significant p-value was obtained during our statistical tests (see
510!
Tab. 3).
511! 512!
Fig. 5: Seasonal mean T versus the seasonal mean GPP for the different vegetation
513!
types and over the different bi-monthly time periods. Trend lines & R-squared values
514!
(including all vegetation types) were added to those plots where a significant p-value
515!
was obtained during our statistical tests (see Tab. 3). See Fig. 1 for the abbreviations.
516! 517! 518!
!
19!
Biogeosciences Discuss., doi:10.5194/bg-2016-491, 2016 Manuscript under review for journal Biogeosciences Published: 15 November 2016 c Author(s) 2016. CC-BY 3.0 License.
519!
Figures
520! 521!
Figure 1
!
20!
Biogeosciences Discuss., doi:10.5194/bg-2016-491, 2016 Manuscript under review for journal Biogeosciences Published: 15 November 2016 c Author(s) 2016. CC-BY 3.0 License.
522! 523!
Figure 2
!
21!
Biogeosciences Discuss., doi:10.5194/bg-2016-491, 2016 Manuscript under review for journal Biogeosciences Published: 15 November 2016 c Author(s) 2016. CC-BY 3.0 License.
524! 525!
Figure 3
!
22!
Biogeosciences Discuss., doi:10.5194/bg-2016-491, 2016 Manuscript under review for journal Biogeosciences Published: 15 November 2016 c Author(s) 2016. CC-BY 3.0 License.
526! 527!
Figure 4
!
23!
Biogeosciences Discuss., doi:10.5194/bg-2016-491, 2016 Manuscript under review for journal Biogeosciences Published: 15 November 2016 c Author(s) 2016. CC-BY 3.0 License.
528! 529!
Figure 5
530! 531! 532! !
24!
Biogeosciences Discuss., doi:10.5194/bg-2016-491, 2016 Manuscript under review for journal Biogeosciences Published: 15 November 2016 c Author(s) 2016. CC-BY 3.0 License.
533!
Tables
534! 535!
Tab. 1: Site description Nr.! SITE!ID! 1! 2! 3! 4! 5! 6! 7! 8! 9! 10! 11! 12! 13! 14! 15! 16! 17! 18! 19! 20! 21! 22! 23!
SITE!NAME!
ESES1! El!Saler! ESLgS! Laguna!Seca! ESLJu! Llano!de!los!Juanes! ESLMa! Las!Majadas!del!Tietar! ESLn1! LanjaronFNon!intervention! ESLn2! LanjaronFSalvage!logging! ESVDA! Vall!d’Alinya! FRFBn! FontFBlanche! FRPue! Puechabon! ITBon! Bonis! ITCA1! Castel!d’Asso1! ITCA3! Castel!d’Asso2! ITCol! CollelongoFSelva!Piana! ITCpz! Castelporziano! ITLec! Lecceto! ITNon! Nonantola! ITPia! Island!of!Pianosa! ITRo1! Roccarespampani1! ITRo2! Roccarespampani2! ITSRo! San!Rossore! ITTo1! Tolfa!wet! ITTo2! Tolfa!dry! ITTol! Tolfa!
536! !
!
Spain! Spain! Spain! Spain! Spain! Spain! Spain! France! France! Italy! Italy! Italy! Italy! Italy! Italy! Italy! Italy! Italy! Italy! Italy! Italy! Italy! Italy!
COORDINATES!! (Lat.,!Long.)! 39.3460,!F0.3188! 37.0979,!F2.9658! 36.9266,!F2.7521! 39.9415,!F5.7734! 36.9721,!F3.4739! 36.9695,!F3.4758! 42.1522,!1.4485! 43.2408,!5.6792! 43.7414,!3.5958! 39.4778,!16.5347! 42.3804,!12.0266! 42.3772,!12.0260! 41.8494,!13.5881! 41.7052,!12.3761! 43.3036,!11.2698! 44.6902,!11.0911! 42.5839,!10.0784! 42.4081,!11.9300! 42.3903,!11.9209! 43.7279,!10.2844! 42.1897,!11.9216! 42.1897,!11.9216! 42.1897,!11.9216!
evergreen!needleleaf!trees! evergreen!needleleaf!trees! shrubs! shrubs! shrubs! shrubs! grasslands! evergreen!needleleaf!trees! evergreen!broadleaf!trees! evergreen!needleleaf!trees! deciduous!broadleaf!trees! grasslands! deciduous!broadleaf!trees! evergreen!broadleaf!trees! evergreen!broadleaf!trees! deciduous!broadleaf!trees! shrubs! deciduous!broadleaf!trees! deciduous!broadleaf!trees! evergreen!needleleaf!trees! deciduous!broadleaf!trees! deciduous!broadleaf!trees! evergreen!broadleaf!trees!
!
!
!
COUNTRY!
!
VEGETATION!
537!
Tab. 2: Annual and bi-monthly subsets (PPT = precipitation; T = air temperature).
538!
Note that for the early winter (ND) subset we studied the impact of the PPT and T on
539!
the average annual GPP of the subsequent year rather than on the actual year. ID# S0! S1! S2! S3! S4! S5! S6!
541!
Subset#description# mean!annual!(Jan.FDec.)!PPT,!T!&!vegetation!! mean!JF!(Jan.!&!Feb.)!PPT,!T!&!vegetation! mean!MA!(Mar.!&!Apr.)!PPT,!T!&!vegetation! mean!MJ!(May!&!Jun.)!PPT,!T!&!vegetation! mean!JA!(Jul.!&!Aug.)!PPT,!T!&!vegetation! mean!SO!(Sept.!&!Oct.)!PPT,!T!&!vegetation! mean!ND!(Nov.!&!Dec.)!PPT,!T!&!vegetation!
!
(A) Impact!on!average!annual!GPP! (B) Impact!on!total!annual!GPP!(sum)! (C) Impact!on!average!seasonal!GPP!
!
!
25!
!
(C)'seasonal' approach!
!
(B)'sums!
!
(A)'averages'
!
! ! ! !
! ! annual'(S0)' ! Nr.!of!sites! 19! Nr.!of!years! 76! 2 R! 0.64! PPT! o! T! o! vegetation! 0.020!(p!
represent the applied significance level without using the Holm-Bonferroni correction (Seasonal Approach).
Sep!&!Oct!(S6)! 19! 75! 0.70! o! o! 0.030!(p!
26!
! Nov!&!Dec!(S1)! 15! 56! 0.70! o! 0.011!(p!
Bonferroni correction. Red numbers indicate the p-values that lost their significance after the Holm-Bonferroni correction. Black numbers
0.05). The used significance levels are given in brackets. Green numbers are representing p-values that are still significant after the Holm-
Tab. 3: Results of the statistical analysis. The numbers represent significant p-values (p < 0.05) whereas an ‘o’ represents no significance (p >
Biogeosciences Discuss., doi:10.5194/bg-2016-491, 2016 Manuscript under review for journal Biogeosciences Published: 15 November 2016 c Author(s) 2016. CC-BY 3.0 License.