Edible crab. 3.324. 2.497. 0.354. 2.360. 0.950 0.150. 31. Velvet crab. 2.622. 0.808. 0.646. 12.775 0.950. 0.051. 32. Crustaceans. 2.691. 14.012. 0.871. 5.807.
1
Impact of ocean warming on sustainable fisheries management informs the Ecosystem
2
Approach to Fisheries
3
Serpetti, N., Baudron, A.R., Burrows, M.T., Payne, B.L., Helaouët, P., Fernandes, P.G.,
4
Heymans, J.J.
5 6 7 8 9 10 11 12 13 14 15 16 17 18 19
Supplementary Methods The model. The model was built in Ecopath with Ecosim (EwE) version 6.5 (July 2016). Ecopath is a mass balance representing a snapshot of the ecosystem in a given year, 1985 in this case. For each functional group (i), Ecopath requires three of the following four inputs: starting biomasses (Bi, t*km-2), production/biomass ratio (Pi/Bi, year-1), production/consumption ratio (Qi/Bi, year-1), or ecotrophic efficiency (EEi) which indicates the proportion of mortality explained by the model. In addition, to estimate how the energy is flowing through the ecosystem, trophic relationships within the functional groups (proportion of each prey in the diet) and fishing information (yield= landings + discards, t*km-2 year-1) are also required. Ecosim then uses these inputs as starting information to simulate the dynamics over time of each functional group. In Ecosim a series of differential equations describe changes in biomass for each trophic group (i) over time as: 𝑑𝐵𝑖
20
𝑑𝑡
𝑃
= ( ) ∑𝑗 𝑄𝑗𝑖 (𝑡) − ∑𝑗 𝑄𝑖𝑗 (𝑡) + 𝐼𝑖 − 𝐵𝑖 ∗ (𝑀𝑖 + 𝐹𝑖 + 𝑒𝑖 ) 𝑄 𝑖
(1)
21 𝑑𝐵𝑖
𝑃
is the biomass growth rate of group i in the time 𝑑𝑡, (𝑄)
22
Where
23 24 25 26 27 28 29 30 31 32 33 34 35 36 37 38 39 40 41 42 43 44 45 46
production/consumption ratio, Qji is the consumption of group j (predator) on prey group(s) i, Qij is the consumption for predation by all predators j on group i (prey), Ii is the immigration rate, Bi is the starting biomass, Mi and Fi are the natural and fishing mortality rates of group i, respectively, and ei is the density dependent emigration rate1. Fishing mortality or fishing effort is used to drive the model and Ecosim predicts biomasses and catches that can then be compared to observed time-series data of biomass and catches using a log-likelihood sum of squares for calibration2. For each predator, consumption (Qij) is calculated based on the “foraging arena” theory3 which define the degree of “vulnerability (v)” of the prey versus its predators due to the assumption that animals can optimise the way they spend their time4, balancing predation risk with foraging1. The study area the EwE model of the West Coast of Scotland (WCS)5 is defined by ICES VIa division continental shelf (>200 m) covering about 110,000 km2. The model includes five fleets (demersal trawl, nephrops trawl, other trawl, potting and diving, and pelagic trawl) and a total of 41 functional groups including marine mammals (3), seabirds (1), fish (23, six of which were composed of adult and juvenile stages for cod, haddock and whiting), invertebrates (5), cephalopods (1), zooplankton (2), benthos (3), primary producers (2), and detritus (1) (for details please refer to Alexander et al.5. Functional groups were defined by combining species that are similar in predator-prey interactions, ecosystem functioning and habitat preferences5.
𝑑𝑡
𝑖
is its
Model updating: Ecopath. The WCS model was updated in both the Ecopath (basic balanced baseline) and Ecosim (temporal dynamics). The hindcasted biomasses and catches for 1985 were updated with the latest data available (stock assessment and ICES DATRAS, http://www.ices.dk/marine-data/data-portals/Pages/DATRAS.aspx): starting biomasses of
47 48 49 50 51 52 53 54 55 56
mackerel and horse mackerel were divided by 2 to take into account their migratory habits within the ICES Division VIa. Age-length keys obtained from the ICES DATRAS database were applied to von Bertalanffy growth functions to obtain the basic inputs for the three multi-stanza groups (cod, haddock and whiting). Ecopath biomass basic estimates, landings and discards basic inputs are shown in Supplementary Table S1, S2 and S3 respectively. Supplementary Table S1. Basic estimates indicating basic inputs (in bold) and estimated values of trophic level, biomass, production/biomass (P/B), consumption/biomass (C/B), ecotrophic efficiency (EE), and production/consumption (P/C). Group num. 1 2 3 4 5 6 7 8 9 10 11 12 13 14 15 16 17 18 19 20 21 22 23 24 25 26 27 28 29 30 31 32 33 34 35 36 37 38 39 40 41
Group name Grey seals Harbour seals Cetaceans Seabirds Cod mature Cod juv. Haddock mature Haddock juv. Whiting mature Whiting juv. Saithe Gurnards Monkfish Flatfish Rays Sharks Large demersals Benthopelagic fish Mackerel Horse Mackerel Blue Whiting Other pelagics Herring Norway pout Poor cod Sandeel Sprat Norway lobster Lobster Edible crab Velvet crab Crustaceans Cephalopod Large zooplankton Small zooplankton Infauna Scallops Epifauna Algae Phytoplankton Detritus
Trophic level 4.477 4.602 4.237 4.145 4.019 3.178 3.614 2.939 4.157 3.045 3.971 3.604 4.323 3.413 3.858 4.066 4.274 3.245 3.340 3.187 3.635 3.516 3.156 3.276 3.530 3.184 3.159 3.415 3.395 3.324 2.622 2.691 3.241 2.158 2.031 2.037 2.000 2.391 1.000 1.000 1.000
Biomass (t/km²) 0.036 0.011 0.023 0.025 0.297 0.264 0.563 0.416 0.390 0.396 0.505 0.123 0.094 0.740 0.119 0.242 1.034 0.601 4.319 3.310 1.978 2.123 5.943 1.292 0.072 1.228 1.758 1.000 0.029 2.497 0.808 14.012 0.982 14.775 7.821 3.048 9.375 2.813 5.743 16.569 100.000
P/B (/year) 0.114 0.101 0.020 0.400 1.143 2.207 1.096 1.743 1.131 1.710 0.937 0.824 0.480 1.130 0.449 0.682 0.488 1.581 0.626 0.740 1.500 1.800 1.500 1.680 1.170 1.826 1.584 0.730 0.338 0.354 0.646 0.871 1.981 10.000 18.000 20.000 0.445 20.000 5.000 70.000
C/B (/year) 11.388 10.124 14.000 83.051 3.500 9.048 4.960 11.037 4.500 9.016 4.686 4.122 1.714 3.768 2.243 3.410 2.442 5.270 4.400 3.700 6.000 6.000 10.100 5.600 3.900 6.085 5.280 4.876 3.650 2.360 12.775 5.807 15.000 35.000 72.000 80.000 14.334 80.000 0.000 0.000
EE
P/C
0.000 0.000 0.000 0.000 0.594 0.845 0.402 0.889 0.581 0.916 0.612 0.950 0.950 0.950 0.950 0.950 0.950 0.950 0.649 0.718 0.603 0.950 0.694 0.950 0.950 0.950 0.950 0.482 0.950 0.950 0.950 0.950 0.950 0.950 0.950 0.950 0.950 0.950 0.950 0.950 0.861
0.010 0.010 0.001 0.005 0.326 0.244 0.221 0.158 0.251 0.190 0.200 0.200 0.280 0.300 0.200 0.200 0.200 0.300 0.142 0.200 0.250 0.300 0.149 0.300 0.300 0.300 0.300 0.150 0.093 0.150 0.051 0.150 0.132 0.286 0.250 0.250 0.031 0.250
57 58 59 60
Supplementary Table S2. Basic inputs of landings data for the functional groups for each fleet5: DTR (demersal trawling), NTR (nephrops trawling), OTR (other trawling), POT (potting and diving), PTR (pelagic trawling).
Group num. 1 2 3 4 5 6 7 8 9 10 11 12 13 14 15 16 17 18 19 20 21 22 23 24 25 26 27 28 29 30 31 32 33 34 35 36 37 38 39 40 41
61 62 63 64 65 66 67
Group name Grey seals Harbour seals Cetaceans Seabirds Cod mature Cod juv. Haddock mature Haddock juv. Whiting mature Whiting juv. Saithe Gurnards Monkfish Flatfish Rays Sharks Large demersals Benthopelagic fish Mackerel Horse Mackerel Blue Whiting Other pelagics Herring Norway pout Poor cod Sandeel Sprat Norway lobster Lobster Edible crab Velvet crab Crustaceans Cephalopod Large zooplankton Small zooplankton Infauna Scallops Epifauna Algae Phytoplankton Detritus
DTR (t/km²/year) 0 0 0 0 0.146 0.006 0.145 0.0007 0.098 0.005 0.204 0.002 0.029 0.046 0.028 0.096 0.173 0.002 0.0002 0.0003 0.002 0 0.0002 0 0 0 0 0.007 6.1*10-6 4.77*10-5 1.94*10-5 4.26*10-6 0.0003 0 0 0 2.01*10-5 5.48*10-6 0 0 0
NTR (t/km²/year) 0 0 0 0 0.015 0.001 0.004 9.41*10-6 0.012 0.002 0.024 0.0001 0.008 0.013 0.005 0.022 0.042 0.0002 0.007 0.0003 0.011 0 0.0007 0 0 1.04E-06 0 0.0939 0 0 0 0 3.00*10-5 0 0 0 2.13*10-5 5.80*10-6 0 0 0
OTR (t/km²/year) 0 0 0 0 8.72*10-5 5.84*10-6 1.05*10-5 3.54*10-7 2.58*10-7 2.61*10-8 0.0002 0 1.59*10-5 9.42*10-5 0.0002 0.0008 0.0002 2.48*10-5 0 0.173 0.0015 0 6.01*10-5 0.0105 0 0.169 0 2.53*10-5 4.16*10-5 0.0003 0.0019 2.9*10-5 2.12*10-7 0 0 0 0.038 0.0103 0 0 0
POT (t/km²/year) 0 0 0 0 0 0 0 0 0 0 0 0 0 0 0 0 0 8.64*10-5 0 0 0 0 0 0 0 0 0 0.012 0.0056 0.044 0.002 0.004 0 0 0 0 0.022 0.006 0 0 0
PTR (t/km²/year) 0 0 0 0 0 0 0 0 0 0 0 0 0 0 0 0.003 0 0.0016 1.011 0.127 0.861 0 0.357 0 0 0 0.032 0 0 0 0 0 0 0 0 0 0 0 0 0 0
68 69 70
71 72 73 74 75 76 77 78 79 80 81 82 83 84 85 86 87 88 89 90 91 92 93 94 95 96 97 98 99 100
Supplementary Table S3. Basic inputs of discard data for the functional groups for each fleet5: DTR (demersal trawling), NTR (nephrops trawling), OTR (other trawling), POT (potting and diving), PTR (pelagic trawling). Group Group DTR NTR OTR POT PTR num. name (t/km²/year) (t/km²/year) (t/km²/year) (t/km²/year) (t/km²/year) 5 Cod mature 0.0003 3.40*10-5 1.94*10-7 0 0 -6 6 Cod juv. 0.007 0.0015 6.35*10 0 0 -6 7 Haddock mature 0.032 0.0009 2.31*10 0 0 8 Haddock juv. 0.011 0.0092 5.71*10-7 0 0 -8 9 Whiting mature 0.025 0.0028 5.99*10 0 0 -8 10 Whiting juv. 0.0112 0.005 6.67*10 0 0 12 Gurnards 0 0 0 0 0 13 Monkfish 0.0018 0.0005 9.80*10-7 0 0 -5 14 Flatfish 0.013 0.0036 2.66*10 0 0 -5 15 Rays 0.006 0.0012 4.85*10 0 0 16 Sharks 0 0 0 0 0 17 Large demersals 0.0455 0.0111 4.71*10-5 0 0 -5 -6 -5 18 Benthopelagic fish 0.0003 3.43*10 4.00*10 1.40*10 0.00026 Adjusting the diet matrix is a powerful and often underused way of improving EwE models6. Thus, the original diet matrix7 was revisited based on updated knowledge of stomach contents from DAPSTOM database8 and from two closely related ecosystems, the North Sea9 and Irish Sea10, assuming that species on the WCS consume similar prey as in those adjacent ecosystems. Please for Ecopath diet matrix details refer to Supplementary Table S5. To ecologically test the model mass-balance of the updated Ecopath model, a pre-balance (PREBAL) analysis11 was applied and compared with the previous WCS model5,12: no substantial differences were found (data not shown). Confidence interval of the data inputs (pedigree) was also assessed (Supplementary Table S4) for subsequent analysis of the prediction uncertainties.
101 102 103 104 105
Supplementary Table S4. Input data pedigree indicating confidence interval (%) of the data input. The highest confidence interval (80%) was allocated when the data are estimated by Ecopath, sourced from other model or guess estimation, 50% where input data were calculated by indirect methods, 30% when input data were sampled in the study area with a low precision and 10% with high precision. Group num. 1 2 3 4 5 6 7 8 9 10 11 12 13 14 15 16 17 18 19 20 21 22 23 24 25 26 27 28 29 30 31 32 33 34 35 36 37 38 39 40 41
106 107 108 109 110
Group name Grey seals Harbour seals Cetaceans Seabirds Cod mature Cod immature Haddock mature Haddock immature Whiting mature Whiting immature Saithe Gurnards Monkfish Flatfish Rays Sharks Large demersals Benthopelagic fish Mackerel Horse Mackerel Blue Whiting Other pelagics Herring Norway pout Poor cod Sandeel Sprat Nephrops Lobster Edible crab Velvet crab Crustaceans Cephalopod Large zooplankton Small zooplankton Infauna Scallops Epifauna Algae Phytoplankton Detritus
Biomass 50 50 50 50 10 10 50 50 10 10 50 80 80 80 80 80 80 80 50 50 50 80 10 80 80 80 80 50 80 80 80 80 80 80 80 80 80 80 80 80 NA
Production / biomass 80 80 80 80 50 80 50 80 50 80 80 80 80 80 80 80 80 80 50 80 50 80 50 80 80 80 80 80 50 50 50 80 80 80 80 80 50 80 NA NA NA
Consumption / biomass 50 50 80 80 50 80 50 80 50 80 50 50 50 50 50 50 50 50 50 50 80 50 50 50 50 50 50 80 50 80 50 80 80 80 80 80 50 80 NA NA NA
Diet 10 10 80 80 30 30 30 30 30 30 30 80 30 30 80 80 30 80 30 30 30 80 30 30 30 30 30 80 80 80 80 80 80 80 80 80 80 80 NA NA NA
Catch NA NA NA NA 50 50 50 50 50 50 50 50 50 50 50 50 50 50 50 50 50 50 50 50 NA 50 50 50 50 50 50 50 50 NA NA NA 50 50 NA NA NA
Model updating: Ecosim. Observed biomass time-series data were obtained from ICES DATRAS following the method from Baudron and Fernandes 13 for demersal and benthic groups whilst assessment data were used for gadoid multi-stanza groups14 and underwater TV surveys14 for Norway lobster species. Pelagic species are not effectively captured by bottom
111 112 113 114 115 116 117 118 119 120 121 122 123 124 125 126 127 128 129 130 131 132 133 134 135 136 137 138 139 140 141 142 143 144 145 146 147 148 149 150 151 152 153 154 155 156 157 158
trawl surveys. Therefore, when available, other biomass data sources such as acoustic surveys for the subarea VIa north for herring15 and total stock biomass estimates for the western shelf (scaled down to VIa using the average proportion of landings) for mackerel and horse mackerel16 were used. Biomass estimates of grey and harbour seal pup production from the Inner and Outer Hebrides17 were used as biomass trends for these species. Abundances values of small (< 2 mm) and large (> 2 mm) zooplankton, and phytoplankton Colour Index (PCI) were obtained from the Sir Alister Hardy Foundation for Ocean Science (SAHFOS). The PCI constitutes a semi-quantitative representation of the total phytoplankton biomass. PCI is a rough assessment of the greenness of the Continuous Plankton Recorder (CPR) silk into 5 categories that consistently reflects not only changes in the abundance of phytoplankton, but also its composition18. Multi-scale temporal eigenfunction analysis, namely distance-based Moran’s eigenvector maps (dbMEM19, was applied on planktonic data. The decomposition of the temporal relationships among plankton into all possible scales of variation along the time series allowed the calculation of a monthly time series broad-scale submodel. Catch time-series for gadoid multi-stanza groups were obtained from stock assessment reports which accounted for discards. Cod and whiting are assessed in ICES Division VIa, however haddock is assessed for both IV and VIa areas combined20, hence, ICES VIa was assumed to contribute 9.5% of haddock catches as this is the proportion of haddock TAC allocated to VIa21. For all other groups, 1985-2013 landings were obtained from ICES standardised surveys (STATLANT, http://ices.dk/marine-data/dataset-collections/Pages/Fishcatch-and-stock-assessment.aspx). Discard rates have only been recorded since 200322, thus 1985-2002 discard rates were estimated by inversely applying 2003-2013 average discard rates to 1985-2002 landings time-series. Standardised surveys well represented temporal trends, but biomass values are underestimated compare to stock assessments estimates. Biomass time-series obtained from these datasets were therefore raised by the 1985 starting biomass values before calculating the exploitation rate or fishing mortality (F) as catch to biomass ratio (C/B). Lastly, the “feeding time adjustment rate” (Dj in equation 4) was set to 0.5 for mammals as suggested by Christensen, et al. 1 and to 0.2 for immature stanzas which still feed on egg content in early life stages, while it was set to 0 for all other groups. Ecosim time-series are shown in Supplementary Table S6. Time-series of depth integrated temperature (DIT) (Fig. 2 and Fig. 3c) were added to the model as an absolute forcing function and functional groups optimum temperatures and tolerances (defined by left/right standard deviations of the response function) were used to calculate the group functional responses to temperature (Supplementary Table S8). Model updating: fitting. The model fitting was performed using an automated stepwise fitting procedure23 was used to define the ecosystem driving forces (e.g. fishing), the vulnerability values of the trophic interactions as well as a primary productivity anomaly function that improve the statistical fit of predicted/observed data using the weighted sum of squared differences (SS) and the Akaike Information Criterion (AIC). The stepwise fitting procedure tested 1,990 model interactions based on 28 time-series of relative biomasses, 22 time-series of catches and 22 of fishing mortality and 9 time-series of forced catches with a total of 1,356 observations (observed data points) estimating a maximum number of 49 parameters (based only on independent time-series). The fitting procedure searched for vulnerability parameters “by predator” for all iterations assuming the same top-down or bottom up control of the predator on all its prey23. Fitted vulnerabilities values are shown in Supplementary Table S7.
Biomasses (B)
8 6
8
2 0 0
2
4
6
8
10
0
4
6
Catches (A)
Catches (B)
Catches (C)
2.0
Predicted
0.5 0.0
0.5 0.0 1.5
1.0
1.5
2.0 1.5 1.0
Predicted
1.5
1.0 Observed
8
2.0
Observed
1.0
0.5
2
Observed
0.0 0.0
4
Predicted
6
8 6
Predicted
2 0 4 Observed
0.5
Predicted
4
4 0
2
2.0
0
159 160 161 162 163 164
Biomasses (C)
10
GS COD HAD WHI SAI LD MAC HM HER NL
2
Predicted
6
8
Biomasses (A)
0.0
0.5
1.0 Observed
1.5
2.0
0.0
0.5
1.0
1.5
2.0
Observed
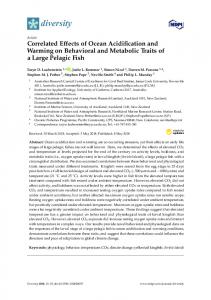
Supplementary Fig. S1. Predicted vs observed data for both biomasses and catches across three validation datasets (A: 22 years for model fitting, 7 years validation set; B: 24 years for model fitting, 5 years validation set; C: 26 years for model fitting, 3 years validation set) illustrating over- and underestimation for the target species predictions (GS (yellow)= grey seals; COD (red)= cod; HAD (light green)= haddock; WHI (blue)= whiting; SAI (light blue)= saithe; LD (magenta)= large demersal; MAC (black)= mackerel; HM (dark green)= horse mackerel; HER (orange)= herring; NL (grey)= Norway lobster).
165 166 167
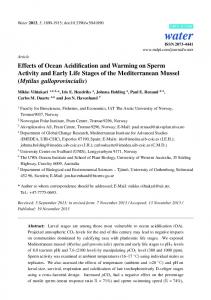
Supplementary Fig. S2. 95% and 5% percentiles of the Monte Carlo simulations using 10% fixed variability of the model inputs (grey area) and the input pedigree (Supplementary Table S4) (dashed lines).
168
169 170 171 172 173 174 175 176 177 178 179 180 181 182
183 184
Supplementary Fig. S3. High resolution spatial difference between surface/near-bottom water temperatures in UK waters integrated over 1971-2000. The scaling factor (0.61 °C) was calculated as an average within the continental shelf of the ICES VIa rectangle. Monthly mean data for surface and near-bottom temperatures at ∼10km resolution for UK waters can be requested from the authors24 or be found online at the ICES Ocean climatology of the North-West European shelf, ICES, Copenhagen. (http://ocean.ices.dk/Project/OCNWES/Default.aspx - extraction 15 June 2016). The figure was developed using R software25 version 3.2.0.
185 186 187 188 189 190 191 192 193 194 195 196 197 198 199 200 201 202 203 204 205 206 207 208 209 210 211 212 213 214 215 216 217 218 219 220 221 222 223 224 225 226 227 228 229 230 231 232
Supplementary Fig. S4. Future SST projections were extracted from the Royal Netherlands Meteorological Institute Climate Explorer portal (http://climexp.knmi.nl) within the study area rectangle from the climate changing multi-model ensemble means (RCP2.6, RCP4.5, RCP6.5 and RCP8.5 scenarios). The RCP scenarios are based on different rates of greenhouse gas emissions by 2100 and consequently rising sea surface temperature (SST) between 2014-2100 in the WCS ecosystem. The RCP2.6 represents a scenario where total radiative forcing is reduced from values of ∼3.1 Wm-2 in the mid-century to a stabilised value of ∼2.6Wm-2 by 2100. Even in this scenario, SST is predicted to increase of ~0.5°C by 2100. The RCP4.5 represents a scenario where total radiative forcing is stabilized at∼4.5Wm-2 by 2100 and in which SST rising of ~1°C by 2100. The RCP6.0 represents a scenario where total radiative forcing is stabilized at∼6.0Wm-2 with predicted oglobal ocean temperature rising of 1.5°C by 2100. RCP8.5 represents a rising pathway scenario characterized by a continuous increasing of greenhouse gas emission with rates greater than >8.5Wm-2 by 2100. RCP8.5 yields the highest rates of warming with global mean sea surface temperature in 2100 increasing by ~2.5°C. Thirty-two model outputs, sourced from the Coupled Model Intercomparison Project phase 5 (CMIP5), were extracted for the study area with temperatures fluctuating around their mean by 6-7 °C. References 1 Christensen, V., Walters, C. J., Pauly, D. & Forrest, R. Ecopath with Ecosim, version 6. User Guide. 235 pp. (University of British Columbia, Vancouver, B.C., Canada, 2008). 2 Christensen, V. & Walters, C. J. Ecopath with Ecosim: methods, capabilities and limitations. Ecol. Model. 172, 109-139 (2004). 3 Ahrens, R. N. M., Walters, C. J. & Christensen, V. Foraging arena theory. Fish Fish. 13, 41-59 (2012). 4 Walters, C., Christensen, V. & Pauly, D. Structuring dynamic models of exploited ecosystems from trophic mass-balance assessments. Rev. Fish Biol. Fish. 7, 139-172 (1997). 5 Alexander, K. A. et al. Investigating the recent decline in gadoid stocks in the west of Scotland shelf ecosystem using a foodweb model. ICES J. Mar. Sci. 72, 436-449 (2015). 6 Ainsworth, C. H. & Walters, C. J. Ten common mistakes made in Ecopath with Ecosim modelling. Ecol. Model. 308, 14-17 (2015). 7 Bailey, N. et al. The West of Scotland Marine Ecosystem: A Review of Scientific Knowledge. Marine Scotland Science Report 0911 (2011). 8 Pinnegar, J. K., Tomczak, M. T. & Link, J. S. How to determine the likely indirect food-web consequences of a newly introduced non-native species: A worked example. Ecol. Model. 272, 379-387 (2014). 9 Mackinson, S. & Daskalov, G. An ecosystem model of the North Sea to support an ecosystem approach to fisheries management: description and parameterisation. Cefas Science Series Technical Report 142 (2007). 10 Lees, K. & Mackinson, S. An Ecopath model of the Irish Sea: ecosystems properties and sensitivity analysis. Cefas Science Series Technical Report 138 (2007). 11 Link, J. S. Adding rigor to ecological network models by evaluating a set of prebalance diagnostics: A plea for PREBAL. Ecol. Model. 221, 1580-1591 (2010). 12 Heymans, J. J. et al. Best practice in Ecopath with Ecosim food-web models for ecosystem-based management. Ecol. Model. 331, 173-184 (2016).
233 234 235 236 237 238 239 240 241 242 243 244 245 246 247 248 249 250 251 252 253 254 255 256 257 258 259 260 261 262 263 264 265 266 267 268 269 270 271 272 273 274 275 276 277 278 279 280 281 282
13
14 15
16
17 18 19 20
21
22 23
24
25 26
27 28 29 30
31
Baudron, A. R. & Fernandes, P. G. Adverse consequences of stock recovery: European hake, a new "choke" species under a discard ban? Fish Fish. 16, 563-575 (2015). ICES. Report of the Working Group on Celtic Seas Ecoregion (WGCSE) - ICES CM 2014/ACOM:12. 2032 pp. (Copenhagen, Denmark, 2015a). ICES. Report of the Herring Assessment Working Group for the Area South of 62ºN (HAWG)-ICES CM 2014/ACOM:06. 1257 pp. (ICES HQ, Copenhagen, Denmark, 2014b). ICES. Report of the Report of the Working Group on Widely Distributed Stocks (WGWIDE) - ICES CM 2014/ACOM:15. 938 pp. (ICES Headquarters, Copenhagen, Denmark, 2014a). SCOS. Advice on matters related to the management of seal populations. 161pp. (2014). Batten, S. D. et al. CPR sampling: the technical background, materials and methods, consistency and comparability. Prog. Oceanogr. 58, 193-215 (2003). Legendre, P. & Legendre, L. in Numerical ecology Vol. Chapter 14 (Elsevier Science BV, 2012). ICES. Report of the Working Group for the Assessment of Demersal Stocks in the North Sea and Skagerrak (WGNSSK) - ICES CM 2014/ACOM:13. 1493 pp. (ICES HQ, Copenhagen, Denmark, 2015b). European-Union. Agreed record of fisheries consultations between the European Union and Norway for 2015, (2014). STECF. Evaluation of Fishing Effort Regimes in European Waters - Part 1 (STECF14-12). 480 pp. (Publications Office of the European Union, Luxembourg, 2014). Scott, E., Serpetti, N., Steenbeek, J. & Heymans, J. J. A Stepwise Fitting Procedure for automated fitting of Ecopath with Ecosim models. SoftwareX, doi:http://dx.doi.org/10.1016/j.softx.2016.02.002 (2016). Berx, B. & Hughes, S. L. Climatology of surface and near-bed temperature and salinity on the north-west European continental shelf for 1971-2000. Cont. Shelf Res. 29, 2286-2292 (2009). R: A language and environment for statistical computing. R Foundation for Statistical Computing (URL http://www.R-project.org/, Vienna, Austria, 2015). Kaschner, K. et al. in AquaMaps: Predicted range maps for aquatic species Vol. Version 08/2016 (World wide web electronic publication, www.aquamaps.org, 2016). Palomares, M. L. D. & Pauly, D. in SeaLifeBase (World Wide Web electronic publication (02/2017), 2017). Froese, R. & Pauly, D. in Fishbase (World Wide Web electronic publication (02/2017), 2017). ICES. Spawning and life history information for North Atlantic cod stocks. Report No. 274, 152 pp. (2005). Björnsson, B., Steinarsson, A. & Oddgeirsson, M. Optimal temperature for growth and feed conversion of immature cod (Gadus morhua L.). ICES J. Mar. Sci. 58, 29-38 (2001). Burrows, M. T., Twigg, G., Mieszkowska, N. & Harvey, R. Marine Biodiversity and Climate Change (MarClim) Scotland 2014/15. (Scottish Natural Heritage Commissioned Report No., in press., 2016).
Supplementary Table S5. Revised diet matrix Group num. 1-Grey seals 2-Harbour seals 3-Cetaceans 4 Seabirds
1
2
3
5 Cod mature
0.055
0.038
0.002
6-Cod juv.
0.045
7-Haddock mature
0.030
0.115
0.000
0.229
0.001
11-Saithe
0.060
0.001
0.077
0.015
0.047
13- Monkfish
0.001 0.005
10
11
12
0.008
0.005
0.052
0.012
0.002
13
14
15
0.024
0.000
0.004
0.006
0.002
0.002 0.023
0.034
0.037
0.002
0.006 0.007
0.030
0.156
0.002
0.118
18- Benthopelagic fish
0.010
0.097
19-Mackerel
0.018
20-Horse Mackerel
0.346
0.059
0.001
0.052 0.002
0.003
22-Other pelagics 23-Herring
0.054
0.077
24-Norway pout
0.038
0.054
25-Poor cod
0.010
26-Sandeel
0.438
27-Sprat
0.010
0.012
18
19
0.029
0.001
0.052
0.001
0.033
0.001
0.002
0.004
0.063
0.005
0.001
0.001
0.007
0.020
0.030
0.007
0.001
0.001
0.010
0.010 0.001
0.009
0.004
0.001
0.033
0.005
0.020
0.001
0.001
0.041
0.010
0.001
0.010
0.037
0.042
0.022
0.056
0.007
0.030
0.000
0.001
0.030
0.006
0.039
0.030 0.126
0.013
0.010
17
0.006
0.000
17-Large demersals
16
0.021
0.059
0.001
16-Sharks
28-Norway lobster
0.009
0.039
15- Rays
21-Blue Whiting
9
0.007 0.002
0.096
8
0.009
0.007
12-Gurnards
14-Flatfish
7
0.045 0.003
10-Whiting juv.
6
0.021 0.006
0.027
5
0.010 0.027
8-Haddock juv 9-Whiting mature
4
0.014
0.098
0.010
0.024
0.070
0.010
0.005
0.017
0.164
0.010
0.100
0.026
0.032
0.019
0.638
0.125
0.107
0.018
0.123
0.012
0.015
0.023
0.001
0.356
0.092
0.001
0.346
0.147
0.031
0.108
0.020
0.015
0.009
0.020
0.201
0.004
0.113
0.050
0.001
0.000
0.001
0.001
0.000
0.001
0.001
0.077
0.086
0.044
0.030
0.051
0.030
0.084
0.104
0.005
0.135
0.001
0.080
0.133
0.090
0.006
0.014
0.034
0.040
0.020
0.050
0.006
0.020
0.171 0.038
0.015
0.020
0.021
0.010
0.081
0.010
0.130
0.301
0.080
0.100
0.010
0.002
0.010
0.010
0.000
0.001
0.001
0.001
0.050
0.021
0.001
0.010
0.040
0.098
0.010
0.010
0.130
29-Lobster
0.001
0.001
30-Edible crab
0.006
0.001
31-Velvet crab
0.001
0.001
0.002
32-Crustaceans 0.010
33 Cephalopod
0.035
0.004
34-Large zooplankton
0.119
35 Small zooplankton
0.070
0.276
0.020
0.074
37-Scallops
0.001 0.000
0.370
0.050
0.018
36-Infauna
38-Epifauna
0.050
0.071
0.066
0.003
0.001 0.001
0.050
0.030 0.503
0.250
0.151
0.201
0.050
0.100
0.116 0.001
0.050
0.331
0.445
0.183
0.071
0.005
0.001
0.001
0.001
0.249
0.110
0.038
0.001
0.106
0.045
0.007
0.120
0.033
0.100
0.041
0.004
0.223
0.102
0.001 0.040
0.431
0.005
0.353
0.150
0.020
0.115
0.001
0.045
0.056
0.214
0.040
0.002
0.001
0.001
0.099
0.346
0.243
0.004
0.010
0.648
0.698
0.000
0.100 0.005
0.000
0.000
0.110
0.110
0.112
0.188
39-Algae 0.050
40-Phytoplankton
0.201
0.125
41-Detritus
Continue… Group num.
20
21
22
23
24
25
26
27
28
29
30
31
32
33
1-Grey seals 2-Harbour seals 3-Cetaceans 4 Seabirds 5 Cod mature 6-Cod juv. 7-Haddock mature 8-Haddock juv
0.014
0.003
0.004
0.002
0.002
9-Whiting mature 10-Whiting juv.
0.007
11-Saithe 12-Gurnards 13- Monkfish
34
35
36
37
38
0.002
14-Flatfish
0.001
0.031
0.015
15- Rays 16-Sharks 17-Large demersals 0.002
18- Benthopelagic fish
0.111
0.001
0.005
19-Mackerel 0.030
20-Horse Mackerel
0.019
21-Blue Whiting
0.020
0.005
22-Other pelagics
0.150
0.034
0.002
23-Herring
0.016
0.050
0.030
0.027
24-Norway pout
0.016
0.070
0.005
0.004 0.001
25-Poor cod
0.001
26-Sandeel
0.010
0.027
0.000
0.002
27-Sprat
0.100
0.007
0.000
0.001
0.001
28-Norway lobster
0.000
0.019 0.004
0.031
30-Edible crab
0.010
0.010
0.010
0.010
0.193
0.122
33 Cephalopod 0.590
0.189
0.001
0.010
0.002
0.084
0.592
0.012 0.140
0.050
0.100
0.005
0.100
0.320
0.097
0.948
0.750
0.199
0.200
0.161
0.003
0.105
0.273
0.051
0.059
0.133
0.020
0.196
0.253
0.001
0.712
35 Small zooplankton
0.215
0.034
0.004
0.001
36-Infauna
0.009
0.136
0.161
0.001
0.983
0.752
0.001
37-Scallops 0.368
0.052
39-Algae
41-Detritus
0.100
0.050
0.300
34-Large zooplankton
40-Phytoplankton
0.002
0.050
31-Velvet crab
38-Epifauna
0.001 0.008
29-Lobster
32-Crustaceans
0.001
0.290
0.289
0.001
0.001
0.020
0.547
0.576
0.139
0.220
0.057
0.010
0.456
0.007 0.136
0.151
0.098
0.030
0.036
0.149 0.010 0.090
0.004
0.100 0.100
0.710
0.800
0.499
0.500
0.378
0.326
0.138
0.170
0.465
0.500
0.175
Supplementary Table S6. Time series: including 28 time-series of relative biomasses (type= 0), 22 time-series of catches (type= 6), 9 time-series of forced catches (type= -6) and 22 of fishing mortality (type= 4) with a total of 1,356 observations Group num.
Grey seals
Harbour seals
Cod mature
Cod mature
Cod mature
Cod juv.
Cod juv.
Cod juv.
Haddock mature
Haddock mature
Haddock mature
Haddock juv.
Haddock juv.
Haddock juv.
Whiting mature
Whiting mature
Whiting mature
Whiting juv.
Whiting juv.
Whiting juv.
Type
0
0
6
4
0
6
4
0
6
4
0
6
4
0
6
4
0
6
4
0
1985
0.014
0.011
0.162
0.545
0.297
0.016
0.061
0.264
0.182
0.323
0.563
0.021
0.050
0.416
0.138
0.354
0.390
0.023
0.059
0.396
1986
0.015
0.102
0.468
0.219
0.007
0.010
0.738
0.168
0.493
0.341
0.015
0.015
0.961
0.092
0.265
0.347
0.009
0.026
0.367
1987
0.016
0.134
0.527
0.255
0.060
0.054
1.104
0.134
0.466
0.287
0.026
0.042
0.621
0.127
0.335
0.379
0.086
0.194
0.445
1988
0.015
0.181
0.528
0.343
0.008
0.023
0.343
0.142
0.402
0.354
0.005
0.026
0.193
0.155
0.423
0.365
0.022
0.208
0.107
1989
0.016
0.143
0.589
0.243
0.032
0.045
0.706
0.095
0.485
0.197
0.009
0.032
0.282
0.090
0.406
0.222
0.032
0.080
0.396
1990
0.017
0.108
0.465
0.232
0.008
0.078
0.100
0.058
0.488
0.118
0.013
0.018
0.758
0.062
0.202
0.308
0.030
0.100
0.302
1991
0.019
0.091
0.531
0.171
0.014
0.042
0.348
0.049
0.476
0.104
0.030
0.031
0.974
0.081
0.312
0.260
0.024
0.086
0.278
1992
0.022
0.075
0.494
0.152
0.024
0.049
0.484
0.092
0.405
0.228
0.018
0.023
0.796
0.084
0.307
0.273
0.055
0.129
0.426
1993
0.022
0.092
0.435
0.212
0.003
0.009
0.338
0.119
0.389
0.306
0.028
0.047
0.602
0.089
0.247
0.359
0.017
0.046
0.365
1994
0.021
0.076
0.405
0.187
0.011
0.027
0.429
0.128
0.329
0.390
0.010
0.014
0.724
0.074
0.236
0.312
0.011
0.042
0.269
1995
0.023
0.082
0.427
0.191
0.005
0.012
0.432
0.107
0.392
0.272
0.031
0.043
0.732
0.092
0.299
0.309
0.015
0.067
0.230
1996
0.024
0.084
0.442
0.190
0.002
0.011
0.227
0.160
0.371
0.431
0.008
0.017
0.463
0.106
0.314
0.339
0.031
0.163
0.189
1997
0.022
0.056
0.437
0.129
0.012
0.016
0.735
0.120
0.362
0.331
0.019
0.039
0.495
0.081
0.307
0.263
0.024
0.114
0.214
1998
0.023
0.054
0.392
0.137
0.003
0.021
0.159
0.121
0.432
0.280
0.012
0.037
0.312
0.076
0.399
0.191
0.050
0.209
0.237
1999
0.021
0.037
0.345
0.108
0.001
0.009
0.154
0.090
0.488
0.184
0.011
0.005
2.115
0.071
0.398
0.178
0.007
0.050
0.144
2000
0.024
0.022
0.292
0.077
0.012
0.026
0.458
0.064
0.537
0.119
0.040
0.015
2.698
0.039
0.297
0.131
0.109
0.537
0.203
2001
0.022
0.021
0.217
0.098
0.001
0.009
0.112
0.133
0.172
0.775
0.009
0.023
0.379
0.055
0.351
0.158
0.006
0.047
0.118
2002
0.021
0.020
0.258
0.078
0.005
0.023
0.202
0.123
0.191
0.644
0.004
0.048
0.081
0.035
0.294
0.117
0.007
0.207
0.036
2003
0.023
0.011
0.179
0.061
0.001
0.009
0.063
0.060
0.144
0.415
0.001
0.011
0.093
0.016
0.224
0.071
0.003
0.049
0.061
2004
0.023
0.005
0.140
0.034
0.001
0.012
0.064
0.056
0.203
0.277
0.003
0.019
0.158
0.015
0.297
0.052
0.012
0.269
0.043
2005
0.023
0.005
0.181
0.025
0.000
0.010
0.049
0.050
0.243
0.205
0.003
0.002
1.333
0.006
0.173
0.037
0.002
0.090
0.027
2006
0.022
0.006
0.313
0.019
0.003
0.026
0.116
0.042
0.303
0.139
0.013
0.016
0.819
0.008
0.217
0.036
0.004
0.237
0.018
2007
0.021
0.021
0.629
0.034
0.001
0.038
0.028
0.052
0.172
0.305
0.003
0.009
0.293
0.006
0.155
0.038
0.001
0.044
0.021
2008
0.023
0.012
0.419
0.030
0.000
0.005
0.026
0.037
0.137
0.269
0.002
0.011
0.194
0.006
0.167
0.038
0.001
0.027
0.021
2009
0.023
0.011
0.461
0.023
0.001
0.022
0.066
0.037
0.182
0.205
0.002
0.002
0.820
0.005
0.100
0.049
0.003
0.166
0.020
2010
0.024
0.011
0.377
0.030
0.001
0.012
0.065
0.030
0.171
0.177
0.007
0.023
0.305
0.005
0.129
0.040
0.006
0.151
0.038
0.019
0.586
0.032
0.001
0.030
0.020
0.040
0.123
0.325
0.001
0.013
0.058
0.004
0.053
0.083
0.001
0.071
0.010
0.014
0.585
0.024
0.001
0.023
0.023
0.035
0.120
0.289
0.000
0.005
0.098
0.005
0.064
0.084
0.004
0.099
0.041
0.012
0.601
0.019
0.002
0.064
0.032
0.037
0.171
0.214
0.002
0.011
0.152
0.006
0.055
0.103
0.005
0.169
0.029
0.011
0.013
2011 2012 2013
0.027 0.013
Continue….. Group num.
Saithe
Saithe
Saithe
Gurnards
Gurnards
Gurnards
Monkfish
Monkfish
Monkfish
Flatfish
Flatfish
Flatfish
Rays
Rays
Rays
Sharks
Sharks
Sharks
Large demersals
Large demersals
Type
4
6
0
4
6
0
4
6
0
4
6
0
4
6
0
4
6
0
4
6
1985
0.450
0.227
0.505
0.020
0.002
0.121
0.378
0.039
0.103
0.115
0.075
0.658
0.354
0.041
0.116
0.505
0.122
0.242
0.263
0.272
0.026
0.002
0.072
0.658
0.030
0.046
0.137
0.064
0.465
0.260
0.035
0.133
0.479
0.082
0.170
0.672
0.233
1986
0.302
1987
0.293
0.276
0.940
0.027
0.002
0.078
0.895
0.038
0.042
0.317
0.079
0.250
0.355
0.038
0.108
0.561
0.089
0.159
0.338
0.218
1988
0.096
0.273
2.855
0.045
0.002
0.051
0.695
0.056
0.081
0.132
0.091
0.693
0.990
0.043
0.043
0.737
0.074
0.100
0.633
0.228
1989
0.529
0.203
0.384
0.041
0.002
0.044
1.479
0.053
0.036
0.389
0.083
0.213
1.983
0.052
0.026
0.629
0.060
0.096
1.096
0.251
1990
0.201
0.162
0.805
0.021
0.002
0.076
0.657
0.052
0.079
0.294
0.080
0.271
0.210
0.037
0.175
0.361
0.051
0.142
0.621
0.193
1991
0.292
0.159
0.546
0.018
0.001
0.067
0.719
0.047
0.066
0.253
0.074
0.294
0.293
0.036
0.122
0.446
0.063
0.142
0.331
0.145
1992
0.105
0.099
0.944
0.007
0.001
0.118
0.439
0.052
0.118
0.131
0.067
0.514
0.069
0.033
0.475
0.524
0.060
0.115
0.098
0.121
1993
0.075
0.132
1.762
0.008
0.001
0.126
0.479
0.053
0.110
0.079
0.062
0.785
0.086
0.029
0.341
0.379
0.062
0.163
0.086
0.121
1994
0.314
0.117
0.372
0.005
0.001
0.133
0.298
0.051
0.170
0.086
0.060
0.698
0.075
0.026
0.343
0.305
0.053
0.173
0.092
0.112
1995
0.327
0.098
0.298
0.004
0.001
0.207
0.304
0.061
0.200
0.073
0.068
0.922
0.079
0.036
0.454
0.431
0.049
0.114
0.128
0.160
1996
0.077
0.086
1.120
0.004
0.001
0.144
0.322
0.061
0.189
0.082
0.060
0.730
0.221
0.044
0.199
0.413
0.042
0.101
0.127
0.128
1997
0.286
0.075
0.263
0.012
0.001
0.049
0.485
0.050
0.104
0.134
0.055
0.408
0.173
0.035
0.200
0.293
0.031
0.106
0.080
0.116
1998
0.023
0.066
2.945
0.005
0.001
0.137
0.217
0.042
0.195
0.044
0.048
1.084
0.115
0.030
0.256
0.112
0.024
0.211
0.052
0.141
1999
0.016
0.028
1.813
0.001
0.000
0.255
0.297
0.040
0.134
0.036
0.040
1.116
0.055
0.023
0.422
0.079
0.021
0.271
0.079
0.138
2000
0.114
0.060
0.528
0.001
0.000
0.390
0.237
0.030
0.127
0.028
0.034
1.183
0.055
0.023
0.427
0.408
0.055
0.136
0.013
0.164
2001
0.041
0.078
1.923
0.004
0.001
0.157
0.294
0.024
0.083
0.034
0.037
1.075
0.088
0.020
0.226
0.322
0.054
0.169
0.010
0.105
2002
0.031
0.051
1.628
0.003
0.001
0.285
0.129
0.021
0.164
0.019
0.030
1.602
0.034
0.020
0.589
0.108
0.035
0.322
0.011
0.094
2003
0.029
0.140
4.875
0.002
0.001
0.269
0.108
0.023
0.217
0.059
0.071
1.194
0.046
0.023
0.489
0.148
0.032
0.215
0.015
0.162
2004
0.032
0.052
1.600
0.001
0.000
0.376
0.083
0.023
0.278
0.066
0.050
0.755
0.051
0.020
0.387
0.160
0.029
0.180
0.012
0.128
2005
0.123
0.154
1.251
0.002
0.000
0.214
0.221
0.028
0.129
0.025
0.017
0.667
0.033
0.015
0.453
0.072
0.017
0.241
0.008
0.166
2006
0.103
0.171
1.663
0.001
0.000
0.355
0.111
0.026
0.238
0.015
0.011
0.758
0.017
0.007
0.401
0.026
0.010
0.380
0.005
0.135
2007
0.034
0.094
2.802
0.001
0.000
0.468
0.142
0.031
0.221
0.024
0.028
1.180
0.010
0.007
0.655
0.018
0.007
0.375
0.007
0.143
2008
0.013
0.127
6.603
0.001
0.000
0.404
0.267
0.032
0.119
0.006
0.005
0.837
0.011
0.006
0.543
0.009
0.003
0.296
0.010
0.144
2009
0.052
0.079
1.514
0.004
0.002
0.489
0.400
0.028
0.069
0.005
0.006
1.183
0.003
0.002
0.737
0.012
0.004
0.347
0.012
0.183
2010
0.034
0.089
2.594
0.003
0.002
0.598
0.238
0.029
0.122
0.009
0.008
0.900
0.005
0.004
0.713
0.002
0.001
0.548
0.018
0.187
2011
0.034
0.127
3.749
0.005
0.002
0.276
0.294
0.025
0.084
0.010
0.007
0.650
0.012
0.004
0.345
0.005
0.001
0.221
0.036
0.249
2012
0.107
0.167
1.552
0.012
0.002
0.192
0.168
0.026
0.153
0.022
0.020
0.895
0.010
0.004
0.415
0.009
0.003
0.301
0.029
0.223
2013
0.074
0.143
1.930
0.010
0.002
0.188
0.144
0.023
0.160
0.017
0.014
0.813
0.015
0.004
0.282
0.041
0.008
0.189
0.042
0.235
Continue….. Group num.
Large demersals
Benthopelagic fish
Benthopelagic fish
Benthopelagic fish
Mack erel
Mackerel
Mackerel
Horse Mackerel
Horse Mackerel
Horse Mackerel
Blue Whiting
Blue Whiting
Blue Whiting
Herring
Herring
Herring
Norway pout
Norway pout
Norway pout
Poor cod
Type
0
4
6
0
4
6
0
4
6
0
4
6
0
4
6
0
4
6
0
0
1985
1.034
0.008
0.005
0.585
0.118
1.017
8.638
0.045
0.300
6.621
0.443
0.876
1.978
0.060
0.358
5.943
0.008
0.010
1.290
0.071
1986
0.347
0.415
0.021
0.051
0.126
0.997
7.926
0.027
0.185
6.959
0.659
1.212
1.839
0.119
0.674
5.676
0.050
0.053
1.071
0.027
1987
0.647
0.036
0.009
0.254
0.142
1.085
7.623
0.047
0.320
6.860
0.396
0.622
1.570
0.050
0.392
7.899
0.195
0.348
1.780
0.025
1988
0.359
0.898
0.073
0.081
0.144
1.127
7.832
0.062
0.417
6.728
0.356
0.481
1.350
0.053
0.331
6.221
0.044
0.061
1.396
0.095
1989
0.229
8.707
0.188
0.022
0.133
0.970
7.317
0.049
0.317
6.406
0.464
0.630
1.360
0.103
0.581
5.629
0.354
0.256
0.724
0.018
1990
0.310
1.281
0.063
0.049
0.144
1.037
7.201
0.034
0.189
5.575
0.438
0.600
1.370
0.165
0.802
4.846
0.016
0.030
1.890
0.038
1991
0.438
0.244
0.044
0.180
0.156
1.119
7.151
0.059
0.313
5.274
0.187
0.334
1.783
0.160
0.620
3.874
0.028
0.040
1.415
0.095
1992
1.229
0.048
0.051
1.079
0.201
1.260
6.266
0.087
0.372
4.286
0.251
0.522
2.076
0.169
0.554
3.279
0.017
0.047
2.760
0.285
1993
1.402
0.030
0.011
0.365
0.238
1.365
5.733
0.120
0.489
4.072
0.289
0.579
2.004
0.186
0.621
3.335
0.018
0.067
3.681
0.211
1994
1.215
0.695
0.071
0.102
0.271
1.356
4.999
0.171
0.632
3.693
0.340
0.645
1.901
0.170
0.530
3.114
0.028
0.129
4.552
0.134
1995
1.254
0.143
0.046
0.322
0.254
1.252
4.924
0.238
0.759
3.187
0.361
0.684
1.897
0.202
0.522
2.584
0.051
0.222
4.373
0.089
1996
1.007
0.077
0.075
0.975
0.204
0.933
4.569
0.240
0.739
3.080
0.360
0.765
2.128
0.175
0.544
3.110
0.012
0.057
4.810
0.101
1997
1.452
0.644
0.068
0.106
0.204
0.949
4.647
0.130
0.365
2.807
0.343
1.079
3.143
0.176
0.570
3.242
0.021
0.087
4.078
0.112
1998
2.728
0.282
0.057
0.202
0.244
1.103
4.528
0.148
0.319
2.148
0.392
1.566
3.999
0.233
0.657
2.819
0.006
0.065
10.729
0.365
1999
1.748
0.217
0.079
0.363
0.206
1.060
5.136
0.189
0.367
1.940
0.278
1.179
4.239
0.225
0.508
2.256
0.010
0.042
4.249
0.302
2000
12.290
0.156
0.109
0.699
0.241
1.223
5.069
0.107
0.188
1.750
0.240
1.021
4.251
0.125
0.347
2.781
0.003
0.018
6.191
0.238
2001
10.512
0.222
0.132
0.595
0.265
1.221
4.610
0.152
0.224
1.474
0.234
1.223
5.223
0.120
0.358
2.995
0.005
0.029
6.106
0.296
2002
8.256
0.025
0.108
4.368
0.265
1.277
4.827
0.074
0.129
1.736
0.120
0.696
5.802
0.135
0.462
3.421
0.006
0.044
6.883
0.274
2003
10.566
0.023
0.079
3.375
0.208
1.125
5.410
0.085
0.211
2.482
0.086
0.603
6.988
0.136
0.407
2.997
0.018
0.059
3.283
0.382
2004
10.920
0.005
0.050
10.331
0.201
1.094
5.437
0.070
0.199
2.855
0.173
1.069
6.179
0.145
0.357
2.466
0.008
0.021
2.751
0.460
2005
20.861
0.039
0.054
1.382
0.179
0.910
5.090
0.068
0.200
2.950
0.248
1.247
5.019
0.124
0.276
2.227
0.000
0.000
0.833
0.455
2006
27.085
0.003
0.010
3.166
0.143
0.797
5.591
0.057
0.143
2.518
0.347
1.611
4.642
0.189
0.423
2.237
0.000
0.000
1.004
0.554
2007
19.285
0.003
0.043
12.212
0.168
1.011
6.033
0.110
0.239
2.180
0.386
1.333
3.456
0.229
0.431
1.879
0.000
0.000
3.588
1.154
2008
13.873
0.002
0.028
16.718
0.139
1.003
7.208
0.102
0.235
2.304
0.496
1.298
2.618
0.158
0.268
1.691
0.000
0.000
1.950
0.712
2009
15.331
0.001
0.001
2.040
0.169
1.325
7.847
0.066
0.162
2.453
0.427
0.885
2.071
0.159
0.272
1.708
0.000
0.000
5.408
0.890
2010
10.205
0.009
0.027
3.108
0.125
1.053
8.416
0.094
0.206
2.179
0.342
0.805
2.354
0.151
0.273
1.802
0.000
0.000
10.729
0.408
2011
6.869
0.010
0.015
1.478
0.233
2.210
9.480
0.183
0.357
1.950
0.042
0.124
2.951
0.141
0.224
1.592
0.000
0.000
7.758
0.197
2012
7.659
0.006
0.022
3.722
0.124
1.132
9.108
0.255
0.409
1.604
0.129
0.451
3.498
0.153
0.228
1.484
0.000
0.000
3.467
0.426
2013
5.616
0.009
0.019
2.038
0.126
1.157
9.209
0.303
0.393
1.299
0.110
0.444
4.024
0.215
0.244
1.137
0.000
0.000
2.149
0.277
Continue…. Group num.
Sandeel
Sandeel
Sandeel
Sandeel
Sprat
Sprat
Sprat
Norway lobster
Norway lobster
Norway lobster
Norway lobster
Lobster
Edible crab
Velvet crab
Crustaceans
Cephalopod
Large zooplankton
Small zooplankton
Scallops
Epifauna
Phytoplankton
Type
4
6
0
-6
4
6
0
4
6
0
-6
-6
-6
-6
-6
-6
0
0
-6
-6
0
1985
0.129
0.169
1.314
0.100
0.032
0.322
0.114
0.006
0.044
0.004
0.000
0.000
0.072
0.995
0.060
0.000
0.242
1986
0.102
0.222
2.174
0.017
0.008
0.468
0.103
0.005
0.041
0.006
0.000
0.000
0.072
0.893
0.053
0.000
0.268
1987
0.041
0.132
3.213
0.034
0.008
0.226
0.103
0.006
0.071
0.011
0.000
0.001
0.089
0.789
0.063
0.001
0.273
1988
0.120
0.222
1.853
0.021
0.040
1.930
0.116
0.007
0.098
0.012
0.000
0.000
0.043
0.665
0.045
0.000
0.268
1989
0.130
0.171
1.309
0.060
0.012
0.197
0.100
0.008
0.085
0.011
0.002
0.003
0.066
0.711
0.057
0.000
0.296
1990
0.094
0.150
1.599
0.090
0.015
0.162
0.092
0.007
0.071
0.013
0.002
0.002
0.080
0.739
0.039
0.000
0.251
1991
0.054
0.078
1.443
0.052
0.015
0.296
0.095
0.007
0.089
0.014
0.002
0.001
0.072
0.879
0.038
0.000
0.253
1992
0.011
0.045
4.137
0.090
0.018
0.196
0.099
0.008
0.092
0.019
0.004
0.001
0.045
0.759
0.045
0.001
0.257
1993
0.014
0.057
4.178
0.103
0.061
0.042
0.691
0.006
0.084
0.018
0.005
0.001
0.060
0.865
0.067
0.003
0.251
1994
0.097
0.072
0.014
0.194
0.344
0.103
0.300
0.005
0.106
0.018
0.005
0.002
0.076
0.881
0.070
0.003
0.268
1995
0.065
0.036
0.040
1.110
0.354
0.117
0.331
0.006
0.102
0.027
0.003
0.003
0.115
0.844
0.062
0.001
0.286
1996
0.121
0.019
0.024
1.242
0.162
0.101
0.625
0.004
0.080
0.008
0.002
0.002
0.052
0.690
0.063
0.006
0.288
1997
0.115
0.035
0.063
1.811
0.207
0.102
0.494
0.006
0.109
0.018
0.002
0.002
0.080
0.673
0.077
0.006
0.298
1998
0.048
0.116
0.033
0.283
0.115
0.102
0.885
0.006
0.110
0.015
0.003
0.001
0.082
0.680
0.090
0.001
0.315
1999
0.024
0.044
0.100
2.254
0.138
0.107
0.770
0.004
0.107
0.014
0.002
0.000
0.111
0.831
0.058
0.003
0.288
2000
0.052
0.029
0.070
2.419
0.081
0.102
1.264
0.003
0.116
0.009
0.001
0.000
0.107
0.805
0.109
0.014
0.329
2001
0.003
0.005
0.013
2.742
0.087
0.106
1.220
0.003
0.142
0.012
0.001
0.000
0.066
0.855
0.124
0.005
0.319
2002
0.006
0.081
0.036
0.448
0.075
0.100
1.333
0.003
0.140
0.012
0.001
0.000
0.117
0.955
0.196
0.003
0.331
2003
0.000
0.055
0.041
0.748
0.073
0.111
1.517
0.003
0.144
0.008
0.004
0.001
0.084
0.911
0.121
0.007
0.311
2004
0.005
0.003
0.014
4.920
0.065
0.109
1.678
0.005
0.170
0.012
0.003
0.001
0.090
0.875
0.112
0.006
0.268
2005
0.000
0.027
0.013
0.464
0.069
0.107
1.549
0.003
0.098
0.004
0.002
0.000
0.090
0.815
0.068
0.001
0.295
2006
0.000
0.008
0.005
0.645
0.098
0.138
1.413
0.007
0.168
0.001
0.001
0.001
0.094
0.796
0.085
0.005
0.220
2007
0.000
0.005
0.003
0.603
0.197
0.179
0.908
0.007
0.242
0.000
0.002
0.001
0.071
0.748
0.054
0.003
0.280
2008
0.000
0.016
0.008
0.506
0.131
0.156
1.192
0.007
0.142
0.019
0.002
0.003
0.083
0.744
0.087
0.002
0.223
2009
0.000
0.004
0.002
0.533
0.107
0.131
1.224
0.006
0.129
0.019
0.001
0.003
0.065
0.707
0.097
0.002
0.321
2010
0.000
0.015
0.013
0.879
0.081
0.117
1.446
0.007
0.155
0.019
0.003
0.004
0.120
0.912
0.113
0.002
0.271
2011
0.000
0.025
0.016
0.619
0.090
0.123
1.363
0.006
0.161
0.015
0.002
0.001
0.083
0.820
0.140
0.003
0.322
2012
0.000
0.271
0.032
0.117
0.198
0.141
0.715
0.006
0.139
0.016
0.004
0.001
0.073
0.828
0.198
0.003
0.285
2013
0.000
0.010
0.022
2.264
0.079
0.121
1.538
0.004
0.135
0.011
0.003
0.001
0.103
0.778
0.109
0.003
0.294
Supplementary Table S7. Fitted vulnerabilities. The stepwise fitting procedure estimated 33 vulnerabilities of prey to these predators: values greater than 2 showed sensitive predator topdown controls on their preys whilst values between 1 and 2 indicated bottom-up controlled tropic relationships. Group num. 1-Grey seals 2-Harbour seals 3-Cetaceans 4 Seabirds 5 Cod mature 6-Cod juv. 7-Haddock mature 8-Haddock juv 9-Whiting mature 10-Whiting juv. 11-Saithe 12-Gurnards 13- Monkfish 14-Flatfish 15- Rays 16-Sharks 17-Large demersals 18- Benthopelagic fish 19-Mackerel
vulnerability of prey to predator 2.3 2 >1,000 1 2.8 1.11 1 >1,000 2.6 >1,000 12.3 2 1 1.48 1 1.23 1 1.25 1
Group num. 20-Horse Mackerel 21-Blue Whiting 22-Other pelagics 23-Herring 24-Norway pout 25-Poor cod 26-Sandeel 27-Sprat 28-Norway lobster 29-Lobster 30-Edible crab 31-Velvet crab 32-Crustaceans 33 Cephalopod 34-Large zooplankton 35 Small zooplankton 36-Infauna 37-Scallops 38-Epifauna
vulnerability of prey to predator 1.05 1.88 1 1.84 2 1.7 1 16.03 1.52 2 1 1 1 1 1 1 2 1 >1,000
Supplementary Table S8. Maximum and minimum temperatures and preference quintiles of species within each functional group. Averaged optimum temperatures, and left-right standard deviations (SD) for each functional group with data sources are also shown. Group num.
Minimum temperature
10th percentile
90th percentile
Maximum temperature
Optimum temperature
Optimum EwE group temperature (weighted by composition)
SD left
SD right
Data source
2
5
10
15
7.5
7.5
2
2.5
Aquamaps26
Phoca vitulina
-1.75
5
10
15
7.5
7.5
3.2
2.5
Aquamaps26
Minke whale
Balaenoptera acutorostrata
-2
-1.61
15.67
29.31
7.03
Harbour Porpoises
Phocoena phocoena
0
5
15
20
10
common dolphins
Delphinus delphis
5
12
27.42
31.62
19.71
13
3.4
3.5
Aquamaps26
common dolphins
Tursiops truncatus
5
12
28.16
30
20.08
common dolphins
Lagenorhynchus albirostris
-0.49
3.22
10
15
6.61
little auks
Alle alle
-2
-1.59
10.67
22.34
4.54
petrels
Calonectris diomedea
6.34
10.12
26.05
30.25
18.085
petrels
Oceanodroma leucorhoa
-0.6
3.98
27.23
31.43
15.605
petrels
Puffinus puffinus
3.27
8.64
21.19
27.47
14.915
pelecaniformes
Phalacrocorax carbo
-1.82
6.14
19.5
28.97
12.82
pelecaniformes
Phalacrocorax aristotelis
3.63
7.35
17.98
21.49
12.665 12.9
4.2
4.7
Aquamaps26, SeaLifeBase27
gulls
Larus atricilla
-1.59
10.67
26.72
30.92
18.695
gulls
Larus argentatus
-1.76
2.54
23.84
28.47
13.19
guillemot
Uria aalge
-1.73
2.06
12.31
21.1
7.185
razorbill
Alca torda
-1.61
3.54
12.66
21.93
8.1
Atlantic puffin
Fratercula artica
-1.79
0.52
12.54
21.93
6.53
Manx shearwater
Puffinus puffinus
-0.61
6.14
19.39
28.38
12.765
Gadus morhua
-1.66
2.54
12.29
15
7.415
6.3
2.5
2.35
EwE groups
Species common names
Species
1
Grey seals
Grey seals
Halichoerus grypus
2
Harbour seals
Harbour seals
3
4
Cetaceans
Seabirds
5
Cod
7
Haddock
Haddock
Melanogrammus aeglefinus
0.17
4.69
12.01
22.83
8.35
7
2.3
4
9
Whiting
Whiting
Merlangius merlangus
6.14
9.31
12.5
18.6
10.905
9.5
1.2
3
Pollock
Pollachius pollachius
6.33
9.6
12.53
19.3
11.065
11
Saithe
9
3
4.3
Saithe
Pollachius virens
-0.4
5.41
12.5
22.1
8.955
FishBase28,optimum temperature29, tolerances26 and adjustments for juveniles30 FishBase28,Aquamaps26and adjustment for juveniles30 FishBase28,Aquamaps26and adjustment for juveniles30 Aquamaps26
Continue…. Group num.
12
13
14
EwE groups
Gurnard
Monkfish
Flatfish
Minimum temperature
10th percentile
90th percentile
Maximum temperature
Optimum temperature
Species common names
Species
Grey gurnard
Eutrigla gurnardus
5.77
9.65
16.04
22.07
12.845
Piper gurnard
Trigla lyra
3.82
13.98
27.89
32.09
20.935
Red gurnard
Aspitrigla cuculus
6.03
9.77
18.7
22.5
14.235
Streaked gurnard
Trigloporus lastoviza
6.7
11.19
27.66
31.86
19.425
Tub gurnard
Trigla lucerna
5.86
9.67
18.95
27.39
14.31
Anglerfish
Lophius piscatorius
2.47
9.41
13.43
16.28
11.42
Black bellied angler
Lophius budegassa
2.47
9.41
13.43
16.28
11.42
Atlantic halibut
Hippoglossus hippoglossus
-0.99
0
9.92
16.6
4.96
Atlantic sole
Pegusa lascaris
10.12
11.45
27.69
31.89
19.57
Brill
Scophthalmus rhombus
1.31
9.3
19.1
25.71
14.2
Common European sole
Solea vulgaris
6.965
9.76
18.98
25
14.37
Common topknot
Zeugopterus punctatus
6.95
9.72
12.48
17.4
11.1
Dab
Limanda limanda
2.98
9.04
12.49
15.62
10.765
European flounder
Platichthys flesus
0
8.27
12.48
23.33
10.375
European plaice
Pleuronectes platessa
-1.77
8.8
13.4
18
11.1
Fourspot megrim
Lepidorhombus boscii
4.3
12.07
19.23
26.27
15.65
Grohmann's scaldfish
Arnoglossus thori
14.25
18.27
25.09
29.29
21.68
Imperial scaldfish
Arnoglossus imperialis
6.17
12.81
27.92
28.42
20.365
Lemon sole
Microstomus kitt
2.03
9.62
12.83
15.73
11.225
Long rough dab
Hippoglossoides platessoides
-1.66
1.08
11.3
18.2
6.19
Megrim
Lepidorhombus whiffiagonis
5.28
9.65
14.92
21.17
12.285
Norwegian topknot
Phrynorhombus norvegicus
5.91
9.68
13.26
15.88
11.47
Scaldfish
Arnoglossus laterna
2.27
9.81
19.66
28.06
14.735
Solenette
Buglossidium luteum
3.5
8.4
18.27
26.4
13.335
Thickback sole
Microchirus variegatus
2.68
11.45
19.84
27.88
15.645
Turbot Witch flounder
Psetta maxima Glyptocephalus cynoglossus
6.7 -1.34
8.93 1.91
12.49 11.43
21.91 19.19
10.71 6.67
Optimum EwE group temperature (weighted by composition)
SD left
SD right
Data source
14.1
3.1
2.6
Aquamaps26
11.42
3.2
1.5
Aquamaps26
12.3
2.6
3
Aquamaps26
Continue…. Group num.
15
EwE groups
Rays and skates
Minimum temperature
10th percentile
90th percentile
Maximum temperature
Optimum temperature
Raja brachyura
1.24
10.95
19.96
29.2
15.455
Blue skate
Dipturus batis
2.52
7.08
13.07
16.98
10.075
Bottlenosed skate
Rostroraja alba
-1.985
3.24
21.71
25.73
12.475
Cuckoo ray
Leucoraja circularis
4.69
10.26
19.19
23.97
14.725
Cuckoo ray
Raja naevus
5.28
9.77
16.75
22.2
13.26
Homelyn Ray
Raja montagui
1.38
12
20.64
29.62
16.32
Shagreen ray
Leucoraja fullonica
4.035
9.63
18.5
27.22
14.065
Amblyraja radiata Raja clavata
-1.3
-1
5
14
2
6.45
10.71
27.3
31.5
19.005
Blackmouth catshark
Galeus melastomus
-1.03
9.8
20.62
24.51
15.21
Nursehound
Scyliorhinus stellaris
-0.73
10.71
21.14
25.5
15.925
Picked dogfish
Squalus acanthias
-1.66
7.42
18.94
28.9
13.18
Small-spotted catshark
Scyliorhinus canicula
-1.67
10.61
27.56
31.76
19.085
Smooth-hound
Mustelus mustelus
9.68
10.51
27.66
31.86
19.085
Starry smooth-hound Tope
Mustelus asterias Galeorhinus galeus
4.69
9.75
19.95
22.5
14.85
3
5.5
15
26
10.25
Blue-Mouth
Helicolenus dactylopterus
0.55
9.83
27.09
31.29
18.46
Sea trout
Salmo trutta
1.18
6.9
14
21.17
10.45
Salmo salar
-0.82
2.17
11.57
20.23
6.87
Catfish
Anarhichas lupus
-0.77
1.08
9.91
17.96
5.495
Common eel
Anguilla anguilla
3.8
8.98
23.34
27.5
16.16
Conger eel
Conger conger
2.02
2.52
13.3
24.935
7.91
Cusk
Brosme brosme
0
2.74
9
10
5.87
Greater Forkbeard Hake
Phycis blennoides Merluccius merluccius
0.61
9.72
19.33
29.13
14.525
5.01
11.07
22.07
28.93
16.57
Zeus faber
-1.74
9.94
26.32
30.52
18.13
Species common names
Species
Blonde ray
Starry skate Thornback Ray
16
17
Sharks
Large demersal
John Dory
Optimum EwE group temperature (weighted by composition)
SD left
SD right
Data source
12
3.2
3.6
Aquamaps26
16
5.5
3.6
Aquamaps26
14
3.2
3.1
Aquamaps26
Continue... Group num.
17
18
EwE groups
Large demersal
Benthopelagic fish
Minimum temperature
10th percentile
90th percentile
Maximum temperature
Optimum temperature
Species common names
Species
Ling
Molva molva
0.55
9.62
12.9
19.35
11.26
Lumpsucker
Cyclopterus lumpus
-1.66
2.47
10.87
22.95
6.67
Norway haddock
Sebastes viviparus
1.61
9.19
10.68
12.01
9.935
Ocean perch
Sebastes marinus (norvegicus?)
-1.66
0.12
9.68
18.34
4.9
Red bandfish
Cepola rubescens (macrophthalma)
3.38
12.01
21.14
28.54
16.575
Red sea bream
Pagellus bogaraveo
6.1
10.34
20.2
27.11
15.27
Alaskan Stickleback
Gasterosteus aculeatus
0.4
2.46
12.07
14.9
7.265
Atlantic argentine
Argentina silus
-1.66
5.41
12.9
16.07
9.155
Atlantic warbonnet
Chirolophis ascanii
0.67
7.95
12.17
13.05
10.06
Ballan wrasse
Labrus bergylta
6.7
9.68
12.9
21.25
11.29
Bib
Trisopterus luscus
6.85
9.77
14.78
20.44
12.275
Boarfish
Capros aper
1.72
10.53
20.09
28.92
15.31
Bridled triggerfish
Balistes carolinensis
-0.74
2.29
24.34
28.02
13.315
Bull rout
Myoxocephalus scorpius
-1.78
-0.38
10.92
19.16
5.27
Butterfish
Pholis gunnellus
-1.66
6.05
12.01
15.33
9.03
Common dragonet
Callionymus lyra
6.14
16
20
24.77
18
Common goby
Pomatoschistus microps
6.34
9.05
15.78
19.15
12.415
Crystal goby
Crystallogobius linearis
5.91
9.5
19.06
20.33
14.28
Cuckoo wrasse
Labrus mixtus
5.91
9.83
19.1
24.73
14.465
Echiodon drummondii
Echiodon drummondii
5.99
9.61
12.6
16.07
11.105
Fivebearded rockling
Ciliata mustela
1.05
8
11.67
13.94
9.835
Fourbeard rockling
Enchelyopus cimbrius
-1.66
4.6
13.18
26.67
8.89
Freckled goby
Pomatoschistus minutus
5.91
9.12
14.01
21.17
11.565
Fries' goby
Lesueurigobius friesii
0.08
9.68
19.03
28.16
14.355
Goldsinny wrasse
Ctenolabrus rupestris
6.67
9.65
15.47
22.07
12.56
Great Pipefish
Syngnathus acus
8
11
24.21
27
17.605
Optimum EwE group temperature (weighted by composition)
SD left
SD right
Data source
14
3.2
3.1
Aquamaps26
15
5
2
Aquamaps26
Continue…. Group num.
18
EwE groups
Benthopelagic fish
19
Mackerel
20
Horse mackerel
21
Blue Whiting
Minimum temperature
10th percentile
90th percentile
Maximum temperature
Optimum temperature
Optimum EwE group temperature (weighted by composition)
SD left
SD right
Data source
15
5
2
Aquamaps26
Species common names
Species
Hook-nose
Agonus cataphractus
2.99
9.3
12.13
14.92
10.715
Lesse forkbeard
Raniceps raninus
7.43
9.5
12.38
14.92
10.94
Lesser weever
Echiichthys vipera
7.43
10.04
17.64
22.07
13.84
Longspine snipefish
Macroramphosus scolopax
0.67
13.78
24.99
29.69
19.385
Longspined sea scorpion
Taurulus bubalis
5.91
8.92
12.5
19.35
10.71
Moustache sculpin
Triglops murrayi
-1.66
0.96
9.89
16.15
5.425
Northern rockling
Ciliata septentrionalis
-0.73
3.03
11.43
18.575
7.23
Norway bullhead
Taurulus lilljeborgi
5.91
8.92
12.5
19.35
10.71
Ocean Pipefish
Entelurus aequoraeus
7.04
9.72
13.97
18.7
11.845
Red mullet
Mullus surmuletus
1.24
9.72
19.57
24.63
14.645
Reticulated dragonet
Callionymus reticulatus
7.8
9.77
12.48
19.26
11.125
Silver smelt
Argentina sphyraena
4.51
9.63
18.43
21.21
14.03
Silvery pout
Gadiculus argenteus
-0.945
9.62
19.35
20.18
14.485
Snake blenny
Lumpenus lumpretaeformis
-1.74
0.61
9.5
10.9
5.055
Spotted dragonet
Callionymus maculatus
5.52
9.65
16.07
22.07
12.86
Striped seasnail
Liparis liparis
-1.66
6.6
11.92
14.97
9.26
Threebearded rockling
Gaidropsarus vulgaris
2.52
4.86
13.19
17.7
9.025
Tompot blenny
Blennius gattorugine
3.5
10.67
18.95
24.7
14.81
True gobies
Gobiidae(Pomatoschistus microps)
6.34
9.05
15.78
19.15
12.415
Viviporous blenny
Zoarces viviparus
5.19
7.31
10.79
13.09
9.05
Atlantic mackerel
Scomber scombrus
3
7.5
18.38
27.15
12.94
12.94
3.2
4.5
Aquamaps26
Horse mackerel
Trachurus trachurus
3.93
9.65
19.25
27.38
14.45
14.45
3
4
Aquamaps26
Blue whiting
Micromesistius poutassou
0.61
8.24
19.03
28.37
13.635
13.6
4.3
4.5
Aquamaps26
Continue... Group num.
22
EwE groups
Other pelagic
23
Herring
24
Norway pout
25
Poor cod
26
Sandeel
Optimum EwE group temperature (weighted by composition)
SD left
SD right
Data source
15
4
4
Aquamaps26
4.62
4.62
1.8
5
Aquamaps26
13.72
11.045
11
4
1
Aquamaps26
16.04
22.07
12.845
12.85
2.3
3
Aquamaps26
13.18
15.18
11.685
9.01
12
17.69
10.505
11
2.5
1.3
Aquamaps26
9.44
11.33
12.5
10.385
7.56
9.76
12.81
16.28
11.285
3.185
7.78
18.27
27.89
13.025
13
3.2
4.5
Aquamaps26
5.35
9.68
18.22
21.21
13.95
13.95
3
2.4
SeaLifeBase27
Palinurus elephas
-0.29
10.06
19.33
28.95
14.695
14.7
6
6
SeaLifeBase27
Minimum temperature
10th percentile
90th percentile
Maximum temperature
Optimum temperature
Alosa alosa
3.81
9.68
18.51
21.94
14.095
European anchovy
Engraulis encrasicolus
4.13
11.57
27.89
32.09
19.73
Pearlside
Maurolicus muelleri
-1.26
9.1
20.63
28.33
14.865
True sardine Twaite shad
Sardina pilchardus Alosa fallax
2.53
12
26.92
27.62
19.46
2.27
9.3
18.33
27.76
13.815
Herring
Clupea harengus
-1.34
-0.1
9.34
24.7
Norway pout
Trisopterus esmarkii
-1.66
9.57
12.52
Poor Cod
Trisopterus minutus
5.84
9.65
Corbin's sand eel
Hyperoplus immaculatus
8.09
10.19
Greater sand eel
Hyperoplus lanceolatus
6.68
Sand eel Smoothed sandeel
Ammodytes marinus Gymnammodytes semisquamatus
-1.66
Sprat
Sprattus sprattus
Nephrops
Nephrops norvegicus
Lobster
Species common names
Species
Alice shad
27
Sprat
28
Nephrops
29
Lobster
30
Edible crab
Edible crab
Cancer pagurus
7.04
9.75
12.81
20.15
11.28
11.28
1.5
2.9
SeaLifeBase27
31
Velvet crab
Velvet crab
Necora puber
4.06
11
19.12
20.15
15.06
15
2.8
1.8
SeaLifeBase27
Blue crab
Callinectes sapidus
0.67
12.52
27.56
31.76
20.04
Common prawn
Palaemon serratus
8.11
9.89
17.56
27.59
13.725
Common shrimp
Crangon crangon
6.19
9.65
13.4
22.07
11.525
Craylets, squat lobsters
Munida gregaria
6.38
9.6
12.83
16.74
11.215
Deep-sea red crab
Chaceon affinis
5.22
8.79
23.89
29.01
16.34
13.5
3.5
3.4
SeaLifeBase27
Green crab
Carcinus maenas
7.15
9.65
12.5
22.5
11.075
Pandalus montagui Maja squinado
6.86
9.74
12.83
14.86
11.285
1.99
10.71
23.89
28.01
17.3
Portunus pelagicus
12.24
17.37
28.6
32.8
22.985
32
Crustaceans
Northern prawn Spinous spider crab Portunus swimcrabs nei
Continue... Group num.
33
34
35
EwE groups
Cephalopod
Large zooplankton
Small zooplankton
36
Infauna
37
Scallops
Minimum temperature
10th percentile
90th percentile
Maximum temperature
Optimum temperature
Illex coindetii
0.67
12.37
27.67
31.87
20.02
Common cuttlefish
Sepia officinalis
0.41
10.51
20.98
22.5
15.745
Common octopus
Octopus vulgaris
0.67
11.55
27.96
32.16
19.755
Common squids
Alloteuthis subulata
9.17
11.66
20.71
25.46
16.185
Cuttlefish,bobtail squids
Sepiola atlantica
5.91
9.65
21.27
28.5
15.46
European flying squid
Todarodes sagittatus
2.39
9.6
21.83
24.02
15.715
Inshore squids
Doryteuthis (Loligo) ocula
8.5
9.68
28.5
30
19.09
Northern shortfin squid
Illex illecebrosus
0.55
4.69
21.1
26.31
12.895
Jellyfish
Aurelia aurita
-1.85
7.08
26.02
30.22
16.55
Jellyfish
Cyanea lamarckii
-
-
-
-
-
Jellyfish
Cyanea capillata
-
-
-
-
-
Hyperiid
Themisto spp
-
-
-
-
-
Hyperiid
Phronima spp
-
-
-
-
-
Chaetognaths
Sagitta spp
-
-
-
-
-
Calanoida
Calanus finmarchicus
-
-
-
-
-
Calanoida
Calannus helgolandicus
-
-
-
-
-
Calanoida meroplankton and tunicates < 5 mm
Oithona similes
-
-
-
-
-
-
-
-
-
-
Sipunculida
Golfingia sp
-
-
-
-
-
Bivalve
Mysella bidentata
-
-
-
-
-
Bivalve
Lucinoma borealis
0.67
2.39
25.33
29.53
13.86
Bivalve
Hiatella arctica
-1.79
5.91
23.28
28.68
14.595
Aequipecten opercularis
1.15
9.76
19.15
25.71
14.455
Pecten maximus
7.35
9.83
14.03
20.35
11.93
Species common names
Species
Broadtail shortfin squid
Optimum EwE group temperature (weighted by composition)
SD left
SD right
Data source
14.9
6
5
Aquamaps26
12.5
6
6
Aquamaps26for Aurelia aurita
12.5
6
6
-
14
5
5
SeaLifeBase27
11.4
2.3
2.6
Aquamaps26
Continue... Group num.
EwE groups
Species common names
10th percentile
90th percentile
Maximum temperature
Optimum temperature
Bittium reticulatum
0.33
9.72
19.34
28.65
14.53
Gastropod
Gibbula cineraria
2.43
10.31
18.95
24.59
14.63
Porcellana longicornis (used Liocarcinus depurator)
9.5
10.95
16.5
20.15
13.725
-
-
-
-
-
Idotea spp.
8.45
9.62
12.39
13.41
11.005
Tricolia pullus
9.19
9.98
12.01
13.15
10.995
3.04
3.98
12.38
15.13
8.18
5.55
8.97
18.22
22.24
13.595
7.75
9.77
12.38
13.87
11.075
-
-
-
-
-
9.62
10.67
14.02
19.26
12.345
Laminaria saccharina
-1.5283333
0.110234
11.65892
15.72809262
5.8847
Laminaria digitata
-0.58249999
1.105254
11.2745
12.80916638
6.19
Laminaria hyperborea
4.202499906
6.035811
12.74162
15.57166632
9.389
-
-
-
-
-
Gastropod Isopod Epifauna
Minimum temperature
Gastropod
Decapod
38
Species
Gastropod Decapod
Bivalve
Rissoa parva
Xantho spp (used Liocarcinus depurator) Musculus discors (used Modiolula phaseolina)
Sea stars
Asterias rubens
Urchins
Psammechinus miliaris
Crinoid
Leptometra
39
Algae
Kelp species
40
Phytoplankton
-
-
Optimum EwE group temperature (weighted by composition)
SD left
SD right
12
5
5
SeaLifeBase27
8
4
2
SNH report31
12.5
6
6
-
Data source