Open Access
Research
Impact of provision of cardiovascular disease risk estimates to healthcare professionals and patients: a systematic review Juliet A Usher-Smith,1 Barbora Silarova,2 Ewoud Schuit,3,4 Karel GM Moons,3 Simon J Griffin1,2
To cite: Usher-Smith JA, Silarova B, Schuit E, et al. Impact of provision of cardiovascular disease risk estimates to healthcare professionals and patients: a systematic review. BMJ Open 2015;5:e008717. doi:10.1136/bmjopen-2015008717 ▸ Prepublication history and additional material is available. To view please visit the journal (http://dx.doi.org/ 10.1136/bmjopen-2015008717). Received 8 May 2015 Revised 11 August 2015 Accepted 19 August 2015
1
The Primary Care Unit, University of Cambridge School of Clinical Medicine, Cambridge, UK 2 MRC Epidemiology Unit, University of Cambridge, Institute of Metabolic Science, Cambridge, UK 3 Julius Centre for Health Sciences and Primary Care, University Medical Centre Utrecht, Utrecht, The Netherlands 4 Stanford Prevention Research Center, Stanford University, Stanford, USA Correspondence to Dr Juliet Usher-Smith;
[email protected]
ABSTRACT Objective: To systematically review whether the provision of information on cardiovascular disease (CVD) risk to healthcare professionals and patients impacts their decision-making, behaviour and ultimately patient health. Design: A systematic review. Data sources: An electronic literature search of MEDLINE and PubMed from 01/01/2004 to 01/06/ 2013 with no language restriction and manual screening of reference lists of systematic reviews on similar topics and all included papers. Eligibility criteria for selecting studies: (1) Primary research published in a peer-reviewed journal; (2) inclusion of participants with no history of CVD; (3) intervention strategy consisted of provision of a CVD risk model estimate to either professionals or patients; and (4) the only difference between the intervention group and control group (or the only intervention in the case of before-after studies) was the provision of a CVD risk model estimate. Results: After duplicates were removed, the initial electronic search identified 9671 papers. We screened 196 papers at title and abstract level and included 17 studies. The heterogeneity of the studies limited the analysis, but together they showed that provision of risk information to patients improved the accuracy of risk perception without decreasing quality of life or increasing anxiety, but had little effect on lifestyle. Providing risk information to physicians increased prescribing of lipid-lowering and blood pressure medication, with greatest effects in those with CVD risk >20% (relative risk for change in prescribing 2.13 (1.02 to 4.63) and 2.38 (1.11 to 5.10) respectively). Overall, there was a trend towards reductions in cholesterol and blood pressure and a statistically significant reduction in modelled CVD risk (−0.39% (−0.71 to −0.07)) after, on average, 12 months. Conclusions: There seems evidence that providing CVD risk model estimates to professionals and patients improves perceived CVD risk and medical prescribing, with little evidence of harm on psychological wellbeing.
Strengths and limitations of this study ▪ This systematic review is the first to address the impact of provision of cardiovascular disease risk model estimates on patients’ or physicians’ behaviour or health outcomes. ▪ The use of broad inclusion criteria and the systematic search of multiple databases allowed us to include studies in which assessment of the impact of provision of a risk score alone was not the primary outcome. ▪ Despite this, the small number and heterogeneity of included studies limit the strength of conclusions that can be made. Most report only shortterm changes and those that address behaviour change use mostly self-reported measures and are underpowered to detect small changes that may be clinically important at the population level.
BACKGROUND Even though there have been advances in diagnosis, treatment and prevention of cardiovascular disease (CVD) in recent decades, CVD still remains the single largest cause of death worldwide.1 In 2011, 3 in every 10 deaths were caused by CVD,2 and it is estimated that by 2030, 23.3 million people will die annually due to CVD.3 This has led to increasing focus on affordable effective preventive strategies. These include collective approaches targeting the wider underlying determinants of CVD in an attempt to shift the entire population distribution of CVD risk factors, and approaches that focus on identification of individuals at high risk. An integral part of the latter approach is the use of CVD prognostic models or risk scores, such as the Framingham risk score,4 QRISK,5 ASSIGN,6 SCORE,7 PROCAM8 and 9 Reynolds which share a core set of
Usher-Smith JA, et al. BMJ Open 2015;5:e008717. doi:10.1136/bmjopen-2015-008717
1
Open Access established risk factors (age, sex, smoking, blood pressure and total cholesterol) among other risk factors (eg, Townsend score, family history). These scores enable estimation of an individual’s risk of developing CVD, and so have the potential to help physicians with decisions regarding initiation, type and intensity of treatment (eg, cholesterol-lowering treatment and blood pressure management), to facilitate an informed discussion between physician and patient regarding lifestyle changes and pharmacological treatment, to improve risk perception of both physicians and patients, and to motivate individuals to improve their health-related behaviours, with the ultimate goal to prevent CVD events. They also provide an opportunity to prioritise individuals with the highest CVD risk and so allocate resources efficiently. Such risk models have been incorporated into many major clinical guidelines for routine practice10–14 and the UK National Health Service (NHS) Health Checks programme which aims to assess CVD risk for all those aged 40–74 years without pre-existing CVD. Despite this strong advocacy of the use of such CVD risk models, relatively little is known about the benefits and harms of provision of CVD risk model estimates to patients, and whether their use by physicians actually translates into improved behavioural and clinical outcomes. Previous groups have reviewed randomised clinical trials of the effectiveness of healthcare professionals using a CVD risk model or score to aid primary prevention,15 the effectiveness of the use of CVD risk model when combined with lifestyle interventions in the prevention of CVD,16 the effects of providing individuals with global CVD risk information with or without tailored interventions,17 and the effects of providing CVD risk model estimates on physician knowledge of global CHD risk.18 These systematic reviews all included studies in which the provision of a risk model estimate was part of a multifactorial intervention. To our knowledge, no recent systematic review has comprehensively addressed the specific impact of provision of a CVD risk model estimate to either practitioners or patients. The purpose of this review was, therefore, to assess whether provision of a CVD risk model estimate to either patients or practitioners, as opposed to other simultaneous or subsequent interventions, such as lifestyle advice or exercise programmes, impacts patient or practitioner behaviour or health outcomes. METHODS We performed a systematic literature review following an a priori established study protocol (available on request). Reporting was according to the PRISMA statement.19 Search strategy As part of a larger systematic review on CVD risk scores, we performed an electronic literature search of 2
MEDLINE and PubMed from 01/01/2004 to 01/06/ 2013 with no language restriction. The search strategy is described in full in online supplementary appendix 1. Briefly, it included terms for CVD, coronary heart disease, hypertension, hyperlipidaemia, stroke or cerebrovascular disease in combination with terms for risk assessment, prediction, score or decision support, and named risk scores. We also reviewed the reference lists of systematic reviews on this topic15–18 for studies published prior to 2004 and manually screened the reference lists of all included papers. Study selection We included studies that met the following criteria: (1) primary (randomised and non-randomised) studies published in a peer-reviewed journal; (2) inclusion of participants with no history of CVD; (3) intervention strategy consisted of provision of a CVD risk model estimate to either physicians or patients (ie, not just providing a means by which physicians or patients could calculate CVD risk score); and (4) the only difference between the intervention group and control group (or the only intervention in the case of before-after studies) was the provision of a CVD risk model estimate. Observational and qualitative studies, studies calculating CVD scores for the secondary prevention of CVD or including both primary and secondary prevention where it was not possible to separate out the primary prevention group, and conference abstracts, editorials, commentaries, letters and reviews were excluded. We selected studies in a three-stage process. In the first stage, titles of all studies identified from the electronic search were screened in duplicate by six reviewers involved in a large systematic review on CVD risk prediction led by ES and KGMM to identify all studies that described the application of a risk model into clinical practice or focused on risk-based management. In the second stage, this process was repeated with seven reviewers based on abstract. In the third stage, we combined those studies identified from stage 2 with studies from systematic reviews on similar topics,15–18 and two researchers ( JU-S+SG/BS) independently screened the titles and abstracts against the inclusion and exclusion criteria. For studies where a definite decision to reject could not be made based on title and abstract alone, we obtained the full paper for detailed assessment. Two reviewers ( JU-S and BS) then independently assessed the full-text articles for the possibility of inclusion in the review. We excluded papers identified by both researchers as not meeting the inclusion criteria. Any disagreements were resolved by discussion, and a final decision was made at consensus meetings by JU-S, BS and SG. Data extraction JU-S and BS independently extracted data from all studies included in the review using a standardised data extraction form to reduce bias. The data extracted included: (1) study characteristics (research question,
Usher-Smith JA, et al. BMJ Open 2015;5:e008717. doi:10.1136/bmjopen-2015-008717
Open Access risk model or score used, study design, study setting, intervention, duration of follow-up, outcomes measured); (2) selection of participants (inclusion criteria, method of recruitment/randomisation); (3) participant characteristics (sample size, age, gender, comorbidity, level of CVD risk); and (4) measured outcome(s). Reviewers were not blinded to publication details. We requested additional unpublished data from the authors of papers in which it was mentioned that additional data were available or additional data were required to meet the inclusion criteria or for clarification of results. Quality assessment JU-S and BS conducted quality assessment at the same time as data extraction. Since our review included studies with different designs, we used a checklist based on the Critical Appraisal Skills Programme guidelines for cohort studies and randomised controlled trials (RCTs; available from http://www.casp-uk.net/#! casp-tools-checklists/c18f8) as an initial framework and then classified each study as high, medium or low quality. No studies were excluded based on quality assessment alone. Data synthesis and statistical analysis For analysis, we grouped the measured outcomes into those relating to risk perception, changes in health-related behaviour, intermediate outcomes (eg, blood pressure, cholesterol levels), modelled cardiovascular risk, medication prescribing, anxiety and psychological well-being, and contact with healthcare professionals after provision of risk information. For data on continuous outcomes, where possible, we expressed results as the difference in the mean change between groups. Where standardised mean changes were presented in the studies, we used the SD of the control group to convert data to non-standardised changes. Where this was not possible, we presented the results as mean±SD. For data on binary variables, such as a change in prescribing or meeting targets, we presented data as ORs or relative risk and 95% CIs. Where possible we combined data from different studies using random effects meta-analysis, but due to variations in study design and reporting, we were only able to do this for a small number of outcomes. We analysed all data according to the different outcomes and the recipient of the CVD risk score ( physician or patient). For outcomes with data from three or more studies, we assessed the heterogeneity between studies using the I2 statistic. We did not perform formal tests of heterogeneity for outcomes with data from less than three studies. All analyses were conducted using statistical software package STATA/SE V.12. Significance was set at p20% reported no difference in mean alcohol intake at 1 month (standardised difference in means= −0.033 (−0.36 to 0.29), p=0.84)29 and the other no change in the proportion of factory workers who
Usher-Smith JA, et al. BMJ Open 2015;5:e008717. doi:10.1136/bmjopen-2015-008717
9
Open Access
10 Table 2 Quality assessment based on the Critical Appraisal Skills Programme guidelines
Author and date
Usher-Smith JA, et al. BMJ Open 2015;5:e008717. doi:10.1136/bmjopen-2015-008717
Asimakopoulou (2008)20 Avis (1989)21 Christensen (1995)22 Christensen (2004)23 Connelly (1998)24 Hanlon (1995)25 Hussein (2008)26 Paterson (2002)27 Persell (2013)28 Price (2011)29 Qureshi (2012)30 Bucher (2010)31 Hall (2003)32 Hanon (2000)33 Grover (2007)34 Grover (2009)35 Lowensteyn (1998)36
Appropriate method
Recruitment and comparability of study groups
Blinding
•
•
•
•
•
• •
•
•
• _
•
•
•
•
•
•
•
•
• • •
•
•
•
•
• •
• •
•
• •
•
•
_
•
•
•
•
_
_
•
•
• • • •
•
• •
•
• • •
•
Addressed a clearly focused issue
• • • • •
• •
• • •
L, low; M, medium; H, high.
• •
• • •
• • •
• • • • •
• •
•
• •
• •
• • •
Exposure measurement
•
•
• •
•
• • • • •
Outcome measurement
Follow-up
Confounding factors
Analysis
Results
Overall
•
•
•
•
•
L
•
•
_ •
• •
• •
L L
_
•
•
L-M
•
M-H
_ •
• • •
•
•
• • • • • •
•
•
• • • • • • •
•
_ _
•
_ _ _ _ _
•
•
M M
•
•
L
• • • •
• • • •
• •
• •
•
•
• •
• •
M M-H M H M M M-H M M
Usher-Smith JA, et al. BMJ Open 2015;5:e008717. doi:10.1136/bmjopen-2015-008717
Table 3 Details of participants Author and date
Study design
n (% of those eligible)
Asimakopoulou (2008)20
Before-after study
Avis (1989)21
RCT
Christensen (1995)22
Patients with type 2 diabetes free from cardiovascular, cerebrovascular or psychiatric comorbidity and able to understand English Adults 25–65 years with no history of CHD, diabetes or hypertension
Inspection of medical records then letter of invitation and randomisation to 1,5 or 10-year risk
95 (66%)
Random digit dialling then randomisation to one of 4 risk appraisal tools
Before-after study
40–49-year-old men
Christensen (2004)23
RCT
30–49 years old registered with local GP
Connelly (1998)24
Before-after study
Hanlon (1995)25
RCT
Men aged 45–69 years with no obvious contraindications to antithrombotic therapy, no history of peptic ulceration or previous history of MI, stroke or serious psychiatric disorder Workers at two work sites not working permanent night shifts, taking part in another coronary intervention or taking lipid-lowering medication
Hussein (2008)26
Before-after study
People with complete data available and no history of CVD events
Gender (male)
Baseline CVD risk score
Mean 64 (range 42–72)
44%
Mean CHD 25% Mean stroke 15%
Control: 89 Intervention: 542
NA
NA
Randomly selected from Public Health Insurance register then invited by GP Letter of invitation to random sample of those registered with local practice then randomisation into control and 2 intervention groups (combined for analysis) Search of medication records then letters of invitation
Low / moderate risk: 150 (81%) High risk 123 (73%) Control: 501 (75%) Intervention: 905 (68%)
40–49
100%
Above average risk (risk ratio over 1.25): 36% NA
NA
NA
High risk (score>10): 11.4%
Baseline: 5772 (99%) 10 days: 4917 (85%) 3 months: 4244 (74%)
45–69
100%
High risk (highest quintile): 18.4%
Random selection of workers then computer-generated randomisation
Control: 229 (78%) (HE only) and 226 (76%) (HE and feedback on cholesterol) Intervention: 214 (75%) (HE and risk) and 199 (76%) (HE, feedback on cholesterol and risk) 146 (80%)
Control: 20–65 Intervention: 20–65
NA
NA
Mean 47±15
36%
High risk (5%): 23.97%
Self-selection at 2 events of free stroke risk screening as part of a community health fair
Age (years)
11
Continued
Open Access
Method of recruitment/ randomisation
Inclusion criteria
Usher-Smith JA, et al. BMJ Open 2015;5:e008717. doi:10.1136/bmjopen-2015-008717
Author and date
Study design
Paterson (2002)27
Before-after study
Age 30–74 years with measurements for blood pressure, smoking status, total and high-density lipoprotein cholesterol and free from cardiovascular disease
Persell (2013)28
RCT
Price (2011)29
RCT
Qureshi (2012)30
Before-after study
Primary care physicians at an academic medical centre and patients aged 40–79 years without history of CVD, DM or PAD, not taking lipid-lowering medication who had 2 or more clinic visits in the preceding 2 years and LDL cholesterol test in previous 5 years with most recent LDL ≥100 mg/dL and 10-year FRS >20% or LDL ≥130 mg/dL and FRS 10– 20% or LDL ≥160 mg/dL and FRS 5–10% Patients with CVD risk ≥20%, able to read and write English, not known to have CVD or a physical disability or other condition reducing the ability to walk Aged 30–65 years requesting a CVD risk assessment by their family physician without previous diagnosis of diabetes or CHD, stroke or PAD and not already receiving lipid-lowering medications or excluded by their physicians for
Inclusion criteria
Method of recruitment/ randomisation
n (% of those eligible)
Age (years)
Gender (male)
Baseline CVD risk score
First 20 physicians who responded to letter of invitation. Physicians then enrolled 2 patients who met the study criteria and for whom they would be likely to use Heartcheck under normal practice conditions Medical record search then block randomisation at the level of the practice using random number generator
37 (92.5%)
50±10.7
68%
Mean (SD): 10.8% (6.9)
Control: 217 Intervention: 218 (93.6% across both control and intervention groups)
Control: 60.1±9.2 Intervention: 61.3 ±9.4
Control: 77% Intervention: 77.5%
Mean (SD): 14% (6.5)
Eligible patients mailed written invitation and then factorial computerised randomisation
Control: 91 Intervention: 94 (16% across both control and intervention groups)
Control: 71% Intervention: 64%
Median (IQR) men: 48% (34–60); women 31% (22–43)
Usual practice
Control: 353 (92.9%) Intervention: 305 (80.3%)
Control: median (IQR) 62.4 (56.0–65.9); Intervention: median (IQR) 62.3 (54.2–66.2) Median 52 (45– 58)
39%
High risk (>20%): 11.4%
Continued
Open Access
12
Table 3 Continued
Usher-Smith JA, et al. BMJ Open 2015;5:e008717. doi:10.1136/bmjopen-2015-008717
Table 3 Continued Author and date
Study design
Bucher (2010)31
RCT
Hall (2003)32
(R)CT
Hanon (2000)33
RCT
Grover (2007)34
RCT
Inclusion criteria
n (% of those eligible)
Physicians randomised in strata according to patient volume and type of setting
Control physicians: 57 (71%) Control patients: 1682 (84%) Intervention physicians: 60 (71%) Intervention patients: 1634 (78%)
Consecutive recruitment of patients with alternate allocation to experimental and control group with doctors unaware of project Recruited during usual care then randomised into 2 groups whether primary care physician had been told CVD risk
Identified from office medical records or prebooked clinic appointments then randomisation stratified by risk level
Gender (male)
Baseline CVD risk score
Control: median 44 (39–50) Intervention: median 44 (39–51)
Control: 64% Intervention: 68%
High risk (>20%): 3%
Control: 161 Intervention: 162
NA
NA
High risk (>20%): 52%
Control: 712 Intervention: 556
Control: Mean 60 ±10 Intervention: Mean 60±10
Control: 54% Intervention: 54%
Mean (SD): 25.4% (12.0)
Control: 1193 Intervention: 1163 (initial 98% recruitment)
NA
NA
Mean (SD): 17.8% (7.5)
Age (years)
13
Continued
Open Access
psychological or social reasons Patients registered at the centres, not pregnant, aged 18 or older with continuous cART for 90 days prior to baseline and with complete data on CHD risk factors at baseline Patients 35–75 years with type 2 diabetes and no history of CVD or renal disease attending a hospital outpatient clinic Adults 18–75 years with BP >140/90 without severe hypertension, secondary hypertension, heart disease, CVD, renal, pulmonary, hepatic disease or significant psychiatric or other serious illness, diabetes, pregnancy or of reproductive age without effective contraception Patients with diabetes or 10-year risk > 30% with moderate cholesterol, 10-year risk 20–30% with high cholesterol or 10-year risk 10–20% with very high cholesterol with no hypersensitivity to statins, risk of pregnancy, breastfeeding, active liver disease, raised CK or triglycerides, a history of pancreatitis or significant renal insufficiency*
Method of recruitment/ randomisation
14
Mean (SD): 10.5% (9.3) Control: 64.8% Intervention: 64.8% Control: 50.7 ±11.3 Intervention: 50.0 ±10.8 Control physicians:32 (39%) Control patients: 176 Intervention physicians: 97 (57%) Intervention patients: 782 Interested primary care physicians around study centre. Patients 30– 74 years without history of CVD in whom clinicians thoughts a risk profile would be clinically useful RCT Lowensteyn (1998)36
*Full criteria for inclusion were: 10-year risk >30% with LDL ≥97 mg/dL or TC:HDL ratio ≥4 or; 10-year risk 20–30% with LDL ≥116 mg/dL or a TC:HDL ratio ≥5 or; 10-year risk 10–20% with HDL-C ≥155 mg/dL or TC:HDL-C ratio ≥6; no hypersensitivity to statins, risk of pregnancy, breast feeding, active liver disease or elevated AST or ALT levels (>3 times normal), CK ≥5 times normal, elevated TGs (>939 mg/dL), a history of pancreatitis or significant renal insufficiency. ALT, alanine transaminase; AST, aspartate transaminase; cART, combination antiretroviral therapy; CHD, coronary heart disease; CK, creatine kinase; CVD, cardiovascular disease; DM, diabetes mellitus; FRS, Framingham risk score; GP, general practitioner; HDL, high density lipoprotein cholesterol; LDL, low-density lipoprotein cholesterol; MI, myocardial infarction; NA, not available; PAD, peripheral arterial disease; RCT, randomised controlled trial; TC, total cholesterol; TG, triglyceride.
Mean (SD): 17.8% (7.5) NA NA Control: 143 Intervention: 166 (initial 98% recruitment)
Identified from office medical records or pre-booked clinic appointments then randomisation stratified by risk level Practices around study centre with block randomisation at the level of primary care practice according to presence or absence of medical school. Patients selected by physicians RCT Grover (2009)35
As for Grover 200734
Study design Author and date
Table 3 Continued
Inclusion criteria
Method of recruitment/ randomisation
n (% of those eligible)
Age (years)
Gender (male)
Baseline CVD risk score
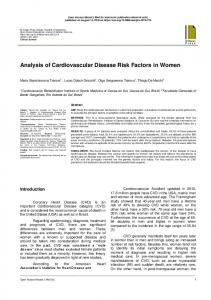
Open Access decreased alcohol consumption after 5 months among those drinking more than 21 units for men and 14 units for women at baseline ( p=0.064).25 Changes in intermediate measures Cholesterol Four RCTs reported the between-group difference in mean change in total cholesterol or low-density lipoprotein cholesterol (LDL). Two were cluster randomised studies in which physicians in the intervention group received risk information about their patients.31 36 After adjusting for lipid-lowering or antihypertensive medication at baseline31 and baseline characteristics and patients nested within the same physician,36 neither showed a difference in cholesterol after 3 months (figure 2). In the two other trials, risk information was given to participants. In one, factory workers were randomised to receive either health education±risk information or health education and feedback on cholesterol±risk information. There was no significant difference in mean change in plasma cholesterol at 5 months ( pooled difference in mean change −0.05 mmol/L (−0.13 to 0.03, p=0.208)) or 12 months ( pooled difference in mean change −0.025 mmol/L (−0.103 to 0.025, p=0.529)).25 The other trial was the only one to include participants with CVD risk >20% and showed a significant difference in mean change in LDL after 1 month29 with sensitivity analysis excluding participants who had a change in drug treatment also showing a net 7.8% reduction in LDL ( p20% or with raised LDL. One RCT of participants with untreated hyperlipidaemia did, however, find that patients were more likely to reach lipid targets if they received risk information (OR 1.26 (1.04 to 1.53), n=1163 (intervention) and 1193 (control)) and there was a significant interaction ( p=0.04) between being given a risk profile and the age gap (estimated cardiovascular risk age minus actual age) with the OR for reaching lipid targets in individuals who were reassured that they were at low risk 0.92 (0.64 to 1.31) compared with 1.69 (1.21 to 2.36) for those in the highest age gap quintile.34 Blood pressure Five RCTs reported the difference in mean change in blood pressure between patients with and without risk information.28 29 31 33 36 Three provided risk
Usher-Smith JA, et al. BMJ Open 2015;5:e008717. doi:10.1136/bmjopen-2015-008717
Open Access Figure 2 Forest plot showing the effect of provision of cardiovascular disease risk estimates to physicians or patients on the mean total cholesterol or low-density lipoprotein (LDL).
information to physicians.31 33 36 All three showed a nonsignificant difference in mean change in systolic blood pressure (SBP) or diastolic blood pressure (DBP). Pooling the data from Bucher et al31 which is adjusted for lipid-lowering medication or antihypertensive medication and Lowensteyn et al36 adjusted for group differences at baseline and patients nested within the same physician gave a non-significant reduction in both SBP and DBP (figure 3A,B). It was not possible to pool the data from Hanon et al33 because they reported only the pooled blood pressure preintervention and postintervention (intervention group (n=556); preintervention SBP 167, SD 13; and postintervention SBP 140, SD 11; and control group (n=712) SBP 166, SD 12, and 140, SD 10 preintervention and postintervention, respectively). In the two other trials, risk information was provided to patients.28 29 Both included only participants with
CVD risk >20% or raised LDL, and together they showed a significant reduction in SBP in those patients that received risk information after 1 and 9 months (figure 3A). Persell et al28 additionally showed no significant effect on DBP (figure 3B), and combining all five studies together gave non-significant differences in both SBP and DBP (figure 3A, B).
Weight/BMI Two studies reported changes in weight and found no significant difference in mean weight (standardised difference in means 0.065 (−0.22 to 0.35), p=0.66) or body fat percentage (standardised difference in means 0.063 (−0.23 to 0.35), p=0.67) among participants with CVD risk >20% at 1 month29 or mean change in body mass index (BMI) at 3 months adjusted for baseline and
Figure 3 Forest plots showing the effect of provision of cardiovascular disease risk estimates to physicians or patients on the mean change in (A) systolic blood pressure (SBP) and (B) diastolic blood pressure (DBP). Usher-Smith JA, et al. BMJ Open 2015;5:e008717. doi:10.1136/bmjopen-2015-008717
15
Open Access patients nested within the same physician (mean difference 0.154, p=0.31).36 Glycaemia Price et al29 reported no significant change in fructosamine (standardised difference in means 0.207 (−0.08– 0.50), p=−0.159), fasting glucose (standardised difference in means −0.024 (−0.31 to 0.26), p=0.87) or 2 h glucose (standardised difference in means −0.022 (−0.31 to 0.27), p=0.88) among participants with CVD risk >20% at 1 month. Changes in modelled cardiovascular risk Five RCTs reported changes in modelled CVD risk. In three, risk information was provided to physicians.31 34 36 Bucher et al31 reported difference in mean change in 10-year Framingham risk after 12–18 months in HIV patients after adjusting for lipid-lowering or antihypertensive medication; Lowensteyn et al36 reported the difference in mean change in 8-year coronary risk after 3–6 months adjusting for baseline and patients nested within the same physician; and Grover et al34 reported the difference in mean change in 10-year risk of CVD after 12 months adjusted for baseline. Together, they showed a statistically significant reduction in modelled risk (figure 4). In the other two RCTs, risk information was provided to patients.25 29 One found no significant difference in modelled risk at 1 month among those with CVD risk >20% (standardised difference in change in means −0.155±0.146, p=0.239).29 The other showed a nonsignificant increase at 5 months (difference in mean change −0.154 (−0.373 to 0.066), p=0.171 on a scale 1–100 where 1 is highest risk) and non-significant decrease at 12 months (difference in mean change 0.167 (−0.116 to 0.450), p=0.248) among factory workers.25 Combining the data from Hanlon et al at
Figure 4 Forest plot showing the effect of provision of cardiovascular disease (CVD) risk estimates to physicians or patients on the mean change in modelled CVD risk.
16
12 months with the three studies providing risk information to physicians gave a significant reduction in risk score (figure 4). Changes in prescribing Lipid-lowering medication Four RCTs reported changes in lipid-lowering medication. One in which risk scores were provided to physicians blinded to the trial showed a 42% increase in the probability of having a change in lipid-lowering medication among all patients, but this was not statistically significant ( p=0.29). In the same study, patients with a CVD risk >20% were twice as likely to have their medication changed when physicians were presented with the risk score (relative risk (RR) 2.32 (1.01 to 5.29), p=0.03).32 The other three trials reported the difference in the number of new prescriptions for lipid-lowering medication. Two gave risk information to physicians treating patients with HIV,31 or patients with CVD risk >20% or raised LDL,28 and one to patients with a CVD risk >20%.29 When pooled there was RR of 1.35 not achieving statistical significance ( p=0.08, I2=0%; figure 5), but when only those studies including participants with CVD risk >20% or raised LDL are pooled, there is a significant increase in initiation of lipid medication (RR 1.83 (1.13 to 2.98)) which increases to 2.11 (1.27 to 3.49) when only the two studies providing risk information to physicians are included. Blood pressure-lowering medication Three RCTs reported changes in blood pressure-lowering medication. As with lipid-lowering medication, Hall et al32 showed no difference in the probability of a change in medication among all patients (RR 1.52 (0.86 to 2.69), p=0.146) but patients with a CVD risk >20% who received risk information were twice as likely to have their medication changed (RR 2.38 (1.11 to 5.10),
Figure 5 Forest plot showing the effect of provision of cardiovascular disease risk estimates to physicians or patients on the relative risk (RR) of receiving a change in lipid medication.
Usher-Smith JA, et al. BMJ Open 2015;5:e008717. doi:10.1136/bmjopen-2015-008717
Open Access p=0.0189). The other two included only participants with uncontrolled hypertension or CVD >20% or raised LDL and reported no difference in the percentage of patients requiring dual therapy after 8 weeks (46%, n=712 control vs 41%, n=556 risk information),33 the percentage of patients with uncontrolled hypertension at baseline who had an increase in number of antihypertensive drug classes (OR 2.89 (0.70 to 11.9) p=0.14)28 or the median number of antihypertensive drug classes used ( p=0.45).28 One study including only participants whose blood pressure was above currently recommended targets reported the mean blood pressure threshold for intensifying treatment.35 They found no significant difference in the mean blood pressure thresholds for the whole study population (difference in means 2.8 mm Hg (−0.5 to 6.0) for systolic BP and 1.1 mm Hg (−0.9 to 3.2) for diastolic BP) or when stratified by age gap (the difference between their CVD risk age and chronological age). Glucose-lowering medication Three RCTs found no effect of risk information on either change in medication in all participants (RR 1.17 (0.89 to 1.53), p=0.273) or those with CVD risk >20% (RR 1.26 (0.87 to 1.84), p=0.219),32 or initiation of medication following provision of risk information to physicians caring for patients with HIV (RR 1.33 (0.30 to 5.96), p=0.704)31 or patients with CVD risk >20% (RR 6.78 (0.36 to 129.43)).29 Psychological well-being and anxiety Psychological well-being following receipt of risk information was assessed in four studies. Three showed no difference. In the first, a before-after study, there was no significant difference in the 12-item General Health Questionnaire (GHQ) score after 6 months in either those at low/moderate risk or those at high risk and no significant difference between the groups (n=146 in low/moderate group and 116 in high-risk group, p=0.80).22 A subsequent RCT also showed no significant difference in GHQ-12 after 1 year ( p=0.603) or 5 years ( p=0.727) between those receiving risk information (n=802, 745) and controls (n=390, 381).23 The third, also an RCT,29 measured change in general health after 1 month using the EQ-5D-3L and showed no between-group differences between those who received the risk estimate only (mean change 0.05, SD 0.12) and those who did not (mean change 0.01, SD 0.08; p=0.06). A similar pattern of results was seen when the comparison was made between those who received risk estimate + lifestyle advice (mean change −0.003, SD 0.08) and those who received lifestyle advice only (mean change 0.02, SD 0.11; p=0.442). The fourth used the GHQ-28 and showed a significant ( p