Explorer program) target this region with more precise .... and iterating from bottom to top 3 times. ... temperatures are pure MSIS; below 85.5 km the profile is.
GEOPHYSICAL RESEARCH LETTERS, VOL. 30, NO. 8, 1440, doi:10.1029/2002GL016859, 2003
Improved mesospheric temperature, water vapor and polar mesospheric cloud extinctions from HALOE Martin McHugh, Mark Hervig, Brian Magill, and R. Earl Thompson GATS Inc., Newport News, Virginia, USA
Ellis Remsberg NASA Langley Research Center, Hampton, Virginia, USA
Jonathan Wrotny and James Russell III Hampton University, Hampton, Virginia, USA Received 30 December 2002; revised 18 February 2003; accepted 31 March 2003; published 29 April 2003.
[1] We present a new retrieval technique for mesospheric measurements from the Halogen Occultation Experiment (HALOE). Previous HALOE retrievals did not account for polar mesospheric clouds (PMCs) and were biased whenever PMCs were in the sample volume. In the new algorithm we eliminate this bias by retrieving and correcting for PMC extinction, and we optimize the algorithm for this region of the atmosphere. We have reprocessed over ten years (1991 – 2002) of HALOE data with the improved algorithm, yielding nearly 75,000 vertical profiles of temperature, H2O, O3, NO and extinction at five infrared wavelengths. In this paper we describe the new algorithm in detail, present several examples of the results and discuss some initial validation INDEX TERMS: 0320 Atmospheric and quality assessments. Composition and Structure: Cloud physics and chemistry; 0340 Atmospheric Composition and Structure: Middle atmosphere— composition and chemistry; 0394 Atmospheric Composition and Structure: Instruments and techniques; 1610 Global Change: Atmosphere (0315, 0325); 1694 Global Change: Instruments and techniques. Citation: McHugh, M., M. Hervig, B. Magill, R. E. Thompson, E. Remsberg, J. Wrotny, and J. Russell III, Improved mesospheric temperature, water vapor and polar mesospheric cloud extinctions from HALOE, Geophys. Res. Lett., 30(8), 1440, doi:10.1029/2002GL016859, 2003.
1. Introduction [2] Scientific interest in PMCs has intensified recently because of claims that they may provide a visible indication of global climate change. These clouds are being actively studied [e.g., Rapp et al., 2002], but many fundamental scientific questions regarding their formation, growth and physical properties are still unanswered. They form just below the polar summer mesopause, where measurements are difficult and somewhat sporadic. [3] Although it was designed primarily for stratospheric science, HALOE solar occultation measurements extend through the mesosphere. But water and temperature profiles from the current public release version (V19) of HALOE data are biased whenever PMCs are in the line-of-sight (LOS). To correct this, we modified the retrieval to account for PMC effects and tuned it for upper mesospheric con-
ditions. We reprocessed all HALOE measurements with the improved algorithm (dubbed VPMC), yielding simultaneously measured profiles from 60 to �90 km of temperature, H2O, O3, NO (to �150 km) and extinction at 2.45, 3.40, 3.45, 5.26 and 6.26 mm. The resulting dataset constitutes a new and important tool for studies of the mesosphere, and will help bridge the gap until missions such as AIM (Aeronomy of Ice in the Mesosphere, a NASA Small Explorer program) target this region with more precise and comprehensive measurements.
2. HALOE Overview [4] HALOE has been sounding the upper atmosphere 30 times per day since 1991 [Russell et al., 1993]. By viewing the sun through the Earth’s limb, the instrument records vertical profiles of atmospheric transmission with 8 radiometer channels and 4 gas-filter correlation channels (Table 1). Each channel simultaneously views the same limb path with approximately a 3 km effective vertical resolution, 5 km horizontal resolution, and 320 km effective path length. There are nominally 15 occultations from each mode (sunrise or sunset) every day, equally spaced in longitude and at nearly the same latitude, which varies between �±80�. [5] The transmission measurements are resampled to 0.3 km (oversampled relative to the �3 km resolution). V19 then smoothes the signals to an extent exceeding 5 km in the upper mesosphere. The basic retrieval strategy is an iterative, single species, onion-peel technique. Straightforward transmission modeling of the radiometer channels is used to retrieve T, H2O, NO2 and O3. A differential gascorrelation technique, insensitive to aerosol absorption, is used for the gas-filter retrievals of HF, HCl, CH4 and NO. The remaining radiometer signals—from the 4 channels with gas-filters—provide aerosol extinctions up to 90 km. Extinction retrieved from the 5.26 mm channel is used to account for stratospheric sulfate aerosol absorption when retrieving T, NO2, H2O and O3. Above 50 km, aerosol absorption is neglected in V19.
3. Modeled PMC Optical Properties [6] To model PMC extinction spectra, we need to know the sizes and complex refractive index of the particles. PMC
Copyright 2003 by the American Geophysical Union. 0094-8276/03/2002GL016859
23
- 1
23 - 2
MCHUGH ET AL.: HALOE MEASUREMENTS OF THE MESOSPHERE
Table 1. HALOE Channels l(mm)
Type
V19 species
VPMC species
2.45
HF gas-cell Radiometer Radiometer HCl gas-cell Radiometer CH4 gas-cell Radiometer NO gas-cell Radiometer Radiometer Radiometer Radiometer
HF Aerosol Temperature HCl Aerosol CH4 Aerosol NO Aerosol NO2 H2O O3
– Aerosol Temperature – Aerosol – Aerosol NO Aerosol Aerosol H2 O O3
2.80 3.40 3.46 5.26 6.26 6.62 9.87
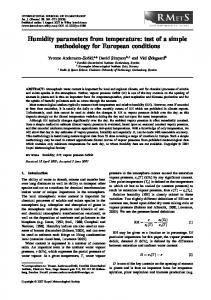
particle sizes have not been measured directly; however, they have been retrieved from a variety of remote measurements at ultraviolet to near infrared wavelengths [e.g., von Cossart et al., 1999]. These efforts reported lognormal size distributions with median radius r = 20– 74 nm, width s = 1.2– 1.7 and concentration N = 23– 1078 cm 3. Von Cossart described an average distribution with r = 51 nm, s = 1.42 and N = 82 cm 3. We examined the refractive indices of hexagonal ice from Bertie et al. [1969] for 100 K and l from 1.2– 333 mm, Toon et al. [1994] for 163 K and l from 1.4– 20 mm and Clapp et al. [1995] for 130 –210 K and l from 2.5 – 12.5 mm. Only Clapp reported indices over a range of temperatures. We use Mie theory to compute PMC spectral extinction given a size distribution and refractive index. Figure 1 shows the calculated ratios of extinction at a HALOE reference wavelength, either 3.40 or 6.26 mm, to 2.80 and 6.62 mm, the temperature and H2O channel wavelengths. We describe below the relative merits of the 3.40 and 6.26 mm channels for the reference extinction retrieval.
tion). A competing issue in choosing the reference channel is sensitivity to assumed size distribution. In Figure 1 we see that extrapolation to the H2O and temperature channels (6.62 and 2.80 mm) varies with assumed size distribution for 3.40 mm, but not for 6.26 mm. However, because of its superior signal-to-noise and consistently better test results, we selected 3.40 mm as the reference channel. [9] We extrapolate ice extinction from the 3.40 mm reference to the other wavebands using an ice spectrum calculated from the average von Cossart size distribution and Clapp temperature dependent refractive indices. We retrieve temperature, H2O and 3.40 mm aerosol extinction, and iterate this sequence three times. Following this, we retrieve O3, NO and finally aerosol extinction at 2.45, 3.45, 5.27 and 6.26 mm. Figure 2 shows calculated spectra for two different refractive indices, along with the average VPMC retrieved extinctions. [10] In addition to correcting for ice absorption, we optimized various parameters for retrieving in and around PMC layers. V19 signal profiles are smoothed with a Gaussian averaging kernel whose width varies according to the signal level. At PMC altitudes this kernel is more than 5 km wide. In VPMC, we reduced this to 2 km, and hold it constant for all channels and altitudes. Additional smoothing occurs during the aerosol retrieval, where constraints damp out excessive fluctuations. A weighting distance is used to govern this damping, and this is reduced from 0.8 to 0.6 km for VPMC.
4. Description of VPMC Retrieval [7] Hervig et al. [1996] and Harries et al. [1996] validated the HALOE temperature and water measurements for V17. While there has been no comprehensive validation of the current version (V19), the major changes since the V17 release were related to the pressure registration and spectroscopy, and had little impact above the stratosphere. Remsberg et al. [2002] recently surveyed the HALOE V19 mesospheric temperatures in detail, but excluded the polar summer regions. [8] The major improvement in VPMC is the addition of an aerosol correction to the radiometer channels in the upper mesosphere. VPMC retrieves aerosol extinction from a reference channel and extrapolates to the other channels using an ice model. The 3.40 and 6.26 mm channels are the two viable reference channels—having sufficient ice absorption but lacking significant molecular interference. Calculated ice absorptions are 5– 15% higher at 6.26 mm than at 3.40 mm, but the noise in the 6.26 mm channel is nearly double that of 3.40 mm channel. Furthermore, the 3.40 mm channel noise is dominated by tracking jitter, which is greatly reduced by pointing at sun-center instead of the nominal position 1/2 way between the top and center. Since June 2000, all high-latitude occultations near summer solstice have been taken pointing at sun-center to achieve this jitter reduction. (Otherwise the field of view is still locked above sun-center for deeper tropospheric penetra-
Figure 1. Modeled PMC extinction ratios for various HALOE channel pairs, particle size distributions and refractive indices. Left: ice extinction ratios versus effective radius computed using refractive indices for 163 K, and size distributions from von Cossart in addition to a range of synthetic distributions. Right: extinction ratio vs. temperature computed using the average von Cossart size distribution and three refractive indices.
23 - 3
MCHUGH ET AL.: HALOE MEASUREMENTS OF THE MESOSPHERE
Figure 2. Measured and modeled ice spectrum. Symbols are average VPMC extinctions during July 10– 20, 1992 – 2001, 60 –70�N. Error bars indicate the std. deviation of the measurements. Lines are calculated ice spectra, assuming refractive indices from Toon at 163 K (solid), and Clapp at 150 K (dashed). Both assume the average size distribution from von Cossart et al. [1999], and are normalized to the 3.40 mm measurement. [11] With the exception of temperature, retrievals use the top-down onion-peel method. The starting altitudes in VPMC were raised from 87 to 92.4 km for all species except NO, which still begins at 150 km. Temperature is retrieved with an upward strategy, adjusting for hydrostatic balance, and iterating from bottom to top 3 times. The MSIS model [Hedin, 1991] is then merged onto the retrieved profile, extending it to 150 km. The merge range has been raised for VPMC from 78 – 99 to 85.5 – 99 km. Above 99 km, temperatures are pure MSIS; below 85.5 km the profile is completely retrieved; in between is a weighted average. Also, in VPMC we have upgraded from MSIS-86 to MSIS-2000. Finally, V19 temperatures are mistakenly limited to no colder than 125 K, but for VPMC we lowered the limit to 102 K (the current lower bound of our absorption calculations).
5. VPMC Results [12] We have reprocessed all HALOE measurements from 1991 through August 2002 with VPMC. HALOE
Figure 4. Top: average VPMC and V19 temperature and difference. Middle: VPMC and V19 H2O and difference. These are averages from 60– 70�N, July 10– 20, 1992— 2001. Bottom: VPMC and V19 temperatures for August 9—19, 65—75�N, the Lu¨bken [1999] climatology, and their difference. continues to operate without flaw, and the VPMC dataset will be updated as measurements become available. Figure 3 shows a comparison of VPMC and V19 during the development of the northern PMC season. PMCs appear in early June, evidenced by the increased aerosol extinction at 80– 86 km, and persist into early August. Individual PMC signatures can be found as early as May and until late August, but Figure 3 is an average, and represents only the general statistical behavior of the data. As predicted, in the region of high PMC extinction, VPMC water is reduced and temperatures are up to 10 K colder than V19. Small differences also appear before June
Table 2. VPMC Estimated Systematic Errors Error
Figure 3. Time vs. altitude cross-sections from March through October, showing VPMC and V19 temperature (top), H2O (middle) and 3.40 mm extinction (bottom). These are averages from 10-day periods, 60– 70�N, during 1992 – 2001.
Source
H2O (%)
T (K)
b3.40 (%)
Pressure registration Temperature climatology Spectral ice model Forward model
4 1 15 10
2.5 1 1 3
8