Improved Neural Network Performance Using Principal Component Analysis on Matlab
Improved Neural Network Performance Using Principal Component Analysis on Matlab Junita Mohamad-Saleh
Brian S. Hoyle
Senior Lecturer School of Electric and Electronic Engineering, Universiti Sains Malaysia, Engineering Campus, 14300 Nibong Tebal, Seberang Perai Selatan, Malaysia. E-mail:
[email protected]
Professor in Vision System School of Electronic & Electrical Engineering, University of Leeds, LS2 9JT, United Kingdom. E-mail:
[email protected]
H
Abstract
1. Introduction
Most of the real-world data samples used to train artificial neural networks (ANNs) consist of correlated information caused by overlapping input instances. Correlation in sampled data normally creates confusion over ANNs during the learning process and thus, degrades their generalization capability. This paper proposes the Principal Component Analysis (PCA) method for elimination of correlated information in data. Since it has been wellknown that Electrical Capacitance Tomography (ECT) data are highly correlated due to overlapping sensing areas, the PCA technique has been examined on the ECT data for oil fraction estimation from gas-oil flows. After application of PCA, the uncorrelated ECT data were used to train a Multi-Layer Perceptron (MLP) ANN system. Then, the trained MLP was tested upon unseen ECT data. The results demonstrated that the elimination of correlated information in the sample data by way of the PCA method improved the MLP’s estimation performance and reduced the training time.
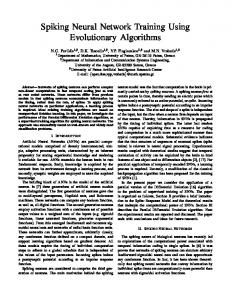
An ANN is a system consisting of processing elements (PE) with links between them. A certain arrangement of the PEs and links produce a certain ANN model, suitable for certain tasks. A Multi-Layer Perceptron (MLP) is a kind of feed-forward ANN model (i.e. forward direction links), consisting of three adjacent layers; the input, hidden and output layers [1]. Each layer has several PEs. Figure 1 illustrates the structure of a MLP. MLPs learn from input-output samples to become ‘clever’ i.e. capable of giving outputs based on inputs which it has not seen before. The learning process employs a learning algorithm, during which the MLP develops a mapping function between the inputs and outputs. Basically, in a learning process, the input PEs receive data from the external environment (denoted by x1, x2, … xn in Figure 1) and pass them to the hidden PEs, which are responsible for simple, yet, useful mathematical computations involving the weight of the links (denoted by w11, w21, … in the figure) and the input values. The results from the hidden PEs are mapped onto appropriate threshold function of each PE and the final outputs are produced. The
Keywords: Principal component analysis, Multi-layer perceptron, tomography, fraction estimation, Matlab.
International Journal of The Computer, the Internet and Management Vol.16. N.o.2 (May-August, 2008) pp 1-8
1
Junita Mohamad-Saleh and Brian S. Hoyle
output values then become inputs to all PEs in the adjacent layer (either the second hidden layer or the output layer), and the computation processes are repeated through out the layers until finally, output values are produced at the output PEs (denoted by y1, y2, … in Figure 1). At this stage, an output error value is calculated by computing the difference between the MLP’s and the actual outputs. The entire training process is iterative in nature, and stops when an acceptably small error is achieved. At completion of a learning process, the MLP should be able to give output solution(s) for any given set of input data based on the generalized mapping that it has developed.
sets prior to the MLP training process as well as interpretation stage. This is the technique examined in this research. The PCA technique was first introduced by Karl Pearson in 1901, but he did not propose the practical calculation method for two or more variables, which were useful for various applications. It was not until 1930s that the calculation methods involving two and more variables had been described. Basically, the PCA technique consists of finding linear transformations, y1,y2,y3, …, yp of the original components, x1,x2,x3,…,xp that have a property of being uncorrelated. In other words, the y components are chosen in such a way that y1 has maximum variance, y2 has maximum variance subject to being uncorrelated with y1, and so forth. The first step in the PCA algorithm is to normalize the components so that they have zero mean and unity variance. Then, an orthogonalization method is used to compute the principal components of the normalized components. The PCA method has also been widely applied in other published papers involving the use of ANNs as a means of reducing the dimensionality of input space [4-5].
Figure 1 - A schematic diagram of a MultiLayer Perceptron (MLP) neural network. The performance of a MLP very much depends on its generalization capability, which in turn is dependent upon the data representation. One important characteristic of data representation is uncorrelated. In other words, a set of data presented to a MLP ought not consist of correlation information. This is because correlated data reduce the distinctiveness of data representation and thus, introduce confusion to the MLP model during the learning process and hence, producing one that has low generalization capability to resolve unseen data [2]. This suggests a need for eliminating correlation in the sample data before they are being presented to an MLP. This can be achieved by applying the Principal Component Analysis (PCA) technique [3] onto input data
For the purpose of studying the effects of the PCA technique upon MLP’s performance, the Electrical Capacitance Tomography (ECT) data had been chosen.
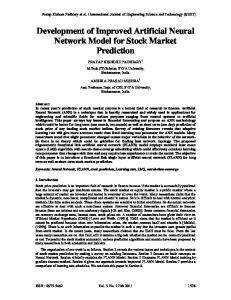
2. Electrical Capacitance Tomography: Problem ECT is a technique used to obtain the internal spatial and temporal distribution of materials within a cross-section of a process equipment, based on the electrostatic field theory [6]. A schematic diagram of the ECT sensor is as shown in Figure 2. The numbers denote the electrode sensors.
2
Improved Neural Network Performance Using Principal Component Analysis on Matlab
Practically, a change in the distribution of materials within a sensing area produces a change in the capacitance measurements between two electrode sensors [7]. The change is sensed by the data acquisition unit, which is responsible for obtaining the changes in capacitance readings between all possible pairs of primary electrodes for various material distributions.
4
3
5
2
6
1
7
12 11
8 9
10
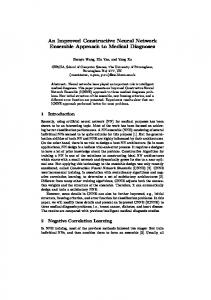
Figure 3 – A schematic diagram showing the overlapping sensing regions between electrode 1 and all other electrodes.
3. Experimental Methods The effects of applying the PCA method to a MLP system was investigated for estimation of oil fraction from gas-oil flows based on ECT data. Oil fraction refers to the ratio of the cross-sectional area covered by oil, to the entire cross-sectional area of the pipe. For ease of evaluation, the fraction has been normalized within 0 to 1, in which case, 0 means no oil, and 1 means that the crosssection is full of oil. For the investigation purpose, simulated ECT data corresponding to various gas-oil flows had been generated using an ECT simulator. The data were then divided into three datasets; the training, validation and test. The training set was used to train the MLP, the validation set was used for early-stopping of the training process and the test set was used to evaluate the MLP performance after completion of the training process.
Figure 2 - Cross-sectional diagram of the ECT sensor model used in this research. Raw ECT data consist of correlated information. caused by the overlapping of the sensing regions of several electrode pairs. Figure 3 illustrates the occurrence of overlapping among several sensing regions each time capacitance measurements are made between primary electrode 1 and all other electrodes of a 12-electrode ECT sensor. The lines at each ends of electrode 1 connecting to the ends of all other electrodes show the sensing regions between electrode 1 and the other electrodes. Schematically, it can be seen that almost all sensing regions involve overlapping electric field lines. This phenomenon contributes to correlated information in the change in the capacitance measurements of ECT data. Therefore, it is necessary for the ECT data to be preprocessed in order to eliminate the correlation before they can be used by a MLP.
Two types of PCA data processors had been implemented for the purpose. The first one is called the PCA pre-processor, which is responsible for pre-processing raw ECT data, to eliminate correlation in the training samples. The second is called PCA postprocessor, used to transform the validation and test datasets according to their principal components. The implementation and simulation were carried out with the aid of
International Journal of The Computer, the Internet and Management Vol.16. N.o.2 (May-August, 2008) pp 1-8
3
Junita Mohamad-Saleh and Brian S. Hoyle
built-in functions supported by MATLAB® Neural Network Toolbox [8].
Several MLPs were trained using different PC variance values in order to determine the optimum percentage value of the total variation in the dataset.
3.1 Implemention of PCA Pre-Processor
TransMat
Recall that the PCA technique uses the SVD method to order the input data in descending order of importance and uncorrelation. This way the most important and less uncorrelated input components are given higher priority than the less important and highly correlated ones. The use of the PCA function in Matlab involves specifying a fraction value corresponding to the desired percentage of the least contribution of the input components. For example, a fraction value of 0.02 means that the input components which contribute less than 2% of the total variation in the data set will be discarded. From this point onwards, this fraction value will simply be referred to as the “PC variance”.
C
N
Normalisation
SVD Ntrans
MLP
Mean & Variance PC variance value
Figure 4 – The stages of PCA data preprocessing. 3.2 Implemention of PCA Post-Processor During each training process, an MLP’s validation and generalization performances on sets of validation and test patterns were assessed. Each vector of the validation or test ECT data has to be post-processed using the post-PCA technique before it can be used by a trained-ANN to estimate a flow parameter. See Figure 5 for illustration of the post-processing procedures.
Before a set of ECT measurements can be used for ANN training, they have to be pre-processed to extract relevant features from the data. Figure 4 illustrates the PCA data pre-processing procedures used in this research. The ECT measurements, C (in a matrix notation) were first normalized, so that they had zero mean and unity variance. Then the SVD method were used to compute the principle components using the normalized ECT measurements, N, the mean and variance values. This generated a transformation matrix, TransMat and produced a transformed set of measurements, Ntrans, consisting of orthogonal or simply, uncorrelated components. Matrix TransMat was stored for later use during the data postprocessing stage. The uncorrelated components of matrix Ntrans were ordered according to the magnitude of their variances. They were then passed to an MLP together with their corresponding target output values for a network training process based on a selected PC variance value.
Like the pre-processing procedure, the validation or test ECT data, Cval/test were first normalized so that they had mean zero and unity variance. Then, the normalized measurements, Nval/test were post-processed based on the transformation matrix, TransMat (obtained during the preprocessing stage) to produce a new set of transformed matrix, Ntransval/test consisting of uncorrelated components. Using the PC variance value currently in used by the MLP undergoing a training process, and the uncorrelated ECT measurements, Ntransval/test, a reduced set of uncorrelated ECT measurements was generated. Cval/test
Nval/test
Ntransval/test Transformation
Normalisation
TransMat
MLP
PC variance value
Figure 5 – The stages of PCA data postprocessing
4
Improved Neural Network Performance Using Principal Component Analysis on Matlab
The trained-MLP used these reduced uncorrelated measurements together with its optimum network weights obtained from the training process to estimate oil fraction from gas-oil flows based on unseen ECT data.
where P is the total number of test patterns, Ti is the actual flow parameter value for the ith test pattern, and Oi is the MLP’s estimation of the flow parameter for the ith test pattern.
3.3 Training, Testing and Selecting MLPs
The MAEs of all MLPs were evaluated and the MLP which gave the least MAE was selected as the best-performed MLP to represent the task. This MLP’s was then evaluated
In this investigation, all MLPs were trained and tested with the same sets of training and test patterns, respectively. For each PC variance value, several MLPs were trained with the uncorrelated training data (NTrans) corresponding to outputs of oil fraction values, using the Bayesian Regularization training algorithm. The reason for training several MLPs is to obtain the optimum MLP structure, as well as to examine the optimum PC variance value for the task. Optimum structure in this case means the optimum number of neurons or processing elements an MLP should have in its hidden layer in order to perform well. This criterion is important in order to produce a MLP with the best generalization capability. Optimum PC variance value determines the optimum number of uncorrelated input values each set of data should have to facilitate MLP learning. During the training process, the duration of training time was recorded.
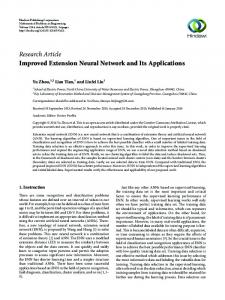
4. Results and Discussion The graph in Figure 6 shows the MAE of MLP which have been trained with uncorrelated data based on the various PC variance values. It can be seen that the MAE values tend to reduce with increasing PC variance until 0.05%. It was found that after this point, the MAE values start to increase again and never come down. Figure 7 shows the number of input components produced for each PC variance value investigated. It can be observe from the figure that the number of input components reduces with increasing values of PC variance used. This is expected since a larger PC variance value means more input components are correlated, and thus, more are eliminated.
After the MLPs had been trained, their generalization performances towards a set of test data were assessed in order to select the best MLP for the estimation of oil fraction. In doing so, the test ECT data were first post-processed using the PCA data post-processor already implemented. After post-processing, a set of reduced uncorrelated test data were produced and fed into the MLPs to obtain the oil fraction values corresponding to each test set. Each MLP’s performance was calculated based on the Mean Absolute Error (MAE) given by P MAE = ∑ | Ti − Oi | i =1
Figures 6 and 7 are comparable in terms of the MAE and number of input components used for training. Comparing these two figures, it can be clearly seen that the MAE reduces with fewer number of input components, until 0.05% PC variance value (corresponding to 27 input components, i.e. the point is denoted with (0.05,27) in Figure 7), after which, the MAEs increase again. This suggests that too many input components introduce too much correlation in the data, resulting in data confusion and thus, the MLP is not able to
(1)
International Journal of The Computer, the Internet and Management Vol.16. N.o.2 (May-August, 2008) pp 1-8
5
Junita Mohamad-Saleh and Brian S. Hoyle
MAE of test data
properly make the distinction between the various features in the data (i.e. for PC variance of less than 0.05%). At point 0.05% of PC variance value with 27 input components, the MLPs gave the lowest MAE of about 0.09%. It suggests that this number of inputs is sufficiently optimal for the MLP to learn distinct features in the data and perform better input/output mapping. After the PC variance value of 0.05%, the number of input components becomes too few, generating a condition of information lacking that the MLP can not become sufficiently “intelligent” to estimate the oil fraction. The overall results demonstrate that a MLP generalize better when the number of input data presented to it, is optimally sufficient and does not consist of too many correlated components.
Figure 8 shows the average training time required to train a MLP. It can be seen that the network training time increases exponentially as the number of input components increases. The results demonstrates that the application of PCA technique onto the input data reduces the number of input components and consequently, reduces the network training time as it deals with fewer weight parameters. This is especially important when training a MLP to solve a complex problem involving a large input dimensionality, or a problem consisting of several thousands of training samples. Clearly, the PCA technique is useful for improving the generalization performance of a MLP as well as reducing the network’s training time.
0.15% 0.14% 0.13% 0.12% 0.11% 0.10% 0.09% 0.08% 0.001
0.01
0.1
1
log of PCA variance (%)
Figure 6 - Generalization performance of MLPs trained with ECT data of various PCA variance.
6
Improved Neural Network Performance Using Principal Component Analysis on Matlab
.
55 50 45 No. of input components
40
5,
27
)
35 (0
.0
30 25 20 15 10 0 .0 0 1
0 .0 1 0 .1 lo g o f P C A v a ria n c e (% )
1
Figure 7 – The number of input components produced at various PC variance values.
65
.
60 55
Mean of training time (s)
50 45 40 35 30 25 20 0
0 .1
0 .2
0 .3
0 .4
0 .5
0 .6
P C A v a ria n c e (% )
Figure 8 - The average training time of ten MLPs for different PC variance values.
5. Conclusions The results have shown it is feasible to use the PCA technique to eliminate correlation in raw ECT data, resulting in improved MLP oil fraction estimation capability. Besides boosting the generalization capability of a MLP, the PCA technique also reduces the network training time due to the reduction in the input space dimensionality. Therefore, the findings suggest that PCA data processing method is useful for improving the performance of
The work concerns the use of PCA technique for elimination of correlation in the raw ECT data in order to boost the learning capability and generalization of a MLP system. Two PCA data processors have been implemented in the Matlab environment for the purpose investigating the effects of eliminating correlation in the ECT measurements for the task of estimating oil fraction from gas-oil flows.
International Journal of The Computer, the Internet and Management Vol.16. N.o.2 (May-August, 2008) pp 1-8
7
Junita Mohamad-Saleh and Brian S. Hoyle
MLP systems, particularly in solving complex problems involving a large number of input data.
[5]
Acknowledgement The author would like to acknowledge the source of funding provided by the Universiti Sains Malaysia for this research work. [6] References [1] Haykin S., (1999) Neural Networks: A Comprehensive Foundation, Macmillan College, London. [2] Bishop C. M. (1994), “Neural networks and their applications”, Review of Scientific Instruments, vol. 65, no. 6, pp. 1803-1832. [3] Jolliffe I. T. (1986), Principal Components Analysis, Springer-Verlag, New York. [4] Charytoniuk W. and Chen M. S. (2000), “Neural Network Design for Short-term Load Forecasting”, Proceedings of the International Conference on Electric Utility Deregulation and Restructuring
[7]
[8]
____
8
and Power Technologies, London, pp. 554 –561. Tabe H., Simons S. J. R., Savery J., West R. M. and Williams R. A. (1999), “Modelling of Multiphase Processes Using Tomographic Data for Optimisation and Control”, Proceedings of 1st World Congress on Industrial Process Tomography, April 14-17, Buxton, pp. 84-89. Beck M. S. and Williams R. A. (1996), “Process Tomography: A European innovation and its applications”, Measurement Science and Technology, vol. 7, pp. 215-224. Xie C. G., Huang S. M., Hoyle B. S., Thorn R., Lenn C., Snowden D. and Beck M. S. (1992), “Electrical capacitance tomography for flow imaging: system model for development of image reconstruction algorithms and design of primary sensors”, IEE Proceedings G, vol.139, no. 1, pp. 8998. Demuth H. and Beale M. (1998), MATLAB® Neural Network Toolbox User’s Guide Version 3.0. The Math Works Inc..