Yang MY, Sun SQ, Zhu JG et al. Improvement of machine translation evaluation by simple linguistically motivated features. JOURNAL OF COMPUTER SCIENCE AND TECHNOLOGY 26(1): 57–67 Jan. 2011. DOI 10.1007/s11390-011-1111-1
Improvement of Machine Translation Evaluation by Simple Linguistically Motivated Features Mu-Yun Yang (杨沐昀), Member, CCF, IEEE, Shu-Qi Sun (孙叔琦), Jun-Guo Zhu (朱俊国), Sheng Li (李 Tie-Jun Zhao (赵铁军), Senior Member, CCF, Member, IEEE, and Xiao-Ning Zhu (朱晓宁)
生)
School of Computer Science and Technology, Harbin Institute of Technology, Harbin 150001, China E-mail: {ymy, sqsun, jgzhu, tjzhao, xnzhu}@mtlab.hit.edu.cn;
[email protected] Received December 31, 2009; revised December 23, 2010. Abstract Adopting the regression SVM framework, this paper proposes a linguistically motivated feature engineering strategy to develop an MT evaluation metric with a better correlation with human assessments. In contrast to current practices of “greedy” combination of all available features, six features are suggested according to the human intuition for translation quality. Then the contribution of linguistic features is examined and analyzed via a hill-climbing strategy. Experiments indicate that, compared to either the SVM-ranking model or the previous attempts on exhaustive linguistic features, the regression SVM model with six linguistic information based features generalizes across different datasets better, and augmenting these linguistic features with proper non-linguistic metrics can achieve additional improvements. Keywords
1
machine translation, automatic evaluation, regression SVM (supporting vector machine), linguistic feature
Introduction
Automatic evaluation of machine translation (MT) system is a hot research issue in the MT circle. Compared with the costly and slow human assessment, the widely adopted automatic evaluation metrics like BLEU[1] and NIST[2] have succeeded in delivering instant and correct evaluation at the system level. To facilitate the MT research at a finer granularity, the ongoing investigations are focused on the sentence level evaluation[3-4] , in addition to those efforts in getting reference translation better[5] or making more flexible matches during evaluation[6-7] . In contrast to the simple N-gram co-occurrence employed in BLEU and NIST, recent trends are adopting various machine learning methods to build better MT evaluation metrics. Corston-Oliver treated the evaluation of MT outputs as a classification problem between human translation and machine translation, using both linguistic features and features that are more abstract[8] . Kulesza and Shieber proposed an SVM classifier based on the confidence score, which took the distance between the feature vector and the decision hyperplane as the measure of the MT system’s output[3] . Albrecht and Hwa adopted the regression
SVM, another strategy of SVM, to improve the evaluation metric[9] . Ye et al.[10] and Duh [11] formulated the task of evaluation as a ranking problem, and the former indicated that the linguistic knowledge based features contributed more to the performance. Gim´enez and M´arquez showed that compared with metrics limited in lexical dimension, metrics integrating deep linguistic information would be more reliable[12] . A notable practice in these approaches is the greedy integration of all available linguistic features into one model. This is doubtful because machine learning methods, generally speaking, are not thoroughly resistant to data over-fitting. If provided with too many cross-dependent features for a limited training data, the model would be prone to the less generalized result. One potential solution to this issue is to adopt the feature selection technique for an optimized feature set, which are somewhat less touched in the realm of MT evaluation modeling① . To address this issue, this paper takes a more straightforward approach to investigate the linguistically motivated feature engineering process, and suggests the strategy of “simple feature in key aspects”. In the rest of this paper, we first discuss the intuition of selecting linguist features for MT evaluation,
Regular Paper Supported by the National Natural Science Foundation of China under Grant Nos. 60773066 and 60736014, the National High Technology Development 863 Program of China under Grant No. 2006AA010108, and the Natural Scientific Research Innovation Foundation in Harbin Institute of Technology under Grant No. HIT.NSFIR.20009070. ① This fact partially reflects the difficulty of getting the rich linguistics even for the researchers.
©2011 Springer Science + Business Media, LLC & Science Press, China
58
J. Comput. Sci. & Technol., Jan. 2011, Vol.26, No.1
and propose six features in detail. Then several regression SVM models are built with these features and three other non-linguistic metrics, and performance of these models are examined. The performance of regression and ranking are compared as well. Next, we introduce a hill-climbing strategy to examine the contribution of individual features. After a further discussion on results, we conclude that, this strategy of “simple linguistically motivated features” brings out a better and more generalized regression-based metric, and augmenting non-linguistic metrics with these linguistic features can achieve further improvement. 2 2.1
Linguistically Motivated Feature Formulation for MT Evaluation Discussion on Employing Linguistic Features
The basic idea for automatic MT evaluation is to compute the similarity between MT outputs and the reference translations through the co-occurrence of ngrams. A typical implementation of this approach is BLEU, one of the most popular automatic evaluation metrics currently used. However, n-gram co-occurrence-based metrics still have some defects. Blatz noted that the correlation of BLEU with human assessments at the sentence level is not as good as that at the document level[13] . To deal with this drawback which is crucial to MT improvement, various machine learning techniques have been applied, hypothesizing that the full exploitation of linguistic information can make the evaluation progress more “human-like”. It is acceptable for MT evaluation to employ language dependent features since only the target language is involved for language analysis. In practice, dozens of language intrinsic features have been introduced into various machine learning models. Amig´o et al. suggested the combination of 22 features with QARLA framework[14] . Albrecht and Hwa adopted 53 features in building the regression based evaluation metric[9] . Gim´enez and M`arquez also claimed a more robust evaluation metric with a total of 28 features[12] . Briefly, except for string-based features such as BLEU, NIST, METEOR[7] , ROUGE[6] , WER[15] , PER[16] and their variants, the linguistic features used in previous literatures may fall into the following 3 categories. • Shallow Syntactic Features. These features are mostly based on POS tagging, one of the representative works is [17]. • Syntactic Features. These features are on the basis of syntactic/dependency trees, e.g., STM and HWCM,
with various parameter settings[9,17] . • Semantic Features. These features make use of named entity reorganization and semantic role labeling algorithms to capture the high level of linguistic phenomenon such as semantic labels, text entailment features[17] . Though all the machine learning approaches seemingly do well with those automatically acquired features, it is still worthy to explore whether machine learning would do better with less and simpler features. Considering the imperfect results generated by the current natural language processing techniques, it is more desirable if some simple and reliable features can be formulated from human perception of translation quality. Therefore, among the varied linguistic information that can be extracted from the MT outputs, the key issue is to decide which of them are relatively more informative and easy to obtain. 2.2
Features Based on Linguistic Intuition
Translation is the “replacement of textual material in one language by equivalent textual material in another language[18] ”. Though people are far from ascertaining the factors in perception of translation equivalence, it is less controversial that the abundant linguistic units deemed relevant to the translation quality can be represented by nothing but the word, the phrase and the sentence. This is not only the conclusion form translation study based on linguistic theory[18] , but also an observation form an exhaustive survey of English translation teaching and evaluation studies[26] . From these three key aspects, this subsection presents several linguistically motivated features with the illustration of both the intuition and the calculation formulae. Word Level. As for word level, it is relatively easy to manipulate the features since word matching to reference translations is reliable and simple. The features are actually designed from two aspects: • Translation Quality of Content Words The intuition here is that the content words carry more important information than the function words in a sentence. In this paper, content words include nouns, verbs, adjectives, adverbials, pronouns and cardinal numerals. • Cognate Words Matching English words have plenty of morphological changes. So if a machine translation sentence shares some cognate words with a human reference sentence, it contains at least some correct basic information. Another support for this is the fact that un-matching words in the original text may match after lemmatization. Thus, poor machine translations will be distinguished. We define here the content word precision and recall
Mu-Yun Yang et al.: Improvement of MTE by Simple Linguistic Features
after lemmatization, which are calculated as follows: 1) POS-tag machine translations and reference translations② . 2) In all sentences, find all content words according to the POS, and stemming them by Porter③ . 3) Calculate precision and recall on the word list generated in step 2). The three steps above are formulated in (1) and (2), in which t represents the machine translated sentence: LCWP (t) = max r∈ref
No. overlapped content words No. content words in t (1)
LCWR(t) = max r∈ref
No. overlapped content words . No. content words in r (2)
Translation precision and recall of content words after stemming are displayed as LCWP, LCWR respectively, and ref represents the reference translation set. Phrase Level. Phrases represent more semantic information than words. In manual evaluation, or rather, to a human’s mind, a correctly translated phrase usually impresses the reader more than a correctly translated word. Therefore, in addition to words or n-grams which are of less semantic information, we can make use of real phrases to measure the quality of the machine translations. To get the syntactic phrases, we use the constituent parser proposed by Michael Collins[19] because it is publicly available. After parsing every sentence, we extract noun phrases recursively④ and compute the precision and recall of them (referred as NPP and NPR) by case-insensitive matching and ignoring punctuations, according to (3) and (4) where t represents the machine translated sentence: NPP (t) = max
No. overlapped NPs No. NPs in t
(3)
NPR(t) = max
No. overlapped NPs . No. NPs in r
(4)
r∈ref
r∈ref
Besides noun phrases (NP), there are many other types of phrases. Another important type of phrase is verb phrase (VP). Unfortunately, due to the changeable tense of verbs, matches of VPs are too few to be informative enough for measuring the quality of a translation. Sentence Level. To capture the fact that a good translation must be faithful to the original text in
59
meaning and its “well-formedness” in sentence structure, we have designed the following features, with the hypothesis that: 1) the length of a translation is usually in good proportion to the source language; 2) a good sentence is usually with a relatively higher probability in the language model. • Features Based on Length Comparison Gale and Church[20] noted that each character in one language, L1 , gives rise to a random number of characters in the other language, L2 , and these random variables are independent and normally distributed with two parameters c and s2 . The parameter c denotes the expected number of characters in L2 per character in L1 , and s2 denotes the variance of the number of characters in L2 per character in L1 . Let l1 and l2 denote length of a portion of text from languages L1 and L2 respectively, then p δ = (l2 − l1 c)/ l1 s2 would be normally distributed with the mean 0 and the variance 1. Then, we employ LOS (t) = 2 × [1 − P -norm(|δ|)]
(5)
as a feature. The function P-norm(·) is described by Abramowitz and Stegun[21] . Assuming δ has a 0∼1 Gaussian distribution, P-norm(δ) is the approximation of the cumulative probability below: 1 √ 2π
Z
δ
e−z
2
/2
dz.
−∞
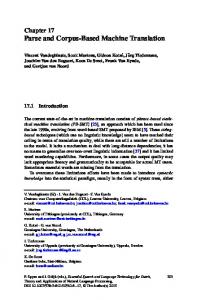
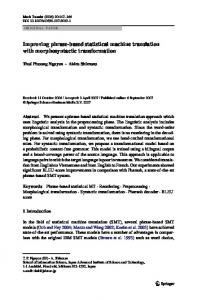
It is obvious that the higher 2[1 − P -norm(δ)] is, the closer to zero δ lies. That is to say that the translation sentence has an appropriate length. We estimated the parameters from a large ChineseEnglish parallel text of sentence aligned. We counted the total number of Chinese characters, then divided it by the total number of characters in its English translation. The result was taken as an estimate of c. We estimated s2 from a robust regression on (l2 − l1 c)2 (which is an estimate of variance) and l1 . l1 and l2 represent the number of characters in an English sentence and the corresponding Chinese sentence respectively. Details can be found in [17]. Here we got c = 0.267 and s2 = 0.395, and Fig.1 confirms that δ is approximately with a 0∼1 Gaussian distribution.
② By MXPOST (http://www.geocities.com/adwait ratnaparkhi). ③ Available at http://tartarus.org/∼martin/PorterStemmer. ④ That means if there is a noun phrase in another noun phrase, both noun phrases will be counted.
60
J. Comput. Sci. & Technol., Jan. 2011, Vol.26, No.1
evaluation. Among the complex criteria for the sentence quality, how to choose features for a model is still a research in progress. Here we would like to stress that more features do not lead to better quality. And comparable or better results can also be achieved by introducing a much smaller feature set. 3 3.1
Fig.1. Histogram of δ (delta). The 0∼1 normal density plot is also shown for comparison. The mean of δ is 0.0602, and the variance of δ is 0.98837.
• Features Based on Parser Score Previous approaches to model the “well-formedness” of a sentence employed the n-gram language model or the computed syntactic structure similarities[22] . However, the language model has been widely adopted in MT and thus bears less discrimination power. Moreover, the present parser is still not satisfactory, leaving much noise for structure matching. To avoid these pitfalls in using language model (LM) and parser, here we notice that the score⑤ given by the parser also reflects the quality of a sentence. It may be regarded as a syntactic based language model score as well as an approximate representation of the wellformedness of the parse. Here we introduce the feature based on parser’s score as: SCR(t) = −
100 . Score(t)
(6)
The reason why we do not employ score from parser directly lies in two aspects. First, the score is negative and it varies from tens to hundreds. We need to rescale it to a 0∼1⑥ interval approximately for SVM kernel function to work well. Second, the score is not in direct proportion to the quality of the sentence but affected by the length of the sentence because the probability is calculated through a serial of multiplication. The logarithm function has relaxed such situation to a great extent, and we are going further. Of course, this is a “crude” approximation, but we will show in the next section that this is substantial to translation quality
Experiments on Regression SVM Based Metric Experimental Settings
Among various machine learning approaches capable of building an MT evaluation metric, this paper chooses the regression support vector machine (SVM) to build our metric. The main difference between regression and classification approaches lies in that the output of regression approach is a continuous number that directly reflects the quality of a sentence, while the output of classification approach is a confidence score of a sentence being positive/negative. The definition of positive/negative sentences determines the meaning of the confidence scores, and only reflects a sentence’s quality in an indirect way. As described in recent literature, learning from regression is of a better quality than from classification[5,9,23] . The SVM toolkit we use is SVM-Light v6.01. To examine the contribution of the proposed linguistic feature in capturing the more general differences in the translation quality, the experiments are divided into two settings, according to two prospects of generalization ability, respectively: • Generalization across different years of news-wire corpus. • Generalization across different genres, different source languages, and different types of human judgments. For the first prospect, the training dataset is NIST 2003 Chinese MT evaluation dataset (NIST 03 for short). There are (7 × 919 =) 6433⑦ sentences generated by seven systems together with human assessment data which contain a fluency score and an adequacy score marked by two human judges for each sentence. To test the performance of the model we trained, we use NIST 2002 Chinese MT evaluation dataset (NIST 02 for short) which contains (3 × 878 =) 2634 sentences, and also fluency and adequacy scores. For the second prospect, we use two training dataset: NIST 03 dataset described above, and the union of WMT 2006 and WMT 2007 datasets (WMT 06/07
⑤ Logarithm of the probability of the sentence in an LM. ⑥ Actually we approximately got the interval 0∼10. ⑦ Our NIST 03 set contains the assessment of system E17, totaling 7 systems (instead of 6 as mentioned in other workers).
Mu-Yun Yang et al.: Improvement of MTE by Simple Linguistic Features
for short). WMT 06/07 dataset consists of (10176 + 5690 =) 15866 English sentences with human judgments, which are translated form French, German, Spanish, and Czech. The human judgments are of the same type with NIST 03 dataset, that is, a fluency score and an adequacy score, both in a 1∼5 scale. The test set we use is WMT 2008 dataset (WMT 08 for short), which consists of 9418 English sentences with human judgments translated from French, German, Spanish, Czech, and Hungarian. The type of human judgments of WMT 08 dataset is different from the datasets above. WMT 2008 workshop abandoned the 1∼5 scale adequacy and fluency scores. Instead, it considers the relative rank of overall quality or certain constituents’ quality of the machine translations, and the acceptability of certain constitute of a given machine translation. Thus, in the second setting, we have different source languages (Chinese and European languages), different genres (newswire, commentary, and general parallel corpus), and different types of human judgments between the training sets and the testing set. These differences make generalization of machine learning based metrics a great challenge. For score based human judgments such that in the NIST 02, NIST 03, and WMT 06/07 datasets, we normalized the scores following Blatz[13] , because there is bias in the distributions of different judges’ assessment. The normalized score is the average of the sum of the normalized fluency score and the normalized adequacy score. We also normalized fluency and adequacy scores individually. All the six features adopted are introduced in Subsection 2.2, we summarize them here for clarity: • Content words’ precision and recall after lemmatization defined in (1) and (2). • Noun-phrases’ case-insensitive precision and recall defined in (3) and (4). • Feature based on length comparison defined in (5). • Rescaled parser score defined in (6). Given these features extracted from each sentence in the training set and the normalized score obtained from the human assessments, we can train SVM models with the normalized scores as the target. Note that all SVM metrics were built using normalized scores, individual fluency and adequacy scores are only for performance validation. To determine the performance of a metric against score based judgments, we use Spearman rank correlation coefficient ρ which is distribution-independent. The Spearman coefficient is a real number ranging from −1 to +1, indicating perfect negative correlations or perfect positive correlations. Basically, as we will discuss later, there are only five different outcomes from human evaluation. Therefore,
61
there will be too many samples which have the same rank, so we adopted the modified formula: ³ P ´³ P ´ P n xi yi − xi yi r ³ ρ= r ³ ´ ³ ´ 2 P 2 P P 2 ´ ³ P ´2 n xi − xi n yi − yi (7) in which n = the number of samples in each dataset (same for both sets) and xi , yi are the rankings of samples in each set respectively. When there do not exist tied ranks, (7) reduces to its original form: P 6 d2i ρ=1− (8) n(n2 − 1) in which di = xi − yi . For WMT 08 dataset, we focus on the relative ranking of overall quality of translation results of interest. Consequently, we use the accuracy in predicting pairwise comparisons of translation results as the performance measure of the metrics on this dataset. Note that tie comparisons in human judgments are ignored in computing the accuracy. In experiments of this section and next section, we performed paired bootstrap re-samplings[24] to examine the reliability of differences between correlation results. Unless explicitly mentioned, the difference between correlations is significant at 95% level (p = 0.05). 3.2
Comparisons Within and Across the Year
In this subsection, we conduct the first experimental setting, to test the generalization ability of the SVM based metrics across different years of new-wire corpus. Intuitively, the features and the human scores are not in a linear correlation. We trained an SVM with Gaussian kernel, using NIST 2003 Chinese MT evaluation dataset. We hold out 1/6 of the dataset for parameter turning, then on the other 5/6 of the dataset, we perform a five-fold cross validation to verify the metric’s performance. In comparison, we introduce several metrics’ coefficients including BLEU, ROUGE-S and METEOR v0.6 together with correlation results of the six linguistic features. Performance of the approach described in [9] using the full feature set is also listed, but because we did not get the implementation since the implementation details are not well provided in [9], we are not able to report the correlation with individual adequacy/fluency scores or perform significant test on it. We will discuss it further in Section 5. The results are summarized in Table 1. We can see that metric combination approaches are showing their supremacy. First, the combination of the six linguistic
62
J. Comput. Sci. & Technol., Jan. 2011, Vol.26, No.1 Table 1. Summarization of Correlation Results w.r.t. Combination of Adequacy and Fluency (A+F), Adequacy (A) and Fluency (F) Scores in All the Experiments in Section 3 (Rows in bold font are combinations of features/metrics. All comparisons between row “Ling” and other rows (except rows marked “-Rank”, which we will discuss later) are 95% significant except results marked by “∗”, and all comparisons between column “A(dequacy)” and “F(luency)” are 95% significant.) Feature/Metric
A+F
LCWP LCWR NPP NPR LOS SCR
0.389 0.458 0.271 0.260 0.175 0.015
Ling Ling-Rank
0.485 0.464
BLEU ROUGE-S METEOR
NIST 03 A 0.389 0.482 0.284 0.275 0.187 −0.039
F
A+F
NIST 02 A
F
0.305 0.325 0.197 0.187 0.119 0.087
0.319 0.300 0.183 0.177 0.055 0.100
0.332 0.309 0.182 0.184 0.086 0.055
0.230 0.220 0.133 0.125 0.006 0.137
0.501 0.475
0.358 0.347
0.333 0.311
0.331 0.301
0.260 0.255
0.296 0.456 0.480*
0.303 0.476 0.499*
0.223 0.338 0.351*
0.133 0.322* 0.309
0.144 0.323* 0.301
0.097 0.248* 0.253*
nonLing
0.485*
0.499*
0.355*
0.324*
0.318*
0.261*
nonLing-Rank
0.485
0.503
0.356
0.313
0.308
0.252
All (Ling + nonLing)
0.510
0.527
0.377
0.359
0.351
0.289
All-Rank A & H 2007
0.500 0.520
0.513 –
0.371 –
0.332 0.309
0.321 –
0.276 –
features (Row of Ling) outperforms any single linguistic feature. Second, the combination of the six linguistic features outperforms any of METEOR, ROUGE-S or BLEU in most cases, except being statistically comparable with METEOR. According to column NIST 03 in Table 1, our metric reaches a relatively high correlation rate which outperforms or is comparable to popular non-linguistic⑧ metrics. That confirms our speculation that a small feature set can also result in a metric with a good correlation with human assessments. Then, to examine the capability of generalization of our metric, we perform training on the whole NIST 2003 Chinese dataset and testing on NIST 2002 dataset. From the column of NIST 02, we can see that the combination of the six linguistic features with the highest correlation of 0.333 outperforms METEOR and BLEU, and is statistically comparable with ROUGE-S. This indicates that the less linguistically motivated features can generalize as well across years under regression SVM framework. It is interesting that all correlation results with adequacy scores are significantly higher than those with fluency scores, except for the feature SCR, which correlates fluency scores significantly better. This is reasonable because all other features or metrics are reference oriented, while SCR is not.
From the results above, we can conclude that a small feature set can also achieve as good performance as large feature sets and common non-linguistic metrics. Furthermore, because the test data of the news texts from 2003 are unrelated to the training texts of 2002, it is reasonable to decide that the proposed model with less linguistic features generalizes better across years. 3.3
Linguistic Features and Non-Linguistic Metrics
Non-linguistic metrics have shown their high correlation rates and stability. Here we will examine the effect of combining linguistic information with non-linguistic metrics. We conduct experiments on the same datasets following the same approaches described in Subsection 3.2. The only difference lies in the feature set: in addition to the six linguistic features, we employ three non-linguistic metrics including BLEU, ROUGE-S and METEOR as features. We also combine these three metrics together using regression SVM to examine the performances. The correlation results are shown in Table 1. We can observe that linguistic features’ combination is statistically comparable with non-linguistic metrics’ combination. And when we combine linguistic metrics with non-linguistic metrics, it produces the best results.
⑧ Here the term “non-linguistic” is used only for distinguishing these three popular metrics from the six linguistic-motivated features.
Mu-Yun Yang et al.: Improvement of MTE by Simple Linguistic Features
However, one might suspect that this result is caused by the poor correlations of non-linguistic metrics in these two datasets (especially ∼ 0.1 of BLEU). We will show in the next section this result holds even when nonlinguistic metrics correlates very well. 3.4
Regression vs. Ranking
Since the SVM-ranking approach has been claimed more robust for MT evaluation metrics[10-11] , we also compare the performance between SVM-regression and SVM-ranking. We conduct the same experiment as previously mentioned, except using ranking approach. Then we compute Spearman correlations, and the results are shown in the rows marked by “-Rank” in Table 1. As shown in Table 1, the correlation results of ranking are significantly lower than regression in most cases, except for the cases marked with italic font, which are statistically comparable to regression approach. In this sense, the ranking approach is not superior to the regression approach, at least trained on the data of scaled scores instead of ranking orders. We also note that the disparity between these two approaches in NIST 02 is larger than that in NIST 03. We speculate that the ranking approach is good at picking out the subtle differences between the training data, at the cost of less sensitive to the testing data, which are not guaranteed to be identical to the trained samples. 3.5
single features/metrics such as METEOR and ROUGES. This observation indicates that our feature set as well as SVM based combination approach captures the key aspect of human judgment of translation outputs well, and that building accurate metrics with a small number of features is practical. Additionally, the ranking approach slightly outperforms the regression approach (0.641 vs. 0.637, and 0.646 vs. 0.640), indicating that the ranking approach may be more capable of capturing differences in pairs of examples. We also note that linguistic features such as LOS and SCR that correlate with score based human judgments poorly can achieve good performance even superior to the classical BLEU metric, confirming the discrimination power of these weakly correlated features. Table 2. Accuracy in Pair-Wise Comparison of Features and Metrics
Further Generalization
In the previous subsections, we have shown that SVM based metrics generalize well across different years of new-wire corpus, and the regression approach outperforms the ranking approach on the NIST 03 and NIST 02 datasets in which human judgments are scaled scores. Moreover, it is interesting to examine the performance of both regression and ranking approaches in another experimental setting, in which there are differences in genres, source languages, and types of human judgments. In the second setting, we train SVM regression and ranking models on the basis of all examples in the NIST 03 dataset and in the WMT 06/07 datasets, and test the performance, which is the accuracy in pairwise comparison, of different metrics using WMT 08 dataset. The experimental results are shown in Table 2, in which “Reg-x” and “Rank-x” denote SVM regression and ranking based metrics trained on dataset x respectively. Performances of single features, as well as certain metrics consisting in the official WMT 2008 report[27] , are also provided for comparison. According to Table 2, both the regression and ranking approaches generalized well in this dramatically different data background, clearly outperforming any
63
Feature
Accuracy
LCWR LCWP NPP NPR LOS SCR
0.544 0.479 0.452 0.356 0.458 0.492
METEOR ROUGE-S BLEU
0.622 0.602 0.427
Reg-NIST03 Reg-WMT06/07 Rank-NIST03 Rank-WMT06/07
0.637 0.640 0.641 0.646
ULCh ULC Meteor-baseline Svm-rank
0.562 0.559 0.512 0.459
The last 4 lines in Table 2 are adapted from the official report of WMT 2008[27] . The metric meteorbaseline is a variant of METEOR metric which is optimized towards adequacy scores. Intuitively, it should not have such significant divergence of performance from original METEOR metric in Table 2. One possible reason is that the human judgment set we use is different from that the WMT 2008 workshop used (indeed, the judgment set released by WMT is smaller than that described in [27]). Consequently, these results are for reference only, and cannot be directly compared to our experiments. 4
Re-Examination on Contribution of Features
4.1
Preliminary Settings
In this subsection, we introduce NIST 2004 Arabic
64
J. Comput. Sci. & Technol., Jan. 2011, Vol.26, No.1
MT Evaluation dataset which contains (8×249 =) 1992 sentences with a single adequacy score (1∼7) for each sentence to examine the contribution of individual features/metrics, especially the contribution of linguistic information based features. The reason that we use this dataset lies in four main aspects. First, non-linguistic metrics correlate with human assessments in this dataset much better than those in NIST 02 and NIST 03 datasets. In this case, whether linguistic information based features are able to contribute to the performance positively is worth discussing. Second, as mentioned in Section 3, most features/metrics correlates with adequacy scores better than with fluency scores, and adequacy score in NIST 2004 dataset ranging from 1 to 7 is more precise than from 1 to 5 in NIST and WMT datasets. Third, correlation differences between single features or metrics are not always statistically significant either in NIST 2003 or in NIST 2002. That means, in some cases, we cannot determine whether or not a feature/metric correlates better than another one. In contrast, all correlation differences between features/metrics in NIST 2004 are significant. We split the NIST 2004 dataset into five subsets, and then perform five-fold cross validation to examine Spearman correlation results of regression models. We use Gaussian kernel, and use SVM parameters tuned on NIST 2003 dataset. 4.2
Contribution from Linguistic Features
Although the six linguistic information based features are shown for a relatively good performance, we need to investigate the contribution of each feature. We compute each feature’s correlation to human assessments using Spearman correlation coefficient. Results are shown in Table 3. It is revealed that the linear correlations of some linguistic features with human assessments are weak. We can make two observations from this result: first, although the features are designed according to linguistic intuition to capture the translation quality, each of them coveys only a small factor instead of the whole decision on the translation quality. Second, the results further confirm the belief that human perception on translation quality is complex. And in this sense, combination is a proper choice in establishing stable translation metrics. Naturally, here the question is raised that whether these linguistic features can indeed help to improve the performance. To answer this question, we build three regression models using combinations of 1) six linguistic features; 2) three non-linguistic metrics METEOR,
ROUGE and BLEU; and 3) the linguistic features plus the non-linguistic metrics. Table 3. Correlation Results of Features/Metrics and Their Combinations (All correlation differences between single feature/metric are 95% significant. All correlation differences between combinations are 95% significant except that between “Ling” and “nonLing” which is 84% significant.) Feature
Spearman’s ρ
LCWR LCWP NPR NPP LOS SCR
0.670 0.553 0.450 0.432 −0.340 0.136
Ling
0.691
METEOR ROUGE-S BLEU
0.711 0.656 0.595
nonLing
0.712*
Ling + nonLing
0.740
The results are shown in Table 4. We can see the former question is reasonable because the combination of non-linguistic metrics performs better than that of linguistic features in a probability of 84% (though not statistically significant). In contrast, the performance is significantly improved when the two sets are combined together. Table 4. Correlation Results of Original Feature Set and Refined Feature Set Feature Set
Features
Original (9 features)
LCWP, LCWR, NPP, NPR, LOS, SCR, BLEU, METEOR, ROUGE-S
0.740
Refined (7 features)
LCWR, NPR, LOS, SCR, BLEU, METEOR, ROUGE-S
0.741
4.3
ρ
Refinement of Feature Set
In this subsection, we adopt a hill-climbing framework for detailed feature selection. It is common to observe conflicting and overlapping in nearly every practical feature set. How to refine the feature set is always important. In Table 4, the two recall based features NPR and LCWR outperform the corresponding precision based ones (NPP and LCWP). This may be caused by the relatively worse performance of NLP toolkits when encountering noisy machine translation outputs, which contain many incorrect NPs and CWs, which are the very basis of computing precision based features.
Mu-Yun Yang et al.: Improvement of MTE by Simple Linguistic Features
Therefore, we suspect that the features based on precision/recall are probably redundant. To answer this question, we introduce a hill-climbing strategy. We start from the whole combination of the 9 features/metrics mentioned in Table 4 with the highest correlation. Then, we try to minimize the feature set by removing one feature with the lowest Spearman correlation. If the performance of the model (averaged Spearman correlation in cross validation) increases at 50% significant level⑨ , we will keep the decreased feature set and continue removing features with the lowest Spearman correlation. If not, we will select another feature of which Spearman correlation is the second lowest to remove. We performed such a process iteratively until all features had been examined. Features that have been examined previously will never be examined again. The intention of doing this is mainly to reduce computational complexity. Table 4 summarizes the performance of regression models using original feature set and refined feature set. As we can find in Table 4, the performance of regression model increases slightly by 0.001 in Spearman coefficient with the refined feature set. However, the significant test shows a result of 66% significant, which is not persuasive enough to drop the features NPP and LCWP. That is to say, the six linguistic features are less likely to be redundant. During the refinement procedure, we found the features LOS and SCR have an apparent influence on the metric, whose absences cause at least 90%-significant performance decline. This shows that the linearly weakly correlated features are not useless: the implicit information they convey can be captured by non-linear transformations such as Gaussian kernel function. 5
Discussion
Incorporating linguistic information into the machine learning based metrics is desirable because people believe linguistic features convey, directly or not, the translation quality. However, a greedy integration of all available linguistic features is questionable. In stead of locating the key features via algorithmic means, this paper proposes a strategy of “simple feature in key aspects” for the automatic MT evaluation modeling. Compared with the previous 53 features adopted[9] , the much simpler six features generalize a better metric over different test data as well as require much less computation. Before the feature selection can be resolved without suffering from data over-fitting, the strategy “simple features in key aspects” may serve as a heuristic
65
for feature selection. Another hint about how to select features from a large feature space comes from the effect of linguistic features on those “non-linguistic” features. Although linguistic features can be combined as a successfully metric, the combination of those popular string based metrics may perform equally well (see Table 1, NIST 03 column). The true difference lies only in the open tests (see Table 1, NIST 02 column): linguistic feature combination seems more resistant to data-over fitting and generalizes well across different datasets. Considering the reality that linguistic features are suffering from noises from NLP tools, it may be more reasonable to develop evaluation metrics by a good combination of popular string level metrics, and assist them with proper linguistic features. Experiments show that this approach generalizes well even if there are differences in genres of corpus, source languages, and types of human judgments between the training sets and the testing set. Statistical significant test had been introduced to examine the reliability of differences by recent literatures. We deem that the smaller the test set is, the more validation it needs. In each fold of cross validation, the significant test on the small test set, which has not been performed in pervious approaches before, is necessary. In addition, to validate the performance difference in hill-climbing feature selection, significant test, which also has not been performed previously, gives a more convincing result. In addition, compared with the previous literature, the feature based on length comparison and the feature “rescaled parse score” are novel in automatic MT evaluation modeling. Also, we have shown that the parse score is a good alternative to LM. And it helps to avoid the errors in parse structure (the experiment to verify this claim is still on-going). In future studies, we can probe if further linguistic features, such as described in [25], can be augmented. But the language analysis beyond parsing is not widely available for languages other than English. The inclusion of those deep-level linguistics features would make the metrics more language dependent, which is practically prohibited for wide application. Therefore, another possible direction would be the proper combination of those popular string metrics with good enhancements from linguistic factors. 6
Conclusion
The feature engineering, which is essential to improve machine learning performance in most cases, is still an open issue. For the automatic MT evaluation
⑨ This is an aggressive removing strategy. Actually we found at 70% level or above, we are not able to remove any features.
66
metrics based on regressing, it is not always true that exhausting more and deeper linguistic features will improve the performance. This paper demonstrates that with only 6 features from linguistic intuition, the SVM regression can generates a metric outperforming most current metrics. Compared with the rich linguistic based approaches, the experiments show that the proposed metric achieves a comparable or better correlation with human assessments at a much lower computation cost. We also show through a hill-climbing strategy that our six linguistic features are informative and of little conflict. To account for this, we deem that the regression model is not thoroughly resistant to data overfitting. The proposed strategy of “simple feature in key linguistic aspects” is capable of reducing the risk of over-fitting, and produces more generalized regression results. This may be another version of the Occam’s Razor principle: with a different concern on the feature issue. Furthermore, we have noticed that the augmenting non-linguistic metrics with linguistic features will gain improved performance, and has good generalization ability even in a dramatically different data background. The ranking approach is not always as robust as claimed, but it may be more capable of capturing differences in pairs of examples according to the slightly better performance on the WMT 08 dataset. In the future, we will investigate how to combine the linguistics features — no more than necessary — with the popular metrics via a better model. References [1] Papineni K, Roukos S, Ward T, Zhu W J. BLEU: A method for automatic evaluation of machine translation. IBM Research Report, RC22176 (W0109-022), 2001. [2] George D. Automatic evaluation of machine translation quality using n-gram co-occurrence statistics. In Proc. the 2nd International Conference of Human Language Technology Research, San Diego, USA, Mar. 24-27, 2002, pp.138-145. [3] Kulesza A, Shieber S M. A learning approach to improving sentence-level MT evaluation. In Proc. the 10th International Conference on Theoretical and Methodological Issues in Machine Translation, Baltimore, USA, Oct. 4-6, 2004, pp.75-84. [4] Leusch G, Ueffing N, Nev H. CDER: Efficient MT evaluation using block movements. In Proc. the 13th Conference of the European Chapter of the Association for Computational Linguistics, Trento, Italy, Apr. 3-7, 2006, pp.241-248 [5] Russo-Lassner G, Lin J, Resnik P. A paraphrase-based approach to machine translation evaluation. Technical Report, LAMP-TR-125/CS-TR-4754/UMIACS-TR-2005-57, University of Maryland, College Park, USA, August. [6] Lin C Y, Och F J. Automatic evaluation of machine translation quality using longest common subsequence and skipbigram statistics. In Proc. the 42nd Annual Meeting of the Association for Computational Linguistics, Barcelona, Spain, Jul. 21-26, 2004, pp.605-612. [7] Banerjee S, Lavie A, Meteor: An automatic metric for MT
J. Comput. Sci. & Technol., Jan. 2011, Vol.26, No.1
[8]
[9]
[10]
[11]
[12]
[13]
[14]
[15]
[16]
[17]
[18] [19]
[20]
[21] [22]
[23]
[24]
evaluation with improved correlation with human judgments. In Proc. ACL Workshop on Intrinsic and Extrinsic Evaluation Measures for Machine Translation and/or Summarization, Ann Arbor, USA, Jun. 29-30, 2005, pp.65-72. Corston-Oliver S, Gamon M, Chris B. A machine learning approach to the automatic evaluation of machine translation. In Proc. the 39th Annual Meeting of the Association for Computational Linguistics, Toulouse, France, Jul. 9-11, 2001, pp.148-155 Albrecht J S, Hwa R. A re-examination of machine learning approaches for sentence-level MT evaluation. In Proc. the 45th Annual Meeting of the Association of Computational Linguistics, Prague, Czech, Jun. 23-30, 2007, pp.880-887. Ye Y, Zhou M, Lin C Y. Sentence level machine translation evaluation as a ranking. In Proc. ACL Second Workshop on Statistical Machine Translation, Prague, Czech, Jun. 23-30, 2007, pp.240-247. Duh K. Ranking vs. regression in machine translation evaluation. In Proc. ACL 3rd Workshop on Statistical Machine Translation, Columbus, USA, Jun. 15-20, 2008, pp.191-194. Gim´ enez J, M` arquez L. Linguistic features for automatic evaluation of heterogenous MT systems. In Proc. ACL 2nd Workshop on Statistical Machine Translation, Prague, Czech, Jun. 23-30, 2007, pp.256-264. Blatz J, Fitzgerald E, Foster G, Gandrabur S, Goutte C, Kulesza A, Sanchis A, Ueffing N. Confidence estimation for machine translation. Natural Language Engineering Workshop Final Report, Johns Hopkins University, 2003. Amig´ o E, Gim´ enez J, Gonzalo J, M` arquez L. MT evaluation: Human-like vs. human acceptable. In Proc. the COLING/ACL 2006 Main Conference Poster Sessions, Sydney, Australia, Jul. 17-21, 2006, pp.17-24. Nießn S, Och F J, Leusch G, Ney H. An evaluation tool for machine translation: Fast evaluation for MT research. In Proc. the 2nd International Conference on Language Resources & Evaluation, Athens, Greek, May 30-Jun. 2, 2000, pp.39-45. Tillmann C, Vogel S, Ney H, Zubiaga A, Sawaf H. Accelerated DP based search for statistical translation. In Proc. European Conference on Speech Communication and Technology, Rhodes, Greece, Sept. 22-25, 1997, pp.2667-2670. Gim´ enez J, M` aquez L. Linguistic features for automatic evaluation of heterogeneous MT systems. In Proc. ACL Second Workshop on Statistical Machine Translation, Prague, Czech, Jun. 23-30, 2007, pp.256-264. Catford J. A Linguistic Theory of Translation. London: Oxford University Press, 1965. Collins M. Head-driven statistical models for natural language parsing [Ph.D. Dissertation]. University of Pennsylvania, 1999. Gale W A, Church K W. A program for aligning sentences in bilingual corpora. Computational Linguistics, 1993, 19(1): 75-102. Abramowitz M, Stegun I. Handbook of Mathematical Functions. US Government Printing Office. 1964. Liu D, Gildea D. Syntactic features for evaluation of machine translation. In Proc. ACL Workshop on Intrinsic and Extrinsic Evaluation Measures for Machine Translation and/or Summarization, Ann Arbor, USA, Jun. 25-30, 2005, pp.25-32. Quirk C B. Training a sentence-level machine translation confidence measure. In Proc. the 4th International Conference on Language Resources and Evaluation, Lisbon, May, 2004, pp.825-828. Koehn P. Statistical significance tests for machine translation evaluation. In Proc. Conference on Empirical Methods in Natural Language Processing, Barcelona, Spain Jul. 25-26, 2004.
Mu-Yun Yang et al.: Improvement of MTE by Simple Linguistic Features [25] Gim´ enez J, M` arquez L. A smorgasbord of features for automatic MT evaluation. In Proc. ACL Third Workshop on Statistical Machine Translation, Columbus, USA, Jun. 15-20, 2008, pp.195-198. [26] Zhu X, Yang M, Wang L, Wang J, Li S. A quantitative analysis of linguistic factors in human translation evaluation. In Proc. the 2nd International Symposium on Knowledge Acquisition Modeling (KAM 2009), Wuhan, China, Nov. 30-Dec. 1, 2009, pp.410-413. [27] Callison-Burch C, Fordyce C, Koehn P, Monz C, Schroeder J. Further meta-evaluation of machine translation. In Proc. ACL Third Workshop on Statistical Machine Translation, Columbus, USA, Jun. 15-20, 2008, pp.70-106.
Mu-Yun Yang received his Ph.D. degree in computer science and engineering from Harbin Institute of Technology in 2003. He is an associate professor in the School of Computer Science and Technology, Harbin Institute of Technology (HIT). He is a member of CCF and IEEE. His research interests include machine translation, information retrieval and e-learning. Shu-Qi Sun is a Ph.D. candidate in School of Computer Science and Technology, Harbin Institute of Technology. His research interests include machine translation and machine learning.
Jun-Guo Zhu is a Ph.D. candidate in School of Computer Science and Technology, Harbin Institute of Technology. His research interests include natural language processing and machine translation.
67 Sheng Li is a professor of Harbin Institute of Technology. He is the director of MOE-MS Key Lab of NLP & Speech in HIT. He is a standing director of Chinese Information Processing Society. His research interests include machine translation, information processing and natural language processing.
Tie-Jun Zhao is a professor of Harbin Institute of Technology. He is the vice-president of the School of Computer Science and Technology in HIT. He is a member of council of Chinese Information Processing Society, a senior member of CCF and a member of IEEE. His research interests include machine translation, content-based Web information processing, and artificial intelligence. Xiao-Ning Zhu is a master candidate in School of Computer Science and Technology, Harbin Institute of Technology. His research interests include machine translation and information retrieval.