JOURNAL OF NETWORKS, VOL. 9, NO. 3, MARCH 2014
523
Improving Bee Algorithm Based Feature Selection in Intrusion Detection System Using Membrane Computing Kazeem I. Rufai, Ravie Chandren Muniyandi, and Zulaiha A. Othman Research Center for Software Technology and Management (SOFTAM), Faculty of Technology and Information Science, University Kebangsaan Malaysia, 43600 UKM Bangi, Selangor, Malaysia Email:
[email protected], {ravie, zao}@ftsm.ukm.my
Abstract—Despite the great benefits accruable from the debut of computer and the internet, efforts are constantly being put up by fraudulent and mischievous individuals to compromise the integrity, confidentiality or availability of electronic information systems. In Cyber-security parlance, this is termed ‘intrusion’. Hence, this has necessitated the introduction of Intrusion Detection Systems (IDS) to help detect and curb different types of attack. However, based on the high volume of data traffic involved in a network system, effects of redundant and irrelevant data should be minimized if a qualitative intrusion detection mechanism is genuinely desirous. Several attempts, especially feature subset selection approach using Bee Algorithm (BA), Linear Genetic Programming (LGP), Support Vector Decision Function Ranking (SVDF), Rough, Rough-DPSO, and Mutivariate Regression Splines (MARS) have been advanced in the past to measure the dependability and quality of a typical IDS. The observed problem among these approaches has to do with their general performance. This has therefore motivated this research work. We hereby propose a new but robust algorithm called membrane algorithm to improve the Bee Algorithm based feature subset selection technique. This Membrane computing paradigm is a class of parallel computing devices. Data used were taken from KDD-Cup 99 Dataset which is the acceptable standard benchmark for intrusion detection. When the final results were compared to those of the existing approaches, using the three standard IDS measurements-Attack Detection, False Alarm and Classification Accuracy Rates, it was discovered that Bee Algorithm-Membrane Computing (BA-MC) approach is a better technique. This is because our approach produced very high attack detection rate of 89.11%, classification accuracy of 95.60% and also generated a reasonable decrease in false alarm rate of 0.004. Receiver Operating Characteristic (ROC) curve was used for results interpretation. Index Terms—Membrane Computing; Bee Algorithm; Feature Selection; Intrusion Detection System; Cybersecurity
I.
INTRODUCTION
It is an understatement to say that we currently live in an information-driven world. Pathetically though, as technology improves, information insecurity also increases. In fact, information insecurity has become the © 2014 ACADEMY PUBLISHER doi:10.4304/jnw.9.3.523-529
bane of today’s underdevelopment. Hence, the computer and the networks suffer immeasurable attacks and intrusion and are therefore susceptible to high vulnerabilities. Several approaches had been used in the past to detect and prevent these intrusions but have not been fully sufficient to bring the rate of penetration to lowest ebb [1, 2]. Membrane Computing (MC) which is otherwise called P-system has proved to be a versatile formal model for solving NP hard computational problems despite its infancy stage. Its areas of application include; Boolean Satisfiability (SAT) problems and the Traveling Salesman Problem (TSP) [3]. Also, going through the literature, it is noteworthy to report the efforts of Leporati and Ferretti [4] on firewalls as it was the first attempt of the application of membrane computing to cyber security. Furthermore, Intrusion Detection System (IDS) according to [5, 6, 12], is viewed as a system which constantly and dynamically monitors a system with the primary aim of identifying and reporting unusual activities or actions which are symptomatic of an attack. If these supposedly attacks are not checkmated, the aftermath on a system would be: (i) compromise of its integrity, (ii) denial of its availability and (iii) inefficiency. Intrusion detection is based on the principle that intruder features are different from the normal behaviours [12]. It can be divided into two general types known as anomaly detection (otherwise called positive approach) and misuse or signature detection system (which is also known as negative approach) [13]. While a signature-based IDS looks for known signature attacks (misuse of the system resources) by pattern matching technique, an anomaly-based IDS detects threats by determining whether the activity deviates significantly from the known normal behaviour [12, 13]. Anomaly detection detects threats by determining whether the activity deviates significantly from the known normal behaviour. Misuse detection detects threats based on whether the signature of the behaviour matching a known threat pattern or not [12]. The quality of a typical IDS is usually impacted by factors such as feature selection, data normalization and classification techniques. Hence, the motivation behind this work is the enhancement of the efficiency of
524
JOURNAL OF NETWORKS, VOL. 9, NO. 3, MARCH 2014
prediction rates (Classification Accuracy Rate, Attack Detection Rate and False Alarm Rate) by adopting feature selection (FS) method. This hinges on the fact that some features may contain false correlations which hinder the process of detecting intrusions, while some others may have redundant and extraneous features which increase computation time, and thereby negatively affecting the accuracy of an IDS. Therefore, the focus of this paper is to make an exposé into the selection of feature subset in IDS with a view to improving the Bee Algorithm (BA) approach using MC paradigms of communication and parallelism. This will invariably help to make an efficient prediction. The following sections of the paper are arranged thus: Section II briefly discusses membrane computing without leaving behind its communication rules and how they are applied. Section III dwells on Feature Selection with specific emphasis on Bee Algorithm. The fourth section discusses our proposed approach, that is, BA-MC technique. The fifth section highlights the dataset used, methodology, performance measurement and experimental set up. Section VI presents the experimental results with its analysis and justification. The final section concludes through summary. II.
MEMBRANE COMPUTING
Membrane computing emanated from natural computing (i.e computing which concerns itself with what is going on in nature and inspired by nature). Hence, membrane computing enriches the models of molecular computing by providing a spatial structure for molecular computations, inspired by the membrane structure and functioning of living cells. It is inherently and maximally a parallel computing model because communication between the multisets and objects within the regions and compartments of a membrane takes place concurrently. Usually, membranes which form hierarchical structure could be dissolved, divided, created and their permeability is modifiable [7]. The communications between compartments and with the environment play an essential role in the processes. Formally therefore, a membrane system is machinery with a construct: Π = (O, μ, w1,…, wm , R1 , …, Rm , io ), where: O is an alphabet, its elements are called objects; μ is a membrane structure consisting of m membranes, with the membranes (and hence the regions) labeled with 1, 2, …, m; m is called the degree of Π; wi, 1 ≤ i ≤ m , are strings which represent multisets over O associated with the regions 1, 2, … ,m of μ; Ri , 1 ≤ i ≤ m, are finite sets of rules over O; Ri is associated with the region i of μ; io ∈ {1, 2, …, m} is a the label of an elementary membrane (the output membrane). A. Communication Rule in Membrane Computing The basic model of membrane computing consists of a hierarchical structure composed by several membranes, embedded into a main membrane called the skin. The
© 2014 ACADEMY PUBLISHER
activities of these membranes are governed by some welldefined rules of which the communication rules are part of. The two classes of communication rules are: (i) Sendin Communication rule and (ii) Send-out Communication rule. A.1. Send-in Communication Rule: This is defined by the relation; a[]h [b]h where h ∈ H, α, β ∈ {+,−, 0}, a, b ∈ O. This means that an object which is introduced into the membrane may possibly be modified during the process. So, the polarization of the membrane can also be modified, but not its label. Here, the initial charge α is changed to β A.2. Send- Out Communication Rule: Under this rule, we have: [a]h []h b where h ∈ H, α, β ∈ {+,−, 0}, a, b ∈ O. Implying that when an object is released from the membrane, it is possible that this object is modified. The initial charge which is α, is changed to β. Also, the label is not affected B. Application of Membrane Computing Rules Generally, with a number of well-defined steps, a membrane computing always starts with an initial configuration where the input data is encoded. The transition from one configuration to the next is performed by applying rules to the objects inside the regions (the rules to be used are chosen randomly). Then thereafter, the system reaches a state called halting computation when it is no longer visible to apply any rule. Each step involves iterating through all membranes in the system and the application of rules, which occurs in both maximally parallel and non-deterministic manner [7, 10]. Basically, each membrane possesses a collection of evolution and communication rules, which dictate how the content of membranes evolves and define the intermembrane communications. When a rule is applied within a system, it causes it to evolve to a new state. However, before a rule is functional, some conditions must be met, such as required set of input objects (symbols or catalysts). So, when applying a rule within a membrane, the following steps are usually adopted: 1. Assign symbols from a membrane’s content to the rule’s inputs. 2. If all inputs are satisfied, remove all assigned symbols from membrane. 3. Create output symbols and hold until all rule assignment, for all membranes, has taken place. 4. Add output symbols to targeted membranes. 5. Dissolve membranes as necessary. Still on the application of rules, the membrane structure S such as in Fig. 1 above should be parenthesized thus: [ ]1, [ [ ]2 [ ]4 [ ]3 ]1, [ [ ]2 [ [ ]7 [ ]5 [ ]6 ]4 [ ]3 ]1, [ [ ]2 [ [ ]7 [ ]5 [ [ ]8 [ ]9 ]6 ]4 [ ]3 ]1. This now gives: [ [ ]2 [ [ ]7 [ ]5 [ [ ]8 [ ]9 ]6 ]4 [ ]3 ]1 The structure of Figure 1 is also captured it the tree diagram below:
JOURNAL OF NETWORKS, VOL. 9, NO. 3, MARCH 2014
525
It makes training and applying a classifier more efficient by decreasing the size of the effective vocabulary. Feature selection often increase classification accuracy by eliminating noise features. It improves model interpretability.
Figure 1. A Tree diagram
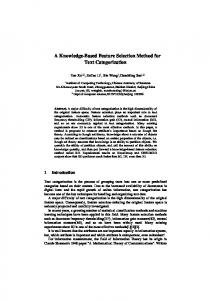
C. Simulating with Membrane Computing All the variants (cell-like, tissue-like and neural-like) of membrane computing share the same simulation structure. So, a typical membrane computing structure is made up of three parts., namely: (i) the input which comprises of the user and the definition of the membrane computing to be executed (ii) The core – which is the computer system’s processor where the manipulation of the membrane computing earlier defined takes place (iii) output- where relevant information is generated and given out to the user (See Figure 2). This implies that in a membrane computing, like any other system, ideas and problems to be solved emanate from man and the final result generated is made used by him.
A. Distinctions between Filter and Wrapper Approaches In all, feature selections are often grouped into two, namely; filter and wrapper approaches [5,6,12]. By adopting a filter is a classifier agnostic pre-selection methods which are independent of the applied machine learning algorithm. The selection of appropriate features is based on distance, information, dependency and consistency measures in the feature space and is carried out completely independent from the classifier deployed. On the other hand, wrapper is a feedback method which incorporates machine learning algorithm, in sharp contrast, to the filter approach. Wrapper approach relies on the performance of a specific classifier to evaluate the quality of a set of features [14] .Hence, it seen to be more computationally demanding than filter method. B. Bee Algorithm in Feature Selection The Bees Algorithm (BA) is a new population-based search algorithm, first developed in 2005. The algorithm mimics the food foraging behaviour of swarms of honey bees. In its basic version, the algorithm performs a kind of neighbourhood search combined with random search and can be used for optimization problems [19]. The BA pseudo codes are captured in the figure 3 :
Figure 2. Structure of a membrane computing simulator
III.
FEATURE SELECTION IN IDS
The quality of a typical IDS is usually impacted by factors such as feature selection, data normalization and classification techniques. Hence, in this work, feature selection (FS) helps to select a subset of relevant features occurring in a training set so as to build robust learning model to enhance the efficiency of prediction rate (Classification Accuracy Rate, Attack Detection Rate and False Alarm Rate). This hinges on the fact that some features may contain false correlations which hinder the process of detecting intrusions, while some others may have redundant and extraneous features which increase computation time, and thereby negatively impacting the accuracy of an IDS. Generally therefore, FS may be viewed as a method of replacing a set of complex classifiers by using all features b, with a simpler one by using a subset of the features a, whereby a < b. Its benefits include:
© 2014 ACADEMY PUBLISHER
Figure 3. Pseudo codes for bee algorithm (BA)
Osama and Zulaiha [5] highlighted the steps involved in the application of Bee algorithm to feature selection thus: (Initialization) randomly generates initial scout bee population. Measure the fitness of all the bees in the population. Where the accuracy of the Support Vector Machine (SVM) classification and all the chosen features are utilized to calculate the fitness function. The bees that have highest fitness are selected as elite bees and sites visited by them are chosen for neighbourhood search. The algorithm conducts searches in the neighborhood of the selected sites. Mutation operator was used for neighbourhood search around elite bees’ position.
526
JOURNAL OF NETWORKS, VOL. 9, NO. 3, MARCH 2014
The algorithm recruits bees around selected site, assigning more bees to search near to the best e sites. The fitness of each bee is then evaluated. For each site only, the bee with the highest fitness will be selected to form bee population. The algorithm conducts searches in the neighborhood of the selected sites. Mutation operator was used for neighborhood search around elite bees’ position. The algorithm recruits bees around selected site, assigning more bees to search near to the best e sites. The fitness of each bee is then evaluated. For each site only, the bee with the highest fitness will be selected to form bee population. These steps are iterated until a stopping criterion is met and the bee that has feature subset with the best fitness is selected. Otherwise, the algorithm will continue to generate new population of scout bees. In this algorithm the fitness value is allocated as stopping criteria. At the end of all the iterations, the colony will have two parts of its new population representatives from each selected patch and other scout bees are assigned to carry out random searches. At the end, SVM is trained based on the best feature subset. Then, the testing datasets are used for testing purpose. IV.
THE PROPOSED APPROACH
A. Membrane Computing in Feature Selection Being a model which is inspired by biology, MC uses objects as transporting mechanisms through membranes. So, because a typical membrane structure consists of both internal and skin membranes, the membrane algorithm is also made up of sub-algorithms which interact based on its communication rules. Membrane communications only occur in parallel between adjacent regions. So, during implementation, MC algorithm is designed to have two phases. The first phase deals with activities in the sub-algorithms where initial solutions are generated. The second phase captures the proceedings within the skin membrane (otherwise called output membrane) which garners the initial solutions as its input to generate the final solution. Invariably, after necessary manipulations, better solutions are generated as shown in Figure 4.
Figure 4. Solutions’ generation in MC
Furthermore, the following figure 5 presents the Pseudo Codes for Membrane Computing: Hence, the pseudo codes above are explained thus: Step 1: We first initialize the 41 subsets randomly in membranes Step 2: We execute the Bee Algorithm codes as contained in Figure 3 above by running it concurrently in the different membranes for x number of times
© 2014 ACADEMY PUBLISHER
Step 3: Best solutions are collected from these individual membranes, sent into and mixed in the output membrane. Step 4: In the output membrane, the BA codes are run once again. Step 5: After running for a specific number of times, then collect the best solution which serve as the final solution.
Figure 5. Pseudo Codes for Membrane Computing TABLE I.
FEATURES OF KDD-CUP DATASET
Lab -el Feature Name
Lab -el Feature Name
Lab -el Feature Name
A duration B protocol_type C service D flag E src_byte F dst_byte G land H wrong_ fragment I urgent J hot K num_failed_ login L logged_in M um_promised N root_shell O su_attempted
P num_root Q num_file_creations R num_shells S num_access_files T num_outbound_ cmds U is_host_login V is_guest_login W count X srv_count Y serror_rate Z srv_serror_rate AA rerror_rate AB srv_rerror_rate AC same_srv_rate AD diff_srv_rate
AE srv_diff_host_rate AF dst_host_count AG dst_host_srv_count AH dst_host_same_srv_ rate AI dst_host_diff_srv_rate AJ dst_host_same_src_ port_rate AK dst_host_srv_diff_ host_rate AL dst_host_serror_rate AM dst_host_srv_serror _ rate AN dst_host_rerror_ rate AO dst_host_srv_rerror_ Rate
V.
METHODS AND MATERIALS
The experiments were carried out on subsets from KDD Cup 1999 dataset which was pre-processed by the Columbia University and distributed as part of the UCI KDD Archive. This dataset has been chosen for this experiment because it is the generally accepted standard dataset for IDS which allows for easy comparison with previous works. Also, if any raw datasets are used for classification, there is every tendency that correct results may not be obtained at the end of the experiments because the classifier may get confused due to availability of redundancy. Java was adopted as the implementation programming language. Support Vector Machine which is a supervised machine learning algorithm was used for classification. We made use of the Library for Support Vector Machines LIBSVM [20], which is the one of the most widely adopted implementations of support vector machines. For each TCP/IP connection, 41 various quantitative and qualitative features were extracted along with one
JOURNAL OF NETWORKS, VOL. 9, NO. 3, MARCH 2014
527
class label. Table 1 shows all the features labeled A-AO found in the dataset. A. Experimental Setup: The experiments used CORE i5-2450M CPU 2.50 GHZ with 4.00 GB RAM, Windows 7 Home Premium. While Java was adopted as the implementation programming language, three membranes were used including an output membrane. B. Parameter and Performance Measurement: The fitness accuracy was calculated using, equation (1) below by [18]: R ( D) *
|C || R| |C |
(1)
where R( D) = The average of classification accuracy rate got by carrying out 10-fold Cross-Validation (10FCV) with the SVM classifiers, on the training dataset with attribute set R selected from feature subset in the population to decision D. |R| = The ‘1’ number of position or the length of selected feature subset. |C| = The total number of features. α and β are two parameters related to the significance of classification quality and subset length. α ∈ [0,1] and β = (1-α ). Furthermore, for these experiments, the following parameters were adopted: TABLE II.
PARAMETERS
Parameters # of membrane # of objects # of iterations # of Output membrane
Value 4 41 100 1
C. Performance Measurement: Here, evaluation was done based on three performance metrics which are the Classification Accuracy Rate (CAR), Attack Detection Rate (ADR) and False Alarm Rate (FAR). CAR: This is defined as the portion of True Positives and True Negatives in the population of all instances. ADR: This is defined as the number of attack instances detected by the system(True Positive) divided by the total number of attack instances present in the test set. FAR: Is defined as the number of 'normal' patterns classified as attacks (False Positive) divided by the total number of 'normal' patterns. Usually, in calculating these performance metrics in IDS, the Confusion Matrix is adopted and they are mathematically derived as: TP TN TP TN FP FN
(2)
ADR
TP TP FP
(3)
FAR
FP FP TN
(4)
CAR
True Positive (TP): A legitimate attack which triggers an IDS to produce an alarm.
© 2014 ACADEMY PUBLISHER
False Positive (FP): An event signaling an IDS to produce an alarm when no attack has taken place. False Negative (FN): A failure of an IDS to detect an actual attack. True Negative (TN): When no attack has taken place and no alarm is raised. VI.
RESULTS AND DISCUSSIONS
Since the type of features selected has consequential effect on the overall intrusion detection, the fitness of such features should therefore be established initially. Therefore, Table III below shows the results of different feature subsets and their fitness obtained after 10 independent runs. The 9th run produced the highest fitness by returning 79.77, hence it was used for the training of our SVM classifier. TABLE III. Run# 1. 2. 3. 4. 5. 6. 7. 8. 9. 10.
FITNESS ACCURACY
Better Solution B,C,H,M,Q,R,W,AC,AD,AK,AM A,C,F,L,X,Z,AA,AC,AF,AJ,AK A,C,H,V,W,AC,AF,AJ,AK,AO C,D,H,J,M,S,W,AC,AF,AG,AJ,AK B,H,U,V,X,Y,AC,AF,AI,AK,AM,AO B,C,H,I,M,O,X,Z,AF,AK,AN C,H,J,L,W,Z,AC,AD,AF,AG,AJ,AK,AN B,C,D,H,Q,S,W,AC,AK,AM B,C,H,M,T,X,AF,AK,AM,AN C,H,I,N,W,Y,AB,AD,AE,AF,AJ,AK
Fitness 78.66 79.16 79.23 79.27 78.19 79.54 79.47 78.79 79.77 78.98
An incoming data into a system is either an intrusive one or otherwise, hence, Table IV and Figure 6 depict the comparison of the obtained Classification Accuracy Rate (CAR) of BA-MC with other existing methods. Based on the feature subsets selected in Table III above, the mean values (x) for every method were subsequently calculated and the results show that BA-MC is the best of all by yielding 95.60. TABLE IV. Method SVDF LGP MARS Rough Set Rough-DPSO BA BA-MC
COMPARISON OF CLASSIFICATION RATES Data2 82.60 75.37 70.47 81.65 71.85 85.25 92.40
Data3 89.83 94.60 92.65 89.56 93.23 96.65 97.00
Data3 84.98 87.65 90.87 87.18 92.07 98.20 97.40
Mean(x) 85.80 85.87 84.66 86.13 85.72 93.36 95.60
Figure 6. Comparison of classification rates using bar chart
Furthermore, an IDS is not only measured on how fast it is able to report an attack, but also in ascertaining that the alarm so generated is true. In the subsequent Tables V
528
JOURNAL OF NETWORKS, VOL. 9, NO. 3, MARCH 2014
and VI, the Attack Detection Rate (ADR) and False Alarm Rate (FAR) of all the approaches including our BA-MC, were compared. Although, it is seen that BA has the highest mean value of 1.11 above ours in the ADR, but suffice to mention however that our BA-MC approach also produced very high detection rate of 89.11. Furthermore, our MC approach outperformed all the other approaches by returning 0.004 as the mean value for the false alarm rate. This is a significant decrease when compared to others. TABLE V.
ADR OF THE METHODS
Methods
Data2
Data3
Data4
Mean(x)
SVDF MARS Rough Set Rough-DPSO BA BA-MC
53.80 62.90 50.60 61.40 81.50 80.62
76.46 89.40 75.46 90.02 93.42 93.07
62.64 85.50 68.08 86.19 95.75 93.63
64.30 79.27 64.71 79.20 90.22 89.11
TABLE VI. Methods SVDF MARS Rough Set Rough-DPSO BA BA-MC
METHODS FAR OF THE METHODS
Data2 1.050 25.200 0.700 22.000 12.620 0.009
Data3 0.000 4.950 0.000 4.390 0.900 0.001
Data4 0.120 5.500 0.080 3.900 0.160 0.001
Mean(X) 0.390 11.880 0.260 10.100 4.560 0.004
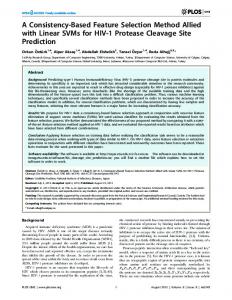
Figure 7 depicts a typical Receiver Operating Characteristics (ROC) curve. Here, the false alarm rate is plotted against attack detection rate. Performance and accuracy are usually measured by the way a graph line tilts towards the top left corner of the y-axis, that is (0,1). This is a condition when an IDS returns 100% ADR and 0% FAR. So, a ROC curve helps to visualize trade-offs between ADR and FAR in intrusion detection models [21]. 100 SVDF MARS Rough Set Rough DPSO BA BA-MC
95
Attack Detection Rate
90 85 80 75 70 65 60 55 50
0
5
10
15 False Alarm Rate
20
25
30
Figure 7. Comparison of the approaches using a ROC curve
Therefore, from Figure 7, it is evidently clear that our approach depicted with line shows a better performance. This is because it is almost directly positioned on the y-axis and a few distance away from the top left corner. The justification for the superiority of our approach, over other known methods could be premised on: © 2014 ACADEMY PUBLISHER
The very high Classification Accuracy Rate The extremely low False Alarm Rate VII. CONCLUSION In this paper, we presented a summary of part of our recent work on IDS’s subset feature selection. Simulation results demonstrated that Membrane Computing paradigm is a better tool for enhancing Bee Algorithm based feature subset selection method in IDS. With the KDD-Cup datasets used in the experiments, we were able to establish that, MC has the potential of considerably increasing Classification Accuracy Rate and consequently decreasing the False Alarm Rate. Generally, our approach returned as high as 89.11% ADR. Quite remarkably however, when the results are compared to other previous approaches so far, it has the highest CAR with an average value of 95.60% and the lowest FAR of 0.004. ACKNOWLEDGMENT The authors wish to thank the Faculty of Technology and Information Science, of the Universiti Kebangsaan Malaysia (National University of Malaysia). This work was supported in part by a grant from Grant Code: FRGS/1/2012/SG05/UKM/02/3. REFERENCES [1] Debar H., Dacier M., Wespi A., “Towards a Taxonomy of Intrusion-Detection Systems” Computer Networks, 31 (8), pp. 805–822, 1999. [2] Bace R. G., Intrusion Detection: Defining Intrusion Detection. Macmillan Technical Publishing, 2000. [3] Wang J., Peng H., “Adaptive Fuzzy Spiking Neural P systems For Fuzzy Inference and Learning”. In Proc. Eight Brainstorming Week on Membrane Computing, Sevilla, Spain. pp. 235-248, 2010. [4] Leporati A., Ferretti C., “Modeling and Analysis of Firewalls by (Tissue-like) P Systems”. In Proc. Eight Brainstorming Week on Membrane Computing, Sevilla, Spain. pp. 177-188, 2010. [5] Osama A., Zulaiha A. O., Bees Algorithm for Feature Selection in Network Anomaly Detection. Journal of Applied Sciences Research, 8(3) pp. 1748-1756, 2012. [6] Folorunso, O., Akande O.O., Ogunde A.O., Vincent O.R., "ID-SOMGA: A Self Organising Migrating Genetic Algorithm-Based Solution for Intrusion Detection". Computer and Information Science, 3(4) pp. 80-92, 2010. [7] Pӑun Gh., Rozenberg G., Salomaa A., eds. Handbook of Membrane Computing. Ox- ford University Press, 2010. [8] Chebrolu, S., Abraham A., Thomas J. P., Feature Deduction and Ensemble Design of Intrusion Detection, Systems. Journal of Computers and Security, 24(4) pp. 295-307, 2005. [9] Hofmann, A., Horeis, T., Sick B., Feature Selection for Intrusion Detection: An Evolutionary Wrapper Approach. In: International Joint Conference on Neural Networks, Budapest, Hungary, 2004. [10] Păun Gh., "Introduction to Membrane Computing". Applications of Membrane Computing. Springer Berlin Heidelberg. pp. 1–42, 2006. ISBN 978-3-540-29937-0. [11] Zandron C., Claudio F., Giancarlo M., "Solving NPComplete Problems Using P Systems with Active Membranes". Unconventional Models of Computation. pp. 289–301, 2000.
JOURNAL OF NETWORKS, VOL. 9, NO. 3, MARCH 2014
[12] Christine D., Hyun Ik. J., Wenjun Z., "A New Data-Mining Based Approach for Network Intrusion Detection," Seventh Annual Communication Networks and Services Research Conference, 2009. [13] Andres G.K J., Wilfried N. G., On the Relationship between Feature Selection and Classification Accuracy JMLR: Workshop and Conference Proceedings 4: 90-105, 2008. [14] Camera V. B., Tudor M., Rodica P., Improving Classification Accuracy through Feature Selection. Intelligent Computer Communication and Processing. ICCP 2008. 4th International Conference on pp. 25-32, 2008. [15] Mukkamala, S., Sung A., Abraham A., Ramos V., Intrusion Detection Systems Using Adaptive Regression Spines. Enterprise Information Systems VI: 211-218, 2006. [16] Mukkamala, S., Sung A., Abraham A., Intrusion detection using ensemble of soft computing paradigms. In: Third international conference on intelligent systems design and applications. Intelligent systems design and applications, advances in soft computing. Germany: Springer Verlag, pp. 239-48, 2003. [17] Zainal, A., Maarof M., Shamsuddin S., Feature selection using rough-DPSO in anomaly intrusion detection. Computational Science and Its Applications–ICCSA 2007, pp. 512-524, 2007. [18] Torrano C., Perez-Villegas A., Alvarez G., An AnomalyBased Approach for Intrusion Detection in Web Traffic. Direct, 5 pp. 446–454, 2010 [19] Pham, D.T., A. Ghanbarzadeh, E. Koc, S. Otri, S. Rahim, M. Zaidi, The bees algorithm—a novel tool for complex
© 2014 ACADEMY PUBLISHER
529
optimisation problems. In: Proceedings of IPROMS 2006 conference, Cardiff, UK, pp. 454-461, 2006. [20] Chih-Chung C., L. Chih-Jeh, LIBSVM: A library support vector machines, Software available at: http://www.csie.ntu.edu.tw/~cjlin/libsvm, 2001. [21] Fawcett T., An Introduction to ROC Analysis, Pattern Recognition Letters, Vol. 27 No. 8, pp. 861-874. 2006.
Kazeem I. Rufai is a Nigerian academics who is currently pursuing his PhD degree at the National University of Malaysia. His research interest is in optimizing Intrusion Detection System using Membrane Computing paradigm. He is a member of the Computer Professional Registration Council of Nigeria (CPRN) which is the highest regulatory body in ICT in Nigeria Chandren M. Ravie (PhD) is a senior research fellow of the Faculty of Technology and Information Science, National University of Malaysia. He is presently working on Information Retrieval, Programming and Membrane Computing. He has published several articles in international journals and presented papers both at national and international conferences. Zulaiha Ali Othman (PhD) is an Associate Professor. She bagged her Master and PhD degrees from the prestigious University of Sheffield, United Kingdom. She specializes in Data Mining and Optimization. Zulaiha is a prolific writer of repute.