A128
Journal of The Electrochemical Society, 164 (2) A128-A136 (2017)
Improving the Performance at Elevated Temperature of High Voltage Graphite/LiNi0.5 Mn1.5 O4 Cells with Added Lithium Catechol Dimethyl Borate Yingnan Dong, Julien Demeaux, Yuzi Zhang, Mengqing Xu,∗ Liu Zhou, Alex D. MacIntosh, and Brett L. Lucht∗∗,z Department of Chemistry, University of Rhode Island, Kingston, Rhode Island 02881, USA Performance of LiNi0.5 Mn1.5 O4 /graphite cells cycled to 4.8 V at 55◦ C with the 1.2 M LiPF6 in EC/EMC (3/7, STD electrolyte) with and without added lithium catechol dimethyl borate (LiCDMB) has been investigated. The incorporation of 0.5 wt% LiCDMB to the STD electrolyte results in an improved capacity retention and coulombic efficiency upon cycling at 55◦ C. Ex-situ analysis of the electrode surfaces via a combination of SEM, TEM, and XPS reveals that oxidation of LiCDMB at high potential results in the deposition of a passivation layer on the electrode surface, preventing transition metal ion dissolution from the cathode and subsequent deposition on the anode. NMR investigations of the bulk electrolyte stored at 85◦ C reveals that added LiCDMB prevents the thermal decomposition of LiPF6 . © The Author(s) 2016. Published by ECS. This is an open access article distributed under the terms of the Creative Commons Attribution Non-Commercial No Derivatives 4.0 License (CC BY-NC-ND, http://creativecommons.org/licenses/by-nc-nd/4.0/), which permits non-commercial reuse, distribution, and reproduction in any medium, provided the original work is not changed in any way and is properly cited. For permission for commercial reuse, please email:
[email protected]. [DOI: 10.1149/2.0331702jes] All rights reserved. Manuscript submitted October 21, 2016; revised manuscript received November 28, 2016. Published December 13, 2016. This was Paper 539 presented at the Honolulu, Hawaii, Meeting of the Society, October 2–7, 2016.
Lithium-ion batteries are widely used for portable electronics and are currently being incorporated into electric vehicles due to their high energy density.1,2 However, there is significant interest in further increasing the energy density of lithium-ion batteries.3 One method to achieve higher energy density is increasing the operating potential of the cathode material. Most commercial lithium-ion batteries contain a lithiated transition metal oxide cathode that typically operates at ∼4.0 V vs. Li/Li+ .3,4 Several novel cathode materials with operating potentials over 4.0 V are currently under investigation, including LiNiPO4 ,5 LiCoPO4 ,5,6 and LiNi0.5 Mn1.5 O4 . While the high operating potential of the LiNi0.5 Mn1.5 O4 spinel cathode (4.8 V vs. Li/Li+ ) offers high energy density, commercialization has been hampered by severe capacity fade and poor efficiency.7 The capacity fade is particularly pronounced at moderately elevated temperatures (>45◦ C) and in full cells employing a graphite anode.7 The failure mechanisms of LiNi0.5 Mn1.5 O4 cells at high voltage and elevated temperature have been recently investigated.8–14 Electrolyte decomposition, electrode/electrolyte interface degradation, and transition metal dissolution are the leading factors reported for performance fade. One effective method for improving the performance of high voltage cathodes involves the incorporation of SEI (solid electrolyte interface) and CEI (cathode electrolyte interface) forming electrolyte additives that are sacrificially oxidized on the surface of electrodes to generate a passivation film which inhibits transition metal dissolution and further electrolyte oxidation. There have been several reports where electrolyte additives have improved the performance of cathodes cycled to high potential.15–18,23 Lithium bis(oxalato borate) (LiBOB) has been reported to be one of the better additives for LiNi0.5 Mn1.5 O4 cathodes.16,17,20–25 The related additive, lithium difluorooxalato borate (LiDFOB)27–31 has also been reported to improve the properties of Li1.2 Ni0.15 Mn0.55 Co0.1 O2 cathodes cycled to high potential19 In addition to the lithium oxalato borates,26,32 we have recently reported on the beneficial effect of the incorporation of lithium tetralkylborates as Additives for Designed Surface Modification (ADSM) to function as functional group delivery agents to modify the cathode surface.8,9 In this manuscript, a new asymmetric lithium borate, lithium catechol dimethyl borate (LiCDMB) is synthetized via a simple twostep reaction. Incorporation of LiCDMB into a standard lithium ∗ Electrochemical Society Student Member. ∗∗ Electrochemical Society Member. z E-mail:
[email protected]
ion battery electrolyte improves the electrochemical performance of LiNi0.5 Mn1.5 O4 /Graphite cells cycle to high potential (4.8 V vs. LiC6 /C6 ) (Figure 1). Ex-situ surface analysis of the cycled electrodes was conducted to better understand the source of performance enhancement.
Experimental Synthesis and characterization.—2.75 g of catechol (99%, Aldrich) was dissolved in 100 mL of diethyl ether (anhydrous, ≥99%, ¯ was Aldrich). 30 mL of n-butyl lithium (1.6 M in hexanes, ACROS) added to the solution drop by drop. The reaction mixture was stirred for 24 hours the product precipitated and collected via filtration in a N2 -filled glove-box. The salt obtained was subsequently washed with a small amount of diethyl ether (anhydrous, ≥99%, Aldrich) and stored under vacuum overnight to remove solvent. The product was characterized as lithium catechol by 1 H NMR. 1.25 g of lithium catechol was suspended in 50 mL of ether, and 2.5 mL of trimethyl borate was added to the suspension. A slurry mixture was obtained. The solution was stirred for 24 hours and the mixture composed of lithium tetramethyl borate and lithium catechol dimethyl borate was filtered in the N2 -filled glove box. The mixture was separated by adding excess dimethyl carbonate to dissolve lithium catechol dimethyl borate (lithium tetramethyl borate has poor solubility in DMC). The filtrate was collected and the DMC was removed under vacuum, lithium catechol dimethyl borate (LiCDMB, Scheme 1) was obtained as a
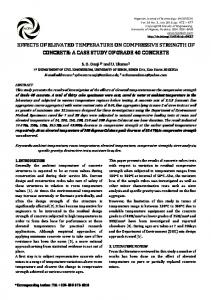
Figure 1. Chemical structure of lithium salt anions: (a) B(O(CO2 )2 O)2 − (BOB− ), (b) BF2 (O(CO2 )2 O)− (DFOB− ), and (c) a new non-fluorinated anion B(OMe)2 (O(C6 H4 )O)− (CDMB− ).
Downloaded on 2017-05-22 to IP 154.16.251.66 address. Redistribution subject to ECS terms of use (see ecsdl.org/site/terms_use) unless CC License in place (see abstract).
Journal of The Electrochemical Society, 164 (2) A128-A136 (2017)
A129
Scheme 1. Synthetic route for lithium catechol dimethyl borate.
white crystal. The product was characterized by 1 H and magnetic resonance (NMR) spectroscopy.
11
B nuclear
Electrochemical test and characterization.—Battery grade carbonate solvents, lithium hexafluorophosphate (LiPF6 ) and 1.2 M LiPF6 in EC/EMC (3/7 v/v) (STD electrolyte) were obtained from a commercial source. The additive was added as weight percent of the total mass of electrolyte. Lithium catechol dimethyl borate (LiCDMB) was synthesized and added as 0.5% (wt) to the STD electrolyte. The composite cathode and anode electrodes were obtained from a commercial source. The composite LiNi0.5 Mn1.5 O4 electrode is composed of active material (92%), conductive carbon (4%) and PVDF binder (4%). The composite anode electrode is composed of graphite (ConocoPhilips, 95.7%) along with conductive carbon (0.5%) and CMC & SBR binder (3.8%). The cathode loading is 15.9 mg/cm2 and loading of anode is 7.1 mg/cm2 . 2032-type coin cells were built with cathode (d = 14.7 mm) and graphite anode (d = 15.0 mm), a Setela E20MM (d = 19 mm) separator, and 40 μL of electrolyte in each cell in an Argon-filled glove box with a water content less than 0.1 ppm. Carbon black electrode (Super C65, d = 15 mm) half-cells were built with 100 μL of electrolyte, a glass fiber (Whatman, d = 15.6 mm) separator and a Setela E20MM (d = 19 mm) separator. Cells were cycled on an Arbin Instruments batter cycler and the temperature was controlled with Fisher Scientific Isotemp Incubators. LiNi0.5 Mn1.5 O4 /graphite cells were cycled at 25◦ C initially with the following cycling protocol: C/20 for the first cycle; C/10 for the second and third cycles; and then C/5 for the remaining cycles at 25◦ C. After cycling at 25◦ C for a total of 20 cycles, cells were transferred to 55◦ C and C/5 cycling was continued for an additional 30 cycles. Cells were charged with a CC-CV mode, constant current charge to 4.8 V followed with a constant voltage charge step at 4.8 V vs. LiC6 /C6 until the current decreased to 10% of the applied charging current. The cells were discharged to 4.25 V vs. LiC6 /C6 at same constant current (CC mode). Coin cells were sealed with epoxy resin prior to 55 ◦ C cycling and there was no evidence for cell leakage after cycling at 55◦ C. Cells were built in triplicate. Cell to cell variation was less than 3%. Electrochemical impedance spectroscopy (EIS) was performed on a Bio-Logic Instrument after formation, 25 ◦ C and 55 ◦ C cycling at 100% SOC. The perturbation is 10 mV with the frequency range 1000 kHz–20 mHz. Cycled cells were disassembled in an argon glove-box, and cycled anodes/cathodes were harvested and rinsed with anhydrous dimethyl carbonate (DMC, Sigma, extra dry 99%) 3 times to remove residual electrolyte, followed by vacuum drying overnight at room temperature. Ex-situ surface analysis of the discharged electrodes was conducted. XPS measurements were carried out using a ThermoFisher K-Alpha spectrometer, under focused monochromatized Al Kα radiation (ν = 1486.6 eV). Cells were disassembled in the glove box and electrode samples were rinsed 3 times with DMC and dried under vacuum at room temperature for 10 minutes. Samples were then sealed in a vial under controlled atmosphere of the glove box and stored for 24 hours. A transfer case (ThermoFisher) was used to avoid any contact with air/moisture. Peaks were recorded with constant pass energy of 50 eV with an energy resolution of 50 meV and charge neutralization. Peak positions and areas were optimized by a weighted least squares fitting method using 70% Gaussian, 30% Lorentzian line shapes using the Avantage (ThermoFisher) software. The discharged electrodes were briefly (15 s) exposed to air during transfer to the SEM and TEM vacuum chamber. Surface morphology of the cycled electrodes was characterized by scanning electron mi-
croscopy (SEM, JEOL5900). The cycled electrodes were exposed to ultrasound in DMC solvent for 3 h to allow homogenous dispersion of the active materials in the solution, and then the dispersed solution was cast on a copper TEM grid (500 mesh) and dried overnight in a vacuum oven. The TEM grids were quickly transferred into the TEM chamber. Imaging was conducted using a JEOL JEM-2100F TEM (Pebody, MA) at 160 eV. The diameter of the beam was 5 nm, and low-dose imaging was employed to minimize electron-beam-induced changes to organic components in the surface layer. Thermal stability.—Samples for NMR spectroscopy were prepared in a glove box filled with high purity Ar followed by flame sealing in glass NMR tubes under reduced pressure. Sealed samples were heated in a silicon oil bath at 85◦ C. Samples were weighed before and after storage to confirm seal. NMR analyses were conducted on a Bruker 300 MHz NMR spectrometer. 19 F NMR spectra were referenced to LiPF6 at −65.0 ppm and 31 P NMR spectra were referenced to LiPF6 at −145.0 ppm, as described previously.33–35
Results and Discussion Characterization of lithium catechol dimethyl borate (LiCDMB).—The as-synthesized product is purified via crystallizations, and characterized by NMR spectroscopy in D2 O (1 H, 11 B). The corresponding 1 H and 11 B NMR spectra are depicted in Figure 2. The singlet peak at 3.3 ppm is characteristic of the methoxyl group (-OCH3 ) of the product, a small peak characteristic of residual wash solvent (DMC) can be observed at 3.8 ppm, and the peak ascribed to the residual H in D2 O is observed at 4.8 ppm. The singlet peak observed at 6.7 ppm is attributed to the aromatic protons of the product. The integrated ratio of methyl protons to aromatic protons is 4:6, which matches the structure of LiCDMB. A single peak characteristic of the product at 7.7 ppm is observed in the 11 B NMR spectrum, 11 B chemical shift of boric acid located between −20-0ppm as a function of pH,51 suggesting LiCDMB doesn’t decompose into boric acid in D2 O. The 1 H and 11 B NMR spectra support the isolation of a pure compound.
Figure 2. (Top) 1 H and (bottom) 11 B NMR spectra of lithium catechol dimethyl borate (LiCDMB) in D2 O.
Downloaded on 2017-05-22 to IP 154.16.251.66 address. Redistribution subject to ECS terms of use (see ecsdl.org/site/terms_use) unless CC License in place (see abstract).
A130
Journal of The Electrochemical Society, 164 (2) A128-A136 (2017)
Figure 3. (a) 19 F (a) and (b) 31 P NMR spectra of electrolytes before storage and after a 8-day storage at 85◦ C: (in black) the STD and (in red) the STD + 0.5% LiCDMB electrolytic solutions.
Thermal stability.—The 19 F and 31 P NMR spectra of the STD electrolyte and STD with 0.5% added LiCDMB before and after storage for 8-days at 85◦ C are presented in Figure 3. The spectra are consistent with the addition of LiCDMB inhibiting the thermal decomposition of the LiPF6 electrolyte. In both cases, the fresh electrolytes contain a single set of peaks in the 19 F and 31 P NMR spectra characteristic of LiPF6 .35 The 19 F spectrum of the STD electrolyte after 8 days of storage at 85◦ C reveals new peaks around −85 ppm characteristic of fluorophosphates (OPFx (OR)y ), in addition a small peak for LiF is observed at – 155 ppm. After 8 days of storage at 85◦ C the 19 F NMR spectrum of the electrolyte with added LiCDMB has a much lower concentration of peaks characteristic of OPFx (OR)y , consistent with an inhibition of LiPF6 decomposition (Figure 3a). The 31 P spectra further support the inhibition of electrolyte decomposition with added LiCDMB. The 31 P spectrum of the STD electrolyte stored at 85◦ C for 8 days contains new peaks around −25 ppm characteristic of O = PFx (OR)y . While the same peaks are present in the samples containing added LiCDMB, the intensity of the peaks is significantly diminished consistent with inhibition of the thermal decomposition of LiPF6 .36,37 Electrochemical stability.—Electrochemical stability of both the STD and the LiCDMB electrolyte have been evaluated on carbon black electrodes with linear sweep voltammetry at high and low potential.10,36 Anodic linear sweep voltammetry of Super C65/Li cells is presented in Figure 4. Additive oxidation is clearly observed above 3.5 V vs. Li/Li+ as increased current, compared to the STD electrolyte. Additional oxidation peaks are observed at 4.0 V vs. Li/Li+ and 4.4 V vs. Li/Li+ for the borate-containing electrolyte. Increased current is observed for the LiCDMB electrolyte up to 5.6 V vs. Li/Li+ .
Cathodic linear sweep voltammetry of Super C65/Li cells is presented in Figure 5. For the STD electrolyte, the reduction peak of EC at 0.65 V vs. Li/Li+ can be clearly observed.37 For the electrolyte containing LiCDMB, the reduction peak for EC is observed at similar
Figure 4. Anodic linear sweep voltammetry at 25◦ C of Super C65/Li cells (sweep rate of 0.1 mV.s−1 ) using (in black) the EC/EMC (3/7) 1.2 M LiPF6 and (in red) EC/EMC (3/7) 1.2 M LiPF6 + 0.5% LiCDMB electrolytes.
Downloaded on 2017-05-22 to IP 154.16.251.66 address. Redistribution subject to ECS terms of use (see ecsdl.org/site/terms_use) unless CC License in place (see abstract).
Journal of The Electrochemical Society, 164 (2) A128-A136 (2017)
A131
Figure 5. Cathodic linear sweep voltammetry at 25◦ C of Super C65/Li cells (sweep rate of 0.1 mV.s−1 ) using (in black) the EC/EMC (3/7) 1.2 M LiPF6 and (in red) EC/EMC (3/7) 1.2 M LiPF6 + 0.5% LiCDMB electrolytes.
potential and intensity. This suggests that the presence of the LiCDMB additive does not affect EC reduction at low potential. There is no evidence for reduction of the additive in the 3.0 V–0.7 V vs. Li/Li+ potential range. Investigation of the electrochemical stability at both high and low potentials of the LiCDMB electrolyte suggests reactivity at high potential. Additive oxidation is observed above 3.5 V vs. Li/Li+ , before the first redox couple of the high voltage spinel situated at 4.3 V vs. Li/Li+ (Mn+III /Mn+IV ). This reactivity may result in the generation of a cathode passivation layer which inhibits Mn2+ dissolution and further electrolyte oxidation especially for cells cycled at 55◦ C. Cycling performance.—Cycling performance at 25◦ C and 55◦ C of LiNi0.5 Mn1.5 O4 /Graphite cells using the STD, LiCDMB and LiBOB electrolytes is presented in Figure 6. Additive concentration of 0.5% (wt) of LiCDMB is found to be optimal for improved performance of high voltage cells. As seen from Figure 6a, the cell with the borate additive shows better capacity retention than the standard cell after 30 cycles at 55◦ C. After 30 cycles at 55◦ C, the cell with the STD electrolyte retains only 52% of its original capacity while addition of 2.5% LiBOB improves the capacity retention to 61%, as previously reported.17,23 However, a retention of 76% of the original capacity is observed with added LiCDMB. Cells containing the LiCDMB electrolyte have the best performance suggesting that LiCDMB is a promising additive for LiNi0.5 Mn1.5 O4 /Graphite cells. Coulombic efficiencies of the cells with the STD, LiCDMB and LiBOB electrolytes are presented in Figure 6b. The first cycle efficiency at C/20 is higher for the cell containing the STD electrolyte than the cell containing the LiCDMB electrolyte. The difference may be due to additive oxidation at high potential (Figure 4). However, after formation cycling the efficiency of cells containing the LiCDMB electrolyte is better than the cells containing the STD electrolyte, supporting a beneficial effect of the borate additive upon cycling. Upon cycling at 55◦ C, the differences in coulombic efficiency are enhanced and the cell containing the LiCDMB electrolyte has ∼3% higher efficiency than the cell containing the STD electrolyte. Despite a small decrease in the first cycle discharge capacity and efficiency, the long term cycling performance at 25◦ C and 55◦ C is significantly improved with the LiCDMB electrolyte. While the cell with 2.5% of added LiBOB had better capacity retention than the cell containing the STD electrolyte, no improvement to the coulombic efficiency is observed. Electrochemical impedance spectroscopy.—Electrochemical impedance spectra of cells at a full state of charge (100% SOC,
Figure 6. (a) Cycling retention and (b) coulombic efficiency of LiNi0.5 Mn1.5 O4 /Graphite cells (cutoff potentials at 25◦ C and 55◦ C: 4.80 V– 4.25 V vs. LiC6 /C6 ) using the STD electrolyte (in black), STD with 0.5% (wt) added LiCDMB (in red) and STD with 2.5% (wt) added LiBOB (in blue).
4.8 V) are measured at different stages upon cycling. The corresponding EIS Nyquist plots are depicted in Figure 7. After formation cycling, the impedance of the cell with STD electrolyte is found to be similar to the cell containing the LiCDMB electrolyte (Figure 7a).38 After 20 cycles at 25◦ C, the EIS of the cell with the STD electrolyte and the cell with the LiCDMB electrolyte remain very similar (Figure 7b), consistent with similar specific capacity (Figure 6). However, a significant change in EIS is observed upon cycling at 55◦ C (Figure 7c). Impedance of the cell with the STD electrolyte is almost twice as large as the cell with the LiCDMB electrolyte. While additional electrolyte oxidation is observed for cells containing LiCDMB electrolyte during formation cycling, the presence of the oxidation products of LiCDMB result in better capacity retention, efficiency, and lower impedance. SEM/TEM imaging of electrodes.—SEM imaging of the LiNi0.5 Mn1.5 O4 and graphite electrodes after cycling at 55◦ C has been conducted in order to investigate electrode surface morphology. SEM micrographs of the fresh LiNi0.5 Mn1.5 O4 cathodes and cathodes cycled with and without added LiCDMB are depicted in Figure 8. The fresh electrode consists of secondary spherical particles of ca. 8 μm. These spherical particles are composed of a primary rod structure several hundred nanometers in length. The fresh cathode particle surface is clean and smooth. After cycling with the STD electrolyte at 55◦ C,
Downloaded on 2017-05-22 to IP 154.16.251.66 address. Redistribution subject to ECS terms of use (see ecsdl.org/site/terms_use) unless CC License in place (see abstract).
A132
Journal of The Electrochemical Society, 164 (2) A128-A136 (2017)
Figure 9. SEM micrographs of the graphite electrode and graphite anodes harvested from cells after overall cycling at 25◦ C and 55◦ C using the STD and STD + 0.5% LiCDMB electrolytes. Figure 7. EIS spectra at full state of charge (4.8 V vs. LiC6 /C6 ) of Li1-x Ni0.5 Mn1.5 O4 /Lix C6 cells using the (in black) STD and (in red) STD + 0.5% LiCDMB electrolyte after (a) formation cycling, (b) 20 cycles at 25◦ C, and (c) 30 additional cycles at 55◦ C.
Figure 8. SEM micrographs of the LiNi0.5 Mn1.5 O4 electrode and LiNi0.5 Mn1.5 O4 cathodes harvested from cells after overall cycling at 25◦ C and 55◦ C using the STD and STD + 0.5% LiCDMB electrolytes.
the structure of the cathode particles is severely damaged. The particle damage likely results in increased impedance and reduced capacity retention of cells, as discussed above. For the cells cycled with the LiCDMB electrolyte, the original secondary and primary structure of the LiNi0.5 Mn1.5 O4 particles is maintained after cycling at 55◦ C. The surface of the primary particle is covered by a thick CEI. Maintenance of the original structure of the cathode and formation of a passivating CEI contributes to enhanced cycling performance of the cells at 55◦ C. SEM micrographs of the fresh graphite electrode and graphite anodes cycled with or without added LiCDMB are depicted in Figure 9. The surfaces of the fresh graphite electrode particles have sharp edges, and are primarily composed of flake-like structures. After cycling with the STD electrolyte, the graphite surface becomes very rough and non-uniform with many small particles due to the deposition of electrolyte decomposition products on the surface of the graphite. Upon cycling with the LiCDMB electrolyte, a more uniform smooth layer is observed on the graphite surface. Electrodes extracted from graphite/LiNi0.5 Mn1.5 O4 cells cycled at 55◦ C have been analyzed by TEM (Figure 10). Both fresh LiNi0.5 Mn1.5 O4 and graphite electrodes have sharp edges. After cycling with the STD electrolyte, inhomogeneous coverage of the cathode surface is observed. Alternatively, the surface of the cathode cycled with the LiCDMB electrolyte has a more uniform surface film (Figure 4). TEM images of the graphite electrode cycled with the STD electrolyte reveal significant concentrations of electrolyte decomposition products. The SEI is grainy and uneven, as observed by SEM above. The graphite anode cycled with the LiCDMB electrolyte has a thinner but more continuous surface layer. Thus, TEM images are in agreement with SEM images: addition of LiCDMB results in a thicker CEI on the high voltage cathode, and a thinner but more uniform SEI on the graphite anode. XPS.—Relative atomic concentrations.—In order to correlate cycling performance of graphite/LiNi0.5 Mn1.5 O4 cells with surface chemistry of the electrodes, XPS has been conducted on both LiNi0.5 Mn1.5 O4 and graphite electrodes fresh and after cycling.
Downloaded on 2017-05-22 to IP 154.16.251.66 address. Redistribution subject to ECS terms of use (see ecsdl.org/site/terms_use) unless CC License in place (see abstract).
Journal of The Electrochemical Society, 164 (2) A128-A136 (2017)
A133
Figure 10. TEM images of LiNi0.5 Mn1.5 O4 and graphite electrodes harvested from cells after 50 cycles at 25◦ C and 45◦ C using the STD and STD + 0.5% LiCDMB electrolytes.
Relative atomic concentrations of elements detected on the LiNi0.5 Mn1.5 O4 cathodes fresh and cycled at 55◦ C in both the STD and LiCDMB electrolytes are presented in Figure 11. The cathode cycled with the STD electrolyte has a reduced concentration of C 1s and inorganic O 1s (metal oxide) due to the deposition of organic components of the CEI. Increased concentration of organic O 1s (C-O, C=O) confirms the generation of a new cathode-electrolyte interface. Relative atomic concentrations of elements detected on the cathode cycled with the LiCDMB electrolyte indicates that the amount of organic species deposited on the surface is further increased compared to the cathode cycled with the STD electrolyte. A significant increase of organic O 1s along with decrease of the Mn 2p and inorganic O
1s suggest significant coverage of the electrode surface. Therefore, addition of the LiCDMB additive to the STD electrolyte allows the deposition of a thicker passivating CEI, likely due to the oxidation of LiCDMB at high potentials (Figure 4). Relative atomic concentrations of elements detected on the graphite anode cycled at 55◦ C with both the STD and LCDMB electrolytes are compared in Figure 12 to the fresh graphite electrode. The graphite electrode cycled with the STD electrolyte has a decrease in the concentration of C, and increases in the concentrations of O, F, P, and Mn consistent with the generation of an SEI. A high concentration of Mn is detected on the graphite electrode cycled with the STD electrolyte, consistent with manganese dissolution from the
Figure 11. Relative atomic concentrations of elements present on the LiNi0.5 Mn1.5 O4 electrode and LiNi0.5 Mn1.5 O4 cathodes after overall cycling at 25◦ C and 55◦ C in the STD and STD + 0.5% LiCDMB electrolytes.
Figure 12. Relative atomic concentrations of elements present on the graphite electrode and graphite anodes after overall cycling at 25◦ C and 55◦ C in the STD and STD + 0.5% LiCDMB electrolytes.
Downloaded on 2017-05-22 to IP 154.16.251.66 address. Redistribution subject to ECS terms of use (see ecsdl.org/site/terms_use) unless CC License in place (see abstract).
A134
Journal of The Electrochemical Society, 164 (2) A128-A136 (2017)
Figure 13. (On the left) O 1s and (on the right) C 1s core spectra of (a) the fresh LiNi0.5 Mn1.5 O4 electrode and LiNi0.5 Mn1.5 O4 cathodes cycled at 55◦ C with the (b) STD and (c) STD + 0.5% LiCDMB electrolytes.
LiNi0.5 Mn1.5 O4 during cycling at 55◦ C and deposition at low potential on the anode. The graphite anode cycled with the LiCDMB electrolyte shows increased concentrations of O 1s, and F 1s (LiF + Lix POy Fz ) due to the generation of the SEI. The decreased concentration of Mn 2p is significant, consistent with the LiCDMB electrolyte inhibiting Mn dissolution from the high voltage spinel (Figure 11). XPS element spectra.—The O 1s and C 1s core spectra of the LiNi0.5 Mn1.5 O4 electrodes are depicted in Figure 13. The O 1s spectrum of the fresh cathode is dominated by the metal oxide at 529.0 eV.39,40 The cathode cycled with STD electrolyte contains the same O-M (M = Mn, Ni) peak at 529.0 eV, along with new peaks at higher binding energy which correspond to electrolyte decomposition products on the cathode surface characteristic of C=O, C-O, and O-C=O bonds respectively at 531.2 eV, 532.5 eV, and 533.0 eV.39,40,44–46 The differences are greater for the cathode cycled with LiCDMB electrolyte (Figure 10). The peak characteristic of the metal oxide at 529.0 eV is very weak while the peaks characteristic of electrolyte decomposition products have high intensity. In addition, a new small peak is observed at ∼535 eV which results from the oxidation of LiCDMB and is likely the result of shake up satellites from the presence of aromatic species on the cathode surface.39,41–43,49,50 This suggests greater coverage of the cathode surface in the presence of added LiCDMB (Figure 4). The C 1s core spectra of the cathodes reveal significant differences in the electrode surfaces for the different electrolytes. The fresh electrode contains C 1s peaks characteristic of C-C (284.3 eV) and C-H (285.6 eV), along with peaks of the PVdF binder at 286.5 eV (-CH2 -) and 290.7 eV (-CF2 -).39–41,44 The C 1s spectrum of the cathode cycled with the STD electrolyte shows the deposition of organic species that comprise the CH2 (285.6 eV), C-O (286.5 eV), C=O (ca. 288 eV), and O-C=O (289.9 eV) groups.39,41,43,44 The low intensity of the PVdF peaks at 290.7 eV (-CF2 -) and at 286.5 eV (-CH2 -) suggests that the active material is mostly covered by the constituents of the CEI. The XPS spectra of the cathode cycled with the LiCDMB electrolyte has a thicker surface film since the peaks associated with PVdF are no longer visible in the C 1s spectrum which confirms coverage of the cathode material. Functional groups of the CEI at 284.3 eV (C-C),
285.6 eV (C-H), 286.5 eV (C-O), ca. 288 eV (C=O), and 289.9 eV (O-C=O) are observed in the C 1s spectra. The C 1s and O 1s XPS spectra of the graphite electrodes are depicted in Figure 14. The C 1s spectrum of the fresh graphite shows high intensity of the C-C peak at 284.3 eV, along with COx peaks of the CMC binder.42 The anode cycled with the STD electrolyte contains C 1s peaks characteristic of lithium alkyl carbonates and lithium carbonate from carbonate solvent reduction as expected from SEI formation.42,43 Similar peaks are also observed in the C 1s spectrum of the anode cycled with the LiCDMB electrolyte. An additional C 1s aromatic shake-up satellite is observed at 291.5 eV.42,43 The O 1s spectrum of the fresh graphite electrode contains O 1s peaks of the CMC binder, along with the Auger peak of sodium at 536 eV.40 The O 1s spectrum of the graphite electrode cycled with the STD electrolyte contains peaks characteristic of electrolyte decomposition products in the SEI such as lithium alkyl carbonates and lithium carbonate: 531.2 eV, 532.5 eV, and 533.2 eV.39,41–43 The O 1s spectrum of the graphite electrode cycled with the LiCDMB electrolyte contain similar O 1s peaks. Nevertheless, a fourth peak is observed at 535.2 eV, consistent with shake up satellites from the deposition of aromatic species and correlates with the C 1s peak at 291.5 eV.42,43 The addition of LiCDMB results in the deposition aromatic species on the graphite anode which are not present on the electrode cycled with the STD electrolyte. The Li 1s, Mn 3p, and Ni 3p spectra of the graphite anodes cycled in electrolytes with and without added LiCDMB are presented in Figure 15. The Li 1s, Mn 3p, and Ni 3p spectra of the anode cycled with the STD electrolyte contain peaks at 49 eV (Mn+IV ), 48 eV (Mn+III ), 69 eV (Ni+IV ),44 and LiF at 56 eV (Figure 15b). This indicates that transition metal dissolution from the cathode surface is occurring followed by deposition on the anode damaging the SEI (Figure 13b).47,48 Much weaker intensity XPS peaks associated with Ni and Mn are observed on the graphite anode cycled with the LiCDMB electrolyte (Figure 15c). The reduced concentration of Ni and Mn on the anode likely results from the generation of a cathode passivation layer composed of the oxidation products of LiCDMB which inhibits Mn and Ni dissolution. While the concentration of B is surprisingly low, the B concentration is unfortunately
Downloaded on 2017-05-22 to IP 154.16.251.66 address. Redistribution subject to ECS terms of use (see ecsdl.org/site/terms_use) unless CC License in place (see abstract).
Journal of The Electrochemical Society, 164 (2) A128-A136 (2017)
A135
Figure 14. (On the left) C 1s and (on the right) O 1s core spectra of (a) the fresh graphite electrode and graphite anodes cycled at 55◦ C with the (b) STD and (c) STD + 0.5% LiCDMB electrolytes.
difficult to determine due to overlap of the B1s peak with the P2s peak. An XPS investigation of LiNi0.5 Mn1.5 O4 and graphite electrodes cycled with STD electrolyte with or without added LiCDMB indicates that incorporation of LiCDMB results in the generation of a surface film on the high voltage cathode. The presence of the novel surface
film inhibits Mn and Ni dissolution and subsequent deposition on the graphitic anode. The presence of the cathode passivation layer results in enhanced cycling performance of the LiNi0.5 Mn1.5 O4 /Graphite cells. Conclusions Performance of LiNi0.5 Mn1.5 O4 /Graphite cells cycled up to 4.8 V at 55◦ C with 1.2 M LiPF6 in EC/EMC (3/7 v/v, STD electrolyte) with and without 0.5% (wt) lithium catechol dimethyl borate (LiCDMB) has been investigated. Upon cycling at 55 ◦ C, cells with 0.5% LiCDMB have improved capacity retention and better cycling efficiency. After cycling the electrodes were extracted from the cells and ex-situ surface analysis was conducted via a combination of SEM, TEM, and XPS. Analysis of the cathode reveals the presence of LiCDMB reaction products which generates a thick passivation layer on the high voltage spinel. The novel cathode electrolyte interface (CEI) prevents the dissolution of transition metal ions and subsequent migration and deposition on the graphite anode. Analysis of the anodes reveals that incorporation of LiCDMB results in the formation of a thin but continuous SEI with a much lower concentration of Mn than observed on anodes cycled with the STD electrolyte. Incorporation of LiCDMB has also been shown to inhibit the thermal decomposition of the STD electrolyte at 85◦ C. The incorporation of the novel additive, LiCDMB, results in improved performance and changes to the electrode surface chemistry for LiNi0.5 Mn1.5 O4 /Graphite cells cycled to high potential. Acknowledgment The authors thank the Department of Energy Office of Basic Energy Sciences EPSCoR Implementation award (DE–SC0007074) for support of the XPS. References
Figure 15. Li 1s, Mn 3p, and Ni 3p core spectra of (a) the LiNi0.5 Mn1.5 O4 electrode and graphite anodes cycled in LiNi0.5 Mn1.5 O4 /Gr cells with (b) the STD and (c) STD + 0.5% LiCDMB electrolytes.
1. 2. 3. 4. 5.
J. M. Tarascon and M. Armand, Nature, 414, 359 (2001). M. Armand and J. M. Tarascon, Nature, 451, 652 (2008). A. Manthiram, J. Phys. Chem. Lett., 2, 176 (2011). A. Kraytsberg and Y. Ein-Eli, Adv. Energy Mater., 2, 922 (2012). J. Wolfenstine and J. Allen, J. Power Sources, 136, 150 (2004).
Downloaded on 2017-05-22 to IP 154.16.251.66 address. Redistribution subject to ECS terms of use (see ecsdl.org/site/terms_use) unless CC License in place (see abstract).
A136
Journal of The Electrochemical Society, 164 (2) A128-A136 (2017)
6. J. L. Allen, T. R. Jow, and J. Wolfenstine, J. Power Sources, 196, 8656 (2011). 7. A. Manthiram, K. Chemelewski, and E.-S. Lee, Energy Environ Sci., 7, 1339 (2014). 8. M. Xu, L. Zhou, Y. Dong, U. Tottempudi, J. Demeaux, A. Garsuch, and B. L. Lucht, ECS Electrochem. Lett, 4, A83 (2015). 9. M. Xu, L. Zhou, Y. Dong, Y. Chen, J. Demeaux, A. D. MacIntosh, A. Garsuch, and B. L. Lucht, Energy Environ. Sci., 9, 1308 (2016). 10. J. Demeaux, D. Lemordant, M. Caillon-Caravanier, H. Galiano, and B. Claude-Montigny, Electrochim. Acta, 89, 163 (2013). 11. B. Michalak, B. B. Berkes, H. Sommer, T. Bergfeldt, T. Brezesinski, and J. Janek, Anal Chem., 88, 2877 (2016). 12. M. He, L. Boulet-Roblin, P. Borel, C. Tessier, P. Nov´ak, C. Villevieille, and E. J. Berg, J. Electrochem. Soc, 163, A83 (2015). 13. D. Lu, M. Xu, L. Zhou, A. Garsuch, and B. L. Lucht, J. Electrochem. Soc, 160, A3138 (2013). 14. T. Yoon, S. Park, J. Y. Mun, J. H. Ryu, W. C. Choi, Y. S. Kang, J. H. Park, and S. M. Oh, J. Power Sources, 215, 312 (2012). 15. L. Yang, T. Markmaitree, and B. L. Lucht, J. Power Sources, 196, 2251 (2011). 16. M. Xu, B. Knight, and B. L. Lucht, Electrochem. Solid State Lett., 15, A28 (2012). 17. M. Xu, N. Tsiouvaras, A. Garsuch, H. A. Gasteiger, and B. L. Lucht, J. Phys. Chem. C, 118, 7363 (2014). 18. I. A. Shkrob, Y. Zhu, T. W. Marin, and D. P. Abraham, J. Phys. Chem. C, 117, 23750 (2013). 19. Y. Zhu, Y. Li, M. Bettge, and D. P. Abraham, Electrochim. Acta, 110,191 (2013). 20. W. Xu and C. A. Angell, Electrochem. Solid-State Lett., 4, E1 (2001). 21. W. Xu and C. A. Angell, Electrochem. Solid-State Lett., 4, L3 (2001). 22. U. Lischka, U. Wietelmann, and M. Wegner, Pat. DE 19829030 C1, Germany (1999). 23. M. Xu, L. Zhou, Y. Dong, Y. Chen, A. Garsuch, and B. L. Lucht, J. Electrochem. Soc, 160, A2005 (2013). 24. S. Tsujioka, H. Takase, M. Takahashi, and H. Sugimoto, Jap. Pat. JP 2001247306 A, Japan (2001). 25. S. Tsujioka, H. Takase, M. Takahashi, and H. Sumgioto, Jap. Pat. JP 2001302675 A, Japan (2001). 26. S. Tsujioka, H. Takase, M. Takahashi, and Y. Isono, Eur. Pat. EP 1308449 A2, Europe (2003). 27. S. S. Zhang, Electrochem. Commun., 8, 1423 (2006). 28. M. Xu, L. Zhou, L. Hao, L. Xing, W. Li, and B. L. Lucht, J. Power Sources, 196, 6794 (2011). 29. Z.-M. Xue, J.-F. Zhao, J. Ding, and C.-H. Chen, J. Power Sources, 195, 853 (2010). 30. Z.-M. Xue, W. Zhou, J. Ding, and C.-H. Chen, Electrochim. Acta, 55, 5342 (2010).
31. Z.-M. Xue, B.-B. Sun, W. Zhou, and C.-H. Chen, J. Power Sources, 196, 8710 (2011). 32. W. Xu, A. J. Shusterman, R. Marzke, and C. A. Angell, J. Electrochem. Soc, 151, A632 (2004). 33. C. L. Campion, W. Li, and B. L. Lucht, J. Electrochem. Soc, 152, A2327 (2005). 34. W. Li, C. Campion, B. L. Lucht, B. Ravdel, J. DiCarlo, and K. M. Abraham, J. Electrochem. Soc, 152, A1361 (2005). 35. B. Ravdel, K. M. Abraham, R. Gitzendanner, J. DiCarlo, B. Lucht, and C. Campion, J. Power Sources, 119, 805 (2003). 36. J. Demeaux, M. Caillon-Caravanier, H. Galiano, D. Lemordant, and B. Claude-Montigny, J. Electrochem. Soc, 159, A1880 (2012). 37. M. Nie, D. Chalasani, D. P. Abraham, Y. Chen, A. Bose, and B. L. Lucht, J. Phys. Chem. C, 117, 1257 (2013). 38. D. Aurbach, J. Power Sources, 89, 206 (2000). 39. R. Dedryv`ere, D. Foix, S. Franger, S. Patoux, L. Daniel, and D. Gonbeau, J. Phys. Chem. C, 114, 10999 (2010). 40. L. Bodenes, R. Dedryvere, H. Martinez, F. Fischer, C. Tessier, and J. P. Peres, J. Electrochem. Soc, 159, A1739 (2012). 41. H. Bouayad, Z. Wang, N. Dupr`e, R. Dedryv`ere, D. Foix, S. Franger, J. F. Martin, L. Boutafa, S. Patoux, D. Gonbeau, and D. Guyomard, J. Phys. Chem. C, 118, 4634 (2014). 42. L. El Ouatani, R. Dedryv`ere, C. Siret, P. Biensan, S. Reynaud, P. Iratc¸abal, and D. Gonbeau, J. Electrochem. Soc, 156, A103 (2009). 43. L. El Ouatani, R. Dedryv´ere, C. Siret, P. Biensan, and D. Gonbeau, J. Electrochem. Soc, 156, A468 (2009). 44. J. Pires, A. Castets, L. Timperman, J. Santos-Pe˜na, E. Dumont, S. Levasseur, C. Tessier, R. Dedryv`ere, and M. Anouti, J. Power Sources, 296, 413 (2015). 45. R. Dedryv`ere, H. Martinez, S. Leroy, D. Lemordant, F. Bonhomme, P. Biensan, and D. Gonbeau, J. Power Sources, 174, 462 (2007). 46. R. Dedryv´ere, D. Foix, S. Franger, S. Patoux, L. Daniel, and D. Gonbeau, J. Phys. Chem. C, 114, 10999 (2010). 47. L. Baggetto, N. Dudney, and G. Veith, Electrochim. Acta, 90, 135 (2013). 48. K. Carroll, D. Qian, C. Fell, S. Calvin, G. Veith, M. Chi, L. Baggettod, and Y. Meng, Phys. Chem. Chem. Phys., 15, 11128 (2013). 49. M. Jung, U. Baston, T. Porwol, H. -J. Freund, and E. Umbach, https://arxiv.org/ftp/cond-mat/papers/0408/0408663.pdf , (2004). 50. A. Majumdar, S. Chandra Das, T. Shripathi, J. Heinicke, and R. Hippler, Surface Science, 609, 53 (2013). 51. K. Ishihara, A. Nagasawa, K. Umemoto, H. Ito, K. Saitole, and Znorg. Inorg. Chem., 33, 3811 (1994).
Downloaded on 2017-05-22 to IP 154.16.251.66 address. Redistribution subject to ECS terms of use (see ecsdl.org/site/terms_use) unless CC License in place (see abstract).