enhance customer satisfaction, there is need to increase ICT service delivery at the KPLC. The study will be ... satisfaction traditionally involves asking customers.
Journal of Emerging Trends in Economics and Management Sciences (JETEMS) 3(5): 461-466 © Scholarlink Research Institute Journals, 2012 (ISSN: 2141-7024 jetems.scholarlinkresearch.org Journal of Emerging Trends in Economics and Management Sciences (JETEMS) 3(5):461-466 (ISSN:2141-7024)
Improving the Quality of Customer Service through ICT Use in the Kenya Power and Lighting Company Kennedy Ntabo Otiso, Diane Chelangat and Ronald N. Bonuke Department of Marketing and Management Science, School of Business and Economics, Moi University, Eldoret, Kenya. Corresponding Author: Kennedy Ntabo Otiso ___________________________________________________________________________ Abstract The study investigated the effects of the perceived ICT service quality and its effects on customer satisfaction at the Kenya Power and Lighting Company (KPLC), Eldoret. It was based on Kano satisfaction model, which focuses on customer satisfaction. The study adopted descriptive survey design involving quantitative research and targeted customers of the KPLC in Eldoret Central Business District. The customers were classified into three segment that is large power customers who were 20, corporate customers 500 and domestic customers who were 300 totalling to 820. Probability random and stratified random sampling techniques were used to select 10 large power customers, 250 corporate customers and 150 domestic customers for the study sample size. The study used both primary and secondary sources of data using questionnaires and interview schedules as the research instruments. Data was analyzed using descriptive and inferential statistics (multiple regression analysis and Pearson correlation) to test the null hypotheses respectively. The correlation analysis indicated that perceived service quality (X3) is positively and statistically significant (r = 0.639, P=.000 (2 - tailed) at 1% level of significance. This implies that as the ICT service delivery increase, so does the customer satisfaction. To enhance customer satisfaction, there is need to increase ICT service delivery at the KPLC. The study will be of great value because it will help the KPLC to improve their services by the use of an appropriate ICT, besides it will form a base of study for other researchers who may be interested in the same field of study. Again it will help the ICT service providers to re-evaluate the suitability of their ICT systems to users. The study will benefit the larger community by influencing their attitudes towards the use of ICT since it will save time and user friendly. Also the community will be enlightened on the new way of improving service quality by the use of an appropriate ICT system. The study was restricted to eldoret central business district, because of the accessibility of the area, lack of enough financial resources and also the limited time. The author recommends for KPLC to put more emphasis on perceived service quality in order to enhance customer satisfaction. This study would be of significance to service industries as it will point how customer service delivery can impact on their organizations performance. _________________________________________________________________________________________ Keywords: improving quality, customer service, ICT use, Kenya power, lighting company __________________________________________________________________________________________ INTRODUCTION customers. Furthermore, the answers on what The outcome of a successful service is often referred excellent service is fell into four categories, to as a satisfied customer (Levesque & McDougall, according to Johnston (2004), namely delivering the 2000). Cranage (2004) believes that a customer is promise; providing a personal touch; going the extra satisfied as long as the expectations are met or mile and dealing well with problems and queries. exceeded by the service provider. According to Johnston (2004) concludes that organizations are Johnston (2004), providing the customers with asked to do what is required, deal well with problems ‘excellent service’ gives the outcome of delight and when they arise, and add a personal touch in order to this type of service includes a closer relationship provide excellent service. between the buyer and seller than if the outcome is satisfaction. Johnston (2004) argues that the aim for Perceived Service Quality and Customer service excellence does not imply that organizations Satisfaction should continually and always exceed expectations; Perceived service quality is the overall support service excellence is to provide the customers with delivered by the ICT service provider, which is what they value in order to induce feelings of delight. measured in terms of assurance, empathy and Johnston (2004) states that 50 percent of the responsiveness (Delone & Mclean, 2003; Lin, 2007; respondents who define what make excellent service Shih, 2004). Many researchers have identified service bring up problem handling. This implies that problem quality as an important factor of information system handling after conflicts may result in delighted success (Kettinger & Lee, 1995; Pitt et al., 1995; 461
Journal of Emerging Trends in Economics and Management Sciences (JETEMS) 3(5):461-466 (ISSN:2141-7024) Watson et al., 1998). Most service companies have research programs designed to measure service quality, and/or customer satisfaction, and/or relationship quality. Such programs are designed to allow management to manage service provision and relationship building initiatives. They provide essential information to guide efforts to reduce variability in service quality and to provide customers with the service that will help ensure their continued patronage. While there is little direct evidence as to the link between service quality and better company performance, company-level data suggests a link between higher quality, higher market share and improved profitability. Measuring service quality and satisfaction traditionally involves asking customers for subjective attitudinal evaluations, that is, asking if they personally felt the service they received was satisfactory.
in order to deliver quality ICT services to a particular organization, the proper model, processes and related technology need to be studied to map to the actual business of the organization. Technology has a life of its own, as more and more people talk about or demonstrate the technology to each other. What makes a technology like ICT service delivery to be successfully adopted? In order to measure the effect of technology characteristics on service delivery, there is need to look at Roger’s Diffusion Theory. Rogers (1995) identifies five factors that influence the adoption of technology: (1) relative advantage, (2) compatibility, (3) complexity, (4) trialability, and (5) observability. The five characteristics are positively related to adoption of ICT. Relative advantage refers to the degree to which the ICT service delivery creates customer information that leads to superior customer service when compared to traditional methods of meeting customer needs. The relative ICT service delivery advantage relates to perceptions of how adoption of ICT service delivery technology will ultimately benefit the organization when it comes to competing against other firms for customers (Rogers, 1995). If people do not perceive an ICT as better, it will not spread quickly, if at all. Researchers have shown that relative advantage is one of the strongest predictors of adoption. The extreme competitive pressure facing small businesses makes it critical for small retail firms to utilize advancing technologies, especially those that will allow them to be more customeroriented and that will help establish greater operational efficiencies (Wong et al., 2003).
Many service and relationship quality measurement programs also ask customers for subjective evaluations, e.g. "please rate the quality of the delivery service - was it excellent, very good, fair or poor". This is done on the assumption that customers' attitudes towards the service will affect their future behaviour, such as repeat-purchase behaviour or recommending the company to others. Therefore, ICT service providers should pay attention to the preand post-purchase customer interface activities designed to facilitate both immediate transactions and long-term customer relationships (Srivasan et al., 2002), like ensuring there is no breakdown in service, and promptly resolving any problems that happen to customers. In the virtually faceless world, however, lack of care is a problem for a majority of ICT (Srinivasan et al., 2002). Therefore, for ICT service providers, showing responsiveness via email management system to respond to customers’ needs, providing customers with personalized information like preferred products/services and the status of orders, and facilitating two-way communication with customers are the effective tactics.
With respect to compatibility, how does the ICT service delivery fit with the company’s past experiences and present needs? If it doesn't fit both well, it won't spread well. Does it require a change in existing values? If members of the culture feel as though they have to become very different people to adopt the innovation, they will be more resistant to it. As suggested by ICT experts, ICT is not only just a technology. It is also a business strategy. In order for a company to successfully implement ICT service delivery, and get the most from it, the decisionmakers should make the company ready by making sure that customer centric culture exists in it, and the businesses processes are streamlined. So, it is almost impossible to have full compatibility with past situation considering ICT service delivery. But obviously the less the need for change the more easily the adoption of ICT would be. On complexity, how difficult is the ICT service delivery to understand and apply? The more difficult, the slower the adoption process. Perceived innovation complexity, the degree to which an innovation is perceived as relatively difficult to understand and use (Rogers 1995), has been widely recognized as an inhibitor to adoption (Tornatzky & Klein, 2002).
For ICT customers, it is the right way for a virtual service provider to express friendship or careful attention and it rally has social meaning, which may ensure customer satisfaction and loyalty (Deighton, 1996; Watson et al., 1998). The rapid development in Information and Communication Technology (ICT) has impacted the way we interact and manage our lives. ICT has become a utility, which needs to be managed to assist core business of an organization in achieving the mission and vision of that particular organization. Business driven IT Management is defined as the application of a set of models, practices, techniques and tools to map and to quantitatively evaluate dependencies between IT solutions and business performance and using the quantified evaluation to improve the IT solutions’ quality of service and related business results. Thus, 462
Journal of Emerging Trends in Economics and Management Sciences (JETEMS) 3(5):461-466 (ISSN:2141-7024) Organization learning theories assume that, at any given moment, organizations possess some bundle of knowledge and skills that are related to their current operational and managerial processes (Jeyaraj et al., (2004). A complex innovation thus increases the bundle of knowledge and skills an organization has to acquire in order to assimilate that innovation effectively (Rogers, 1995). The heightened knowledge gap between what is required and what an organization has currently creates a higher sense of uncertainty about that innovation for the organization.
now expect anytime. Information and Communication Technology (ICT) connectivity (PCs and Internet) is very widespread in businesses of all sizes. The Kenya Power and Lighting Company is determined to foster appropriate business environments for e-business and ICT uptake, and target programmes to overcome market failures to the extent that they are needed in particular areas (e.g. skill formation, specialized information). The KPLC has adopted an ICT system in transacting business with their customers; in so doing, it expects to gain customer confidence and customer satisfaction (KPLC, May 2006). It is on this basis that the study sought to find out the effects of ICT service delivery on customer satisfaction at Kenya Power and Lighting Company.
Trialability is the degree to which technology may be experimented with on a limited basis. New ideas that can be tried on the installation plan are generally adopted more rapidly than innovations that are not divisible. Relatively earlier adopters of technology perceive trialability as more important than do later adopters. Generally, an innovation is easier to sample, the more it will be adopted.
MATERIALS AND METHODS The study was conducted at the Kenya Power and Lighting Company (KPLC) in Eldoret town of the Rift Valley Province. It adopted explanatory research design. Specifically, the study targeted customers of the Kenya Power and Lighting Company in Eldoret Central business district. The customers of the Kenya Power and Lighting Company were classified into three segments: i.e. large power customers who are 20, corporate customers 500 and domestic customers who were 300 bringing a total of 820 (KPLC Information Desk, 2010). The respondents were randomly selected after considering factors such as accessibility and the significance of the study information to the researcher and other stakeholders. Therefore, these target population provided the required sample size for the study. The author adopted stratified sampling technique and used both primary and secondary sources of data. The instruments of data collection used were: questionnaires, interview schedules and author’s personal observations. The data was analyzed quantitatively. A statistical package for social sciences (SPSS) was used to analyze both descriptive and inferential statistics. Descriptive statistics were presented in form of frequency distribution tables, bar graphs and pie charts. The inferential statistics that were used were correlation and multiple regression. Multiple regressions were used to examine the way a number of independent variables relate to one dependent variable.
Observability is the degree to which the results of modernization are visible to others. The results of some ideas are easily observed and communicated to others, whereas some modernization is difficult to observe and to describe to others. So, we can say the greater is the observability of an innovation, the more rapidly it will be adopted. The above characteristics that are positively related to adoption of ICT, and the last one, complexity, negatively relate. The interrelationship of the functions of ICT in the organizational set-up cannot be over-emphasized. Therefore, this paper endeavours to incorporate ICT both the transference and the understanding of meanings in investigating the effects of ICT service delivery on customer satisfaction at Kenya Power and Lighting Company. Need for Quality ICT Service Delivery at KPLC One of the key roles of businesses is to retain and have customer confidence through building customer satisfaction. Companies that want to maintain a competitive edge, both now and in the future, are realizing that reactive customer interaction services must be replaced by a more proactive approach that recognizes the growing user-centricity of consume communications networks. The Kenya Power and Lighting Company’s customer base has been increasing tremendously and as a result has led to increased transactions. This has resulted in the rapid technological changes in the ICT industry, and to cope with the growth in customer population, there has been need to determine the optimal capacity and quality to meet the short term and long term corporate requirements. The paradigm is shifting, and KPLC can move quickly to respond to this change and gain market share, as well as reduce customer churn, by enhancing the experience of customers who
RESULTS AND DISCUSSION KPLC ICT and Service Delivery Items related to customer satisfaction with ICT Service delivery, in both strongly disagree, disagree, neutral, agree and strongly agree incidents, were eventually arranged into four categories: (1) satisfaction with KPLC’s services; (2) fulfilment of expectations; (3) disappointment, and (4) experiences with KPLC. The number of respondents in which a particular item on customer satisfaction was involved is as reported in Table 1. 463
Journal of Emerging Trends in Economics and Management Sciences (JETEMS) 3(5):461-466 (ISSN:2141-7024) Table 1: Customer Satisfaction at KPLC Eldoret Customer satisfaction item Fully satisfied with KPLC services KPLC fulfils my expectation KPLC has never disappointed I have had excellent experience with KPLC
Strongly Disagree 45(11.0%) 48(11.8%) 69(17.0%) 63(15.5%)
Disagree
Neutral
Agree
112(27.5%) 146(36.0%) 194(47.8%) 110(27.1%)
33(8.1%) 38(9.4%) 34(8.4%) 79(19.5%)
133(32.6%) 119(29.3%) 65(16.0%) 91(22.4%)
Strongly Agree 85(20.8%) 55(13.5%) 44(10.8%) 63(15.5%)
Mean 3.25 2.95 2.56 2.95
Standard deviation 1.348 1.293 1.249 1.319
Source: Survey Data, 2010 agreed. Thus the cumulative total who agreed to the motion was only 26.8%. Regarding having excellent experiences with KPLC, 15.5% strongly disagreed, 27.1% disagreed, 22.4% agreed and 15.5% strongly agreed. Cumulatively, 42.6% disagreed against 37.9% who agreed. These results indicate that most of the customers in the sample were not satisfied with KPLS’s services. Of particular results are the items regarding fulfilment of expectations, disappointment and experience with KPLC. In these items, the proportion of customers who were not satisfied was higher than that of the customers who reported satisfaction.
As shown from the table, 11% of the customers strongly disagreed with being satisfied with KPLC services, 27.5% just disagreed. On the contrary, 20.8% of the customers strongly agreed that they were fully satisfied with KPLC services; 32.6 percent agreed. Consequently, a cumulative percent of 38.5 tended to disagree to being fully satisfied with KPLC’s services against a cumulative percentage of 53.4 who were in agreement to being fully satisfied with KPLC’s services. Close to 12 percent strongly disagreed to KPLC fulfilling their expectations, 36 percent disagreed, 29.3% agreed to KPLC fulfilling their expectations and 13.5 percent strongly agreed. Thus a cumulative total of 47.8% disagreed to their expectations being fulfilled against a cumulative total of 42.8% who agreed. Similarly, 17 percent strongly disagreed that KPLC has never disappointed while 47.8% disagreed. This gives a cumulative total of 64.8% who disagreed with the motion that KPLC has never disappointed. On the contrary, 10.8% strongly agreed that KPLC has never disappointed while 16%
Perceived Service Quality Perceived Service Quality as a result of investing in ICT was captured through the four items, namely: (1) I trust the KPLC’s ICT system; (2) The ICT system can be counted on to do what is right; (3) I believe that the ICT system takes good care of me, and (4) the ICT system is responsive to any problems that I encounter. Table 2 presents the customers’ responses.
Table 2: Perceived KPLC Services as a Result of ICT System at KPLC Eldoret Perceived service quality Items I trust KPLCs’ ICT system The KPLCs’ ICT system can be counted on to do right I believe that KPLC’S ICT system takes good care The ICT system is responsible to my problems
Strongly Disagree 52(13.2%) 34(8.6%)
Disagree
Neutral
Agree 173(43.9%) 154(38.8%)
Strongly Agree 57(14.5%) 65(16.4%)
76(19.3%) 98(24.7%)
36(9.1%) 46(11.6%)
42(10.7%)
77(19.5%)
47(11.8%)
89(22.4%)
Mean 3.27 3.30
Standard deviation 1.292 1.244
67(17.0%)
147(37.3%)
61(15.5%)
3.27
1.242
59(14.9%)
155(39.0%)
47(11.8%)
3.17
1.240
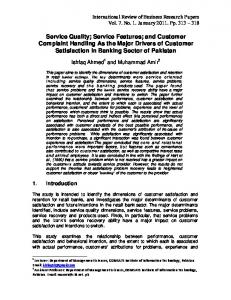
Source: Survey Data, 2010 Regarding KPLC’s ICT systems trustworthiness, a cumulative total of 32.5% disagreed while a cumulative total of 58.4% agreed. Regarding whether or not KPLC’s ICT system does what is right, a cumulative total of 33.3% disagreed while a cumulative total of 55.2% agreed. In the case of whether or not KPLC’s ICT system takes good care of customers, a cumulative total of 30.2% disagreed while a cumulative total of 52.8% agreed. As to whether or not the KPLC’s ICT system is responsive to customer’s problems, a cumulative total of 34.2% disagreed while a cumulative total of 50.8% agreed. From these results, it is clear that the proportion of agreements to the item is bigger than the proportion of disagreements. This indicates that most of the customers hold the KPLC’s ICT system in high regard. These findings clearly indicate the backing of the senior management staff. The findings from the interview schedule pertaining to the benefits of the ICT system are presented in Figure 1.
Figure 1: Benefits of use of ICT payment system 464
Journal of Emerging Trends in Economics and Management Sciences (JETEMS) 3(5):461-466 (ISSN:2141-7024) From the figure, it is clear that the main benefit brought on board by the KPLC ICT system was to make transactions easier (30.5% response). Other notable benefits include: payment made easier (20.7% response), time saving (16.8%), cost effective (11.9%), ease of accessibility (9.1%), convenience and efficiency (7%) and facilitating customer services (3.8%).
In summary, the study established that KPLC ICT system could be trusted to carry out the right transactions. It was also established that the ICT system is reliable and responsive to customer needs. The study also established that perceived service quality is positively and statistically significant (r = 0.639, p = 0.00) to customer satisfaction. From the findings, it is indicated that the Beta coefficients (service quality) β = .432, t = 7.336, p = .000, meaning that there is significance between perceived service quality through ICT and customer satisfaction.
The regression analysis revealed that there is no significance between perceived service quality through ICT and customer satisfaction. From the findings, it is indicated that the Beta coefficients (service quality) B = .432, t = 7.336, p = .000. This means that there is significance between perceived service quality through ICT and customer satisfaction.
These findings were expected since the very basis of introducing the ICT protocol was to improve services thereby raising the level of customer satisfaction. These findings are also consistent with the views of Delone and McLean (2003), Shih (2004) and Lin (2007), that service quality is the overall support delivered by the ICT Service provider and is measured in terms of assurance, empathy and responsiveness. As observed by Srivasan et al. (2002), the onus is therefore on the ICT service providers to pay attention to the pre- and postpurchase. Customer interface activities designed to facilitate both immediate transactions and long-term customer relationships.The levels of service quality as established in this study are likely it to Impact on the success of KPLC. As observed by Levesque and McDougall (2000), the outcome of a successful service is often referred to as a satisfied customer. Consequently, when customers are satisfied, then the service could be categorized as successful. These views are further echoed by Johnston (2004), that providing customers with excellent service gives the outcome of delight and this type of service includes a closer relationship between the buyer and the seller than if the outcome is satisfaction.
Challenges Encountered by KPLC in Implementation of Service Delivery via the ICT Protocol An examination of the interview schedule responses for each of the senior management staff included in the sample revealed seven key challenges facing KPLC in the provision of service via the ICT protocol. Thirty-five percent of the senior management staff pointed to the poor ICT infrastructure as the main challenge faced. High levels of illiteracy in ICT were also reported by close to 20% of the staff in the sample. Other notable challenges encountered include: financial constraints (15.7%), frequent vandalism (9.7%), frequent power disruptions (8.3%), power networking (7.1%) and limited to urban centres (3.7%).The suggested strategies by study participants to address the challenges are as shown in Table 3 below. Table 3: Suggested Strategies Strategies Adherence to KPLCs’ ICT policy Enhance capacity building Improve ICT infrastructure Carry out sensitizations campaign Enhance communication channels Respond promptly to customers’ needs Total (N=410)
Number of Respondents 39
Percentage of Respondents 10.8
64 136 71
17.7 37.6 19.6
23
6.4
29
8.0
362
100.0
CONCLUSION AND RECOMMENDATIONS Evidently, the ICT service delivery affects customer satisfaction. Considering how fast the world are moving in the development, procurement and of information and communication technology, KPLC should make immediate step to catch up if it want to keep in track. ICT brings a lot of advantages and has a great impact on human and business daily life. Therefore, ICT development is the best choice in helping KPLC stay on the track, and that is why ICT development is important for KPLC’s future.
Source: Survey Data (2010) As shown from the table, only 362 out of the 410 customers made their contributions in as far as suggested strategies are concerned. The main strategy suggested was to improve the ICT infrastructure (37.6% response). Sensitization campaigns (19.6%) and capacity building (17.7%) were the key strategies suggested. Other strategies mentioned include: adherence to the KPLC ICT policy (10.8%), prompt response to customer needs (8.0%) and enhancing communication channels (6.4%).
The government should be involved in providing environment to support KPLC to better use information technology and increase the countries competitiveness, productivity and growth through investment in information technology, e-business and new business models. The quality of the system used is bound to dictate the level of customer satisfaction. Despite the reported gains of the KPLC ICT system, several challenges have also been identified. The ICT 465
Journal of Emerging Trends in Economics and Management Sciences (JETEMS) 3(5):461-466 (ISSN:2141-7024) infrastructure in KPLC was found to fall short of expectations. Most staff and the public were computer illiterate and therefore opted not to use the system. Lack of resources was attributed to financial constraints.
Kettinger, W. J., & Lee, C. C. (1995). Perceived service quality and user satisfaction with the information services function. Decision sciences, 25(5-6): 737-765. Levesque, T., & McDougall, G. (2000). Determinants of customer satisfaction in retail banking. International journal of Bank Marketing, 14(7): 1220.
Since the study established that awareness of service provided ability to communicate, customer attitude, and service seeking habit are central to the quality of service provided. The KPLC should increase funding on resource acquisition and training of its personnel since the study identified inadequate ICT staff training and development as the main challenge encountered by KPLC in implementation of service delivery via the ICT protocol and this has a major impact affecting the quality of service delivery through use of ICT payment system. The KPLC management should train its employees in the handling of customer complaints and the importance of having positive attitude towards its customer.
Lin, H. F. (2007). The impact of website quality dimensions on customer satisfaction in the B2C Ecommerce context. Total Quality Management, 18(4): 363-378. Pitt, L. F., Watson, R. T., & Kavan, C. B. (1995). Service quality: A measure of information systems effectiveness. MIS Quarterly, 19(2): 173-188. Rogers, E. M. (1995). Diffusion of Innovations (4th ed.). New York: The Free Press.
The Company should further find out ways of motivating its employees as the study found out that lack of motivation was hampering the quality of service delivery through use of ICT system. Further still there is need for employees to exercise due care while discharging their duties. There is need for frequent customer seminar and retreats to be carried out to enable the customers to acquaint themselves with the services offered through use of ICT system. The study observed that a climate for a service and a climate for customers’ satisfaction highly correlate with overall customer perception of service quality.
Shih, H. P. (2004). An empirical study on predicting user acceptance of e-shopping on the web. Information and management, 41: 351-368. Srinivasan, S. S., Anderson, R., & Ponnavolu, K. (2002). Customer Loyalty in e-commerce: An exploration of its antecedents and consequences. Journal of Retailing, 78: 41-50. Tornatzky, L. G., & Klein, K. J. (2002). Innovation Characteristics and Innovation AdoptionImplementation: A Meta-Analysis of Findings. IEEE Transactions on Engineering Management, 29: 28-45.
REFERENCES Cranage, D. (2004). Plan to do it Right: And Plan For Recovery. International Journal of Contemporary Hospitality Management, 16(4): 210-219.
Watson, R. T., Akselsen, S., & Pitt, L. F. (1998). Attractors: building Mountains in the flat landscape of the World Wide Web. California Management Review, 40(2): 36-43.
Deighton, J. (1996). The future of interactive marketing. Harvard Business Review, 74(6): 151160.
Wong, Y. H., Thomas, K. P. L., & Suki, W. K. C. (2003). Beyond Customer Relationship Management: Information Co-Sharing and Relationship Positioning. Academy of Business & Administrative Sciences International Conferences, Brussels, Belgium.
Delone, W. H., &Mclean, E. R. (2003). The Delone and Mclean Model of information systems success: A ten-year update. Journal of Management information systems, 19(4): 9-30. Jeyaraj A., Balser, D., Chowa, C., Griggs, G. (2004). Institutional Factors influencing EBusiness Adoption. Proceedings of the Tenth Americas Conference on Information Systems, New York. Johnston, R. (2004). Towards a better understanding of service excellence. Managing Service Quality, 14(2/3): 123-133. Kenya Power and Lighting Company. (2006, May). Audit Report No. 6/2005- 6, on Customer creation. Nairobi: KPLC publication 466