Activated leukocyte cell adhesion molecule. ANGPT4. Angiopoietin 4. BDNF. Brain-derived neurotrophic factor. CXCL13 (BLC) Chemokine (C-X-C motif) ligand ...
INTEGRATED ANALYSIS OF GENETIC AND PROTEOMIC DATA By David Michael Reif Dissertation Submitted to the Faculty of the Graduate School of Vanderbilt University in partial fulfillment of the requirements for the degree of DOCTOR OF PHILOSOPHY in Human Genetics December, 2006 Nashville, Tennessee
Approved: Professor James E. Crowe Professor Douglas H. Fisher Professor Jonathan L. Haines Professor Jason H. Moore Professor Scott M. Williams
Copyright © 2006 David Michael Reif All Rights Reserved
This work is dedicated to my family—Mom, Dad, and Dan—for teaching me how to work hard and play nice with others.
And to Alison, for making me happier than I have ever been—no matter what else is going on.
iii
ACKNOWLEDGMENTS My graduate training was supported by the Vanderbilt University Interdisciplinary Graduate Program (1st year), the NIH Human Genetics Training Grant (2nd-3rd years), and my mentor, Jason H. Moore (4th-5th years). I want to acknowledge the vast contributions and support of the scientists and staff at both Vanderbilt and Dartmouth Medical School. In the Vanderbilt Center for Human Genetics Research, I wish to thank Jackie Bartlett, Kylee Spencer, Tricia Thornton-Wells, Jacob McCauley, Scott Dudek, Jeff Canter, Marylyn Ritchie, Kim Taylor, Alicia Davis, Lynn Roberts, and Maria Comer. I thank Chun Li for his insights into teaching and his philosophy on statistics in science. At Dartmouth, I would like to thank Todd Holden and Nate Barney. Special thanks go to Bill White at Dartmouth for his friendship and extensive help with computational issues, as well as stimulating discussions on topics relating to science and beyond. Special thanks also go to Brett McKinney for his support on both scientific and personal levels. Time and again, his inquisitiveness and optimism helped me find solutions to uncooperative problems. I am greatly indebted to the members of my thesis committee (James Crowe, Jr., Douglas Fisher, Jonathan Haines, Jason Moore, and Scott Williams) for their invaluable time, guidance, friendship, and support.
Their ability to
effective guide a project involving biological, computational, genetic, and immunological aspects is a testament to their diverse interdisciplinary expertise and commitment to training students. iv
TABLE OF CONTENTS
Page DEDICATION .......................................................................................................iii ACKNOWLEDGMENTS .......................................................................................iv LIST OF TABLES ............................................................................................... viii LIST OF FIGURES ...............................................................................................ix LIST OF ABBREVIATIONS .................................................................................. x Chapter I.
INTRODUCTION ....................................................................................... 1
II.
INTEGRATED ANALYSIS OF GENETIC, GENOMIC, AND PROTEOMIC DATA................................................................................... 6 A case for integrated analysis of multiple data types ...................... 7 Organisms as complex systems...................................................... 8 Biological complexity along the progression from genotype to phenotype ....................................................................................... 9 Methodology concerns and missing data ...................................... 12 Joint analysis simulation study ...................................................... 14 Simulation models .............................................................. 15 Datasets ............................................................................. 17 Data analysis...................................................................... 18 Software and hardware ...................................................... 20 Simulation results and discussion ...................................... 21 Relevance of the joint analysis simulation study and application to real data .................................................................................... 24 How realistic are the disease models? ............................... 24 How realistic is the scenario in which key functional proteins will be missing from the data analyzed? ............... 25 How realistic is the scenario in which functional SNPs are measured when key functional proteins are not? ............... 26 Conclusions and future directions ................................................. 27 Summary of key issues ................................................................. 29 Acknowledgments ......................................................................... 30 References.................................................................................... 30
v
III.
PROTEOMIC BIOMARKERS ASSOCIATED WITH ADVERSE EVENTS FOLLOWING SMALLPOX VACCINATION.............................................. 35 Introduction ................................................................................... 37 Subjects, materials, and methods ................................................. 38 Study subjects .................................................................... 38 Clinical assessments .......................................................... 39 Sample collection ............................................................... 40 Proteomic assay................................................................. 40 Statistical analysis methods ............................................... 44 Results .......................................................................................... 48 Discussion..................................................................................... 52 Acknowledgments ......................................................................... 58 References.................................................................................... 58
IV.
GENETIC POLYMORPHISMS ASSOCIATED WITH ADVERSE EVENTS FOLLOWING SMALLPOX VACCINATION .............................. 62 Introduction ................................................................................... 64 Subjects, materials, and methods ................................................. 66 Study subjects .................................................................... 66 Clinical assessments .......................................................... 67 Identification of genetic polymorphisms.............................. 67 Statistical analysis .............................................................. 98 Results .......................................................................................... 99 Demographic characteristics of subjects included in genetic analyses................................................................. 99 Genetic associations with adverse events........................ 101 Discussion................................................................................... 107 Biological mechanisms contributing to adverse events .... 107 Relationship between genetic results and proposed model of adverse events ............................................................. 108 Summary and future directions......................................... 112 Acknowledgments ....................................................................... 114 References.................................................................................. 114
V.
FEATURE SELECTION USING RANDOM FORESTS FOR THE INTEGRATED ANALYSIS OF MULTIPLE SIMULATED DATA TYPES ................................................................................................... 118 Introduction ................................................................................. 120 Methods ...................................................................................... 121 Random forests ................................................................ 124 Data simulation................................................................. 127 Data analysis.................................................................... 133 Results ........................................................................................ 134 vi
Discussion................................................................................... 139 Acknowledgments ....................................................................... 142 References.................................................................................. 142 VI.
INTEGRATED ANALYSIS OF GENETIC AND PROTEOMIC DATA IDENTIFIES BIOMARKERS ASSOCIATED WITH ADVERSE EVENTS FOLLOWING SMALLPOX VACCINATION ............................ 145 Introduction ................................................................................. 147 Subjects, materials, and methods ............................................... 149 Study subjects .................................................................. 149 Clinical assessments ........................................................ 150 Identification of genetic polymorphisms............................ 151 Quantification of serum cytokine levels ............................ 152 Random forests ................................................................ 153 Decision trees................................................................... 155 Data analysis strategy ...................................................... 156 Results ........................................................................................ 158 Filtering of important attributes using random forests....... 158 Modeling the association of genetic and proteomic biomarkers with adverse events ....................................... 164 Discussion................................................................................... 168 Acknowledgments ....................................................................... 173 References.................................................................................. 173
VII.
CONCLUSIONS AND FUTURE DIRECTIONS ..................................... 177
vii
LIST OF TABLES Table
Page
2-1
Summary of the average classification errors across one-hundred datasets for each model and each type of dataset analyzed ................... 22
3-1
Gene names and symbols of 108 protein analytes measured in 100 uL serum aliquots from the patient samples using custom dual antibody sandwich immunoassays ......................................................................... 41
3-2
Cytokines found to discriminate between AE and non-AE individuals by at least on of the three statistical methods: FDR, NSC, or SVM ......... 50
4-1
List of all 1442 SNPs analyzed for both studies....................................... 68
4-2
Summary of AE status, age, gender, and race for both studies............. 101
4-3
List of all SNPs with an AE-associated p-value ≤ 0.05 in the original study.......................................................................................... 102
4-4
Significant genetic associations consistent across both studies ............ 103
4-5
Distribution of genotypes across both studies........................................ 104
4-6
Haplotypes estimated for significant AE-associated SNPs in IRF-1 and IL-4.................................................................................................. 106
5-1
Penetrance function for a model of AE status associated with two functional attributes A and B .................................................................. 132
5-2
Example penetrance function for a simulated genetic AE model with 10% heritability ...................................................................................... 132
5-3
Overview of simulated datasets ............................................................. 132
6-1
List of all attributes having a random forest importance rank in the top 10% relative to all attributes in the combined dataset ...................... 159
viii
LIST OF FIGURES Figure
Page
2-1
Sources of variation along the biological progression from gene to protein.................................................................................................. 11
2-2
Summary of the simulation models .......................................................... 16
2-3
Summary of the dataset variations analyzed ........................................... 18
2-4
Summary of the statistical comparison of mean classification errors for each type of dataset for a given heritability and model ....................... 23
3-1
Final pruned decision-tree cytokine model for predicting AE status......... 51
4-1
Haploview plot of SNPs at chromosome 5q31.1.................................... 105
5-1
Construction of individual trees using the random forest method .......... 126
5-2
Information transfer between simulated genetic and proteomic attributes ................................................................................................ 129
5-3
Summary of data simulation strategy..................................................... 131
5-4
Relative importance of functional genetic outcome-associated attributes for each data type analyzed ................................................... 136
5-5
Relative importance of proteomic attributes related (according to the amount of genetic-proteomic information transfer along the horizontal axis) to functional genetic attributes for each data type analyzed.......... 138
6-1
Trees constructed using the random forest method from a full dataset of N individuals and M attributes............................................................ 154
6-2
Attribute importance landscape ranking all attributes in the combined dataset ................................................................................................... 163
6-3
Final model of genetic and proteomic factors contributing to the development of adverse events after vaccination .................................. 165
6-4
Interactive relationships among genetic and proteomic factors in the final model of adverse event development............................................. 167
ix
LIST OF ABBREVIATIONS °C
Degrees Centigrade
Ab
Antibody
AE
Adverse Event
APSV
Aventis-Pasteur Smallpox Vaccine
bp
Base Pair
cDNA
Complementary Deoxyribonucleic Acid
CGF
Core Genotyping Facility (http://dceg.cancer.gov/genotype.html)
Celera
Private Genome Assembly Database (http://www.celeradiscoverysystem.com/index.cfm)
CEPH
Centre d’Etude du Polymorphism Humain
CHGR
Center for Human Genetics Research
cM
CentiMorgan
CSF-3
Colony Stimulating Factor 3 (Granulocyte)
CTL
Cytotoxic T-lymphocyte
CV
Cross Validation
dbSNP
Public SNP database (http://www.ncbi.nlm.nih.gov/SNP/index.html)
df
Degrees of Freedom
dNTPs
Deoxyribonucleotides
dHPLC
Denaturing High Performance Liquid Chromatography
DMID
Division of Microbiology and Infectious Diseases (http://www.niaid.nih.gov/dmid)
DNA
Deoxyribonucleic Acid
x
DZ
Dizygotic Twins
ELISA
Enzyme-linked Immunosorbent Assay
Ensemble
Genome Browser (http://www.ensembl.org/)
FBAT
Family Based Association Tests (http://www.biostat.harvard.edu/~fbat/fbat.htm)
g
Gram
GAM
Generalized Additive Model
GASP
Genometric Analysis Simulation Program
G-CSF
Granulocyte Colony Stimulating Factor
Haploview
Java-based Tool for Visualizing LD blocks (http://www.broad.mit.edu/mpg/haploview/index.php)
HIV
Human Immunodeficiency Virus
HLOD
Heterogeneity LOD Score
HPLC
High Performance Liquid Chromatography
htSNP
Haplotype Tag Single Nucleotide Polymorphism
HWE
Hardy-Weinberg Equilibrium
IC
Imprinting Center
ICAM-1
Intercellular Adhesion Molecule-1
IFN-γ
Interferon-γ
Ig
Immunoglobulin
IL-4
Interleukin-4
IL-10
Interleukin-10
IRF-1
Interferon Regulatory Factor-1
Kb
Kilobase xi
LD
Linkage Disequilibrium
LINE
Long Interspersed Nuclear Element
LOD
Logarithm of the Odds
MALDI
Matrix Assisted Laser Desporption/Ionization
Mb
Megabase
MED
Maternal Expression Domain
MFI
Mean Fluorescence Intensity
MIG
Monokine Induced by Interferon-γ
ml
Milliliter
MLS
Multipoint LOD Score
MMP
Matrix Metalloproteinase
MMR
Measles-Mumps-Rubella
mRNA
Messenger Ribonucleic Acid
MS
Mass spectrometry
MTHFR
Methylenetetrahydrofolate reductase
MZ
Monozygotic twins
μg
Microgram
μL
Microliter
NCI
National Cancer Institute (http://cancer.gov)
NEMC
New England Medical Center
ng
Nanogram
NIAID
National Institute of Allergy and Infectious Diseases (http://www.niaid.nih.gov/)
xii
NIH
National Institutes of Health (http://www.nih.gov/)
NIMH nL
National Institute of Mental Health (http://www.nimh.nih.gov/) Nanoliter
NN
Neural Network
NSC
Nearest Shrunken Centroid
OMIM
Online Mendelian Inheritance in Man (http://www.ncbi.nlm.nih.gov/Omim)
OOB
Out-Of-Bag
OSA
Ordered-Subsets Analysis
PCR
Polymerase Chain Reaction
PDT
Pedigree Disequilibrium Test
QTL
Quantitative Trait Locus
RCAT
Rolling Circle Amplification Technology
RT
Real Time
RF
Random Forest™
SAGE
Serial Analysis of Gene Expression
SCF
Stem Cell Factor
SDA
Symbolic Discriminant Analysis
SNP
Single Nucleotide Polymorphism
SVM
Support Vector Machine
Taq
Thermus Aquaticus Polymerase
TH1
T-Helper type-1
TH2
T-Helper type-2
TIMP-2
Tissue Inhibitor of Metalloproteinase -2 xiii
UTR
Untranslated Region
VISTA
Visualization Tools for Alignment (http://www.gsd.lbl.gov/vista/)
VNTR
Variable Number Tandem Repeat
VV
Vaccinia Virus
xiv
CHAPTER I
INTRODUCTION:
INTEGRATED ANALYSIS OF GENETIC AND PROTEOMIC DATA
Biological organisms are complex systems that dynamically integrate inputs from a multitude of physiological and environmental factors. Complex clinical outcomes arise from the concerted interactions among the myriad components of a biological system.
Therefore, in addressing questions
concerning the etiology of phenotypes as complex as common human diseases or systemic reaction to vaccination, it is essential that the systemic nature of biology is taken into account. Analysis methods must integrate the information provided by each data type in a manner analogous to the operation of the body itself. It is hypothesized that such integrated approaches will provide a more comprehensive portrayal of the mechanisms underlying complex phenotypes and lend confidence to the biological interpretation of analytical conclusions. This dissertation concerns the development of the paradigm outlined above and applies it to genetic and proteomic data in both simulated and real analysis situations. Chapters two through six are presented as self-contained studies that review our philosophy and its initial applications, describe analysis of real proteomic data alone, describe analysis of real genetic data alone, describe analysis of simulated proteomic and/or genetic data, and apply all the lessons
1
learned to combined analysis of real genetic and proteomic data. Regarded in its entirety, this dissertation progresses from philosophical underpinnings to successful applications in a real-world analysis setting. Chapter II lays out the rationale behind integrated analysis strategies, reviews the current state of the art in combined analysis, and details a simulation study that addresses our hypothesis concerning situations in which the analysis of multiple data types is beneficial. The intuitive, intellectual appeal offered by joint analysis of multiple data types includes the integration of information that is insensitive to spatial and temporal flux (e.g. stable genetic polymorphisms found throughout the human genome) with information subject to dynamic changes (e.g. protein concentrations measured at multiple time points), the amelioration of possible methodological unreliability by the partial redundancy between biological levels, and the improved generalizability of results that are robust to nonsystematic variability in data from any one source. Our review of the initial forays into the joint analysis of multiple data types finds that these studies, while limited in scope, have yielded interesting results that would have been missed had only one type of data been considered. From the simulation studies, we conclude that the analysis of multiple data types is beneficial when the underlying etiological model is complex and functional biomarkers of any particular data type are missing. Chapter III introduces the smallpox vaccine trial data to which the dataintegration philosophy will be applied. In this chapter, the proteomic portion of the analysis is discussed. The proteomic data are measured concentrations of a
2
panel of immunological cytokines collected from serum samples at pre- and postvaccination time points.
The analysis identified cytokines whose changes in
dynamic concentration after vaccination accurately discriminated between subjects who suffered a vaccine-related adverse event (AE) and those who did not. We developed a model of systemic AEs that implicates a cytokine signature characterized by protraction and/or hyper-activation of inflammatory pathways. Chapter IV describes the analysis of genetic data gathered as part of the smallpox vaccine trials.
In this chapter, the same panel of single-nucleotide
polymorphisms (SNPs) was analyzed in two independent studies to investigate the relationship between AEs and stable genetic factors. The second study was held out of our original statistical analysis for use as a validation data set. The significant AE-associated genetic factors that replicated in the validation data set complement the conclusions drawn from the proteomic data.
The validated
SNPs are within genes involved in processes consistent with previously hypothesized mechanisms relating the development of AEs to prolonged stimulation of inflammatory pathways and imbalance of normal tissue damage repair pathways. Chapter V introduces random forests (RF) as promising solution to the analysis challenge posed by high-dimensional datasets including interactions among biomarkers of multiple data types.
This chapter characterizes the
performance of RF on a range of simulated datasets when given genetic data alone, proteomic data alone, or a combined dataset of genetic plus proteomic data. The results indicate that utilizing multiple data types is beneficial when the
3
disease model is complex and the phenotypic outcome-associated data type is unknown.
This study also shed light on the nature of effects that could be
detected by random forests analysis. The simulation results were used to refine the parameters of RF implemented for analysis of the combined genetic and proteomic vaccine trial data in Chapter VI. Chapter VI applies the lessons learned in previous chapters to the analysis of high-dimensional, combined genetic and proteomic data collected to elucidate mechanisms underlying development of adverse events (AEs) in patients following smallpox vaccination.
In a two-stage analysis strategy,
Random Forests were used to identify the most important genetic and proteomic biomarkers from a combined dataset, then the selected attributes were used to build a final decision tree model of AE development. Combining information from previous studies on AEs related to smallpox vaccination with the genetic and proteomic attributes identified by RF, we built a comprehensive model of AE development that includes both genetic and proteomic biomarkers.
These
results demonstrated the utility of the RF for integrated analytical tasks, while both enhancing and reinforcing our working model of AE development following smallpox vaccination. Chapter VII discusses future directions for integrated analysis strategies that capitalize on the lessons learned in this dissertation. It is hoped that this body of work lends credence to the notion that integration of multiple data types is the only way to truly represent a complex system. Given the rapid expansion of technologies able to generate immense quantities of data, it is anticipated that
4
the incorporation of multiple data types will become the standard—rather than the exception—for studies of complex human health and disease.
5
CHAPTER II
INTEGRATED ANALYSIS OF GENETIC, GENOMIC, AND PROTEOMIC DATA
The rapid expansion of methods for measuring biological data ranging from DNA sequence variations through mRNA expression through protein abundance presents the opportunity to utilize multiple types of information jointly in the study of human health and disease. Organisms are complex systems that integrate inputs at myriad levels to arrive at an observable phenotype. Therefore, it is essential that questions concerning the etiology of phenotypes as complex as common human diseases take the systemic nature of biology into account and integrate the information provided by each data type in a manner analogous to the operation of the body itself. While limited in scope, the initial forays into the joint analysis of multiple data types have yielded interesting results that would not have been reached had only one type of data been considered. These early successes, along with the aforementioned theoretical appeal of data integration, provide impetus for the development of methods for the parallel, high-throughput analysis of multiple data types.
We present as a
working hypothesis the idea that the integrated analysis of multiple data types will improve the identification of biomarkers of clinical endpoints such as disease susceptibility.
6
A Case for integrated analysis of multiple data types
Technology has advanced to the point that variations in DNA sequence, mRNA expression levels, and a wide spectrum of protein abundance can each be measured with manageable efficiency. The development of single nucleotide polymorphism (SNP) typing technology can identify minute DNA sequence variations between samples [1-5]. Oligonucleotide and cDNA microarrays can simultaneously measure the expression (mRNA) levels of thousands of genes simultaneously [6-8]. Mass spectrometry (MS) techniques can characterize huge swatches of the spectrum of proteins in a given sample [9-13]. Taken together, these technologies provide a veritable flood of information to the researcher. Given the wealth of publications devoted to extending these methods, as well as their becoming less expensive and more accessible, it is expected that the availability of such data will continue to expand [14-16]. Here, we present a working hypothesis that the joint analysis of multiple data types will improve the detection of biomarkers diagnostic of clinical endpoints. The expected benefits offered by joint analysis of multiple data types over singular analysis include provision of surrogate data to fill gaps in data from any one biological level, amelioration of some methodological unreliability via the partial redundancy between stages, integration of information that is insensitive to spatial and temporal flux (e.g. SNPs) with information subject to dynamic changes (mRNA, protein), and recognition that organisms are systems comprising many layers of complexity. We review the state of the art in joint
7
analysis of multiple data types and then present a preliminary simulation study that addresses our working hypothesis.
Organisms as Complex Systems
The huge bodies of data generated by high-throughput experiments have given rise to the notion that analysis methods for “omic” data are needed [14, 17]. Presently, the analysis methods concentrate on mining data generated by a single type of experiment. Ge et. al [14] call for the integration of functional genomic and proteomic techniques with annotation information, signaling a step toward joint analysis—transitioning from traditional, stand-alone biology towards a systemic “modular biology” approach. A modular biology approach studies biological processes of interest (modules) as complex systems of functionally interacting components. Incorporating annotation information provides a more complete picture of the organismal system, complementing and extending the information provided by raw experimental data.
While the use of annotation
information is attractive, limiting factors include the unreliability of available annotation databases and the wide variability of information provided by such data sources [18, 19]. Initial attempts aimed at developing methods for incorporating multiple types of experimental data into analysis of a biological system have met with some success. For example, Perrin et al. have developed an array method to measure a limited collection of nucleic acids and proteins in a single experiment
8
[20]. Yeger-Lotem and Margalit have integrated information from various cellular networks to detect regulatory circuits in S. Cerevisiae [21]. Other groups, using lower animals as experimental models, have made strides toward an integrative analysis of multiple data types on a small scale [22, 23]. However, at present, high-throughput analysis methods for human data have not been put forth, and most studies thus far have concentrated on development of methodological measurement reliability, rather than procedures for the analysis itself.
Biological complexity along the progression from genotype to phenotype
The central dogma of biology states that information progresses from DNA to mRNA to protein [24]. At each stage in this hierarchy, variation is introduced, meaning that inferences made about a later stage based upon measurements taken at an earlier stage will have an inherent amount of uncertainty. Indeed, there have been many studies published regarding the poor correlation of mRNA levels with protein [8]. Additionally, an enormous diversity of RNA transcripts and proteins is encoded by a given DNA sequence [24]. Since living organisms are complex systems, it follows that the study of their inner workings will be replete with emergent properties that are not predictable from the simple sum of parts [25]. The dynamic flux of protein levels is more complex than can be inferred by examining simple mRNA transcripts, and far more complex than can be inferred by examining DNA sequence. The same holds for the prediction of mRNA levels from DNA. While it may be possible to characterize certain SNPs as up- or
9
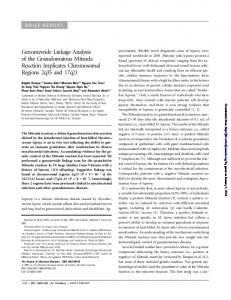
down-regulating expression, mRNA levels in the organism as a whole cannot be perfectly predicted at this time. Thus, examination of only a single type of data does not provide a valid description of any biological system. The sources of introduced variation are myriad (see Figure 1). Between DNA sequence and production of mRNA transcripts, there exists transcriptional control by proteins, proximal and distal control elements, imprinting via methylation, action by enzymes such as histone acetylases/deacetylases, and differences in stability of transcripts [24, 26]. For example, DNA methylation is known to affect gene expression and genomic stability, with major implications in human disease [27]. The initial mRNA transcript is still subject to multiple layers of modification before it is translated into protein.
Recent studies have
highlighted the prevalence of alternative splicing and A to I editing [28]. Many transcripts are cleaved into multiple bioactive products [29]. Additionally, there are translational controls that determine first if, then the abundance of, translation of a particular messenger RNA into peptide. Upon translation, the polypeptide chain must still fold into its functional conformation. Folding is a complex process requiring the interplay of intracellular conditions, chaperones, and other factors that vary by cell. Once a protein has reached its native conformation (folded state), it has a finite lifetime subject to cellular conditions, targeted degradation by ubiquitination, and enzymatic modification—all of which create wide temporal flux in protein levels. Proteins must be transported to the proper location, then correctly processed by the cell in which they are needed, adding spatial variability to protein levels within multicellular organisms.
10
Thus, the simple
presence of a protein at any one experimental point in time and space may not be representative of the true biology of an organism.
Biological Level
Biomolecule
Genetic
DNA
Sources of Biological Variation Between Levels Chromatin Conformation Genetic Imprinting Differential Transcription Genetic Mosaicism Multiple Open Reading Frames Functional Intronic Sequences (Enhancers, etc.)
Genomic
mRNA Alternative Splicing A to I Editing Differential Translation Varying Half-Life of Transcripts Proper Transport from Nucleus to Cytoplasm Enzymatic Cleavage or Modification of Transcripts
Met
Protein
Ser
Ar g
Ar g
Proteomic
Phe
Degredation (by Ubiquitination, etc.) Post-Translational Modification Folding Ability (Intracellular Conditions, Chaperones, etc.) Proper Processing and Targeting of Folded Protein
Figure 1. Sources of variation along the biological progression from gene to protein. For each biological level, those phenomena listed introduce variability from 1) DNA sequence through nascent mRNA transcript, 2) immature RNA transcript through nascent polypeptide, and 3) unfolded polypeptide through protein in its native conformation.
A typical simplifying corollary of the central dogma is that phenotype is determined solely by the action of proteins.
Adhering to such a model,
measuring protein levels alone would be perfectly predictive of disease. In vivo, each step in the progression exerts influence over the other steps, both along the
11
normal progression and in a feedback manner. The idea of deviations from the central dogma is well documented [24, 30]. Proteins such as transcription factors regulate the expression of genes. Members of the mammalian LINE-1 family encode the necessary products to ensure retrotranscription. Small interfering RNAs mediate post-transcriptional gene silencing via the RNA interference pathway [31]. degredation.
Proteins regulate other proteins via ubiquitins functioning in Outside environmental influences may also alter the normal
progression. Given these deviations from the central dogma, it is important to obtain information from multiple levels of the hierarchy.
It is evident that
measuring proteins alone could miss vital information regarding the enormous complexity of biological systems.
Methodology concerns and missing data
Useful data is currently measurable at each of the three main stages along the biological progression from DNA to mRNA to protein.
However, the
techniques used to gather data at each stage introduce experimental error in excess of the inherent biological variation in measurement. Current SNP typing methods can accurately and rather efficiently identify differences in nucleotide sequences. The primary limitation to gathering SNP data is the cost—in terms of both time and money—of sample acquisition. Although the monetary cost of SNP typing is steadily decreasing, there remain technical issues with such popular methods as Matrix Assisted
12
Laser Desorption/Ionization Mass
Spectrometry (MALDI-MS), where efficiency is limited by the size of DNA products that can be analyzed and the stringent purification necessitated because of adduct formation of alkali ions with the phosphate linkages of DNA [5]. Techniques such as Serial Analysis of Gene Expression (SAGE), RT-PCR, and Oligonucleotide or cDNA microarrays can quantitatively measure gene expression levels. Microarrays and SAGE can measure expression levels for thousands of genes simultaneously. Nonetheless, substantial question marks with these high-throughput methods include the binding behavior of promiscuous probes in a convoluted solution, quantitative reliability, and the fact that gene expression is both temporally and spatially variable—meaning that microarray results only represent conditions at a particular time point in a particular population of cells.
The various flavors of mass spectrometry are adept at
identifying proteins in a sample.
However, there are important sources of
unreliability in MS experiments, including the complex physicochemistry of samples with differing ionization tendencies and structural complications, the difficulty in tuning the instrument to accurately measure a broad mass range of samples, and the correct separation of peaks in spectra [32-35].
Of vital
importance is the fact that the wide spatial and temporal flux of proteins in an organism means that even a perfect measurement is at best a chance snapshot of proteomic action. Outside of data that may be missing due to technical errors, it is very probable that important data could be missing because researchers chose not to collect it. For example, SNP typing usually focuses on coding sequences, yet
13
involvement of distal control elements or other non-coding regions of DNA is commonplace [36].
Additional monetary concerns govern any experiment,
limiting the amount and types of data that may be collected. Time is also a factor, as the pressure to publish and the transiency of personnel put effective limits on the duration of a study. These factors may limit the collection of data at a given level. Missing data, whether arising from methodological error or holes in experimental design, can confound any analysis and thus inferences made about molecular etiology.
Such a scenario presents an excellent case for the
integration of information from multiple biological levels.
Joint analysis simulation study
We anticipate that the collection of suitable data for joint analysis will become commonplace in the near future. As preparation for the availability of such data, we have developed a simulation to test our working hypothesis that the integrated analysis of multiple data types will improve the identification of biomarkers of clinical endpoints. The simulation represents an experiment in which SNP and protein data have been collected for two hypothetical diseases. Certain variables are then selectively deleted from the complete SNP and protein dataset to represent a situation in which relevant information is missing from the data to be analyzed. These “missing data” variants of only SNP, only protein, or partially missing protein data are evaluated to discern whether joint analysis offers benefits in any of these situations.
14
Details of the simulation study—
including the simulation models generated, the datasets analyzed, the analysis method chosen, the software and hardware used, and the results—are presented in subsequent sections of this chapter. A discussion of the relevance of this study and its application to real data is also presented.
Simulation models Figure 2 illustrates the general modeling strategy. We begin by simulating two unlinked and uncorrelated SNPs with equal allele frequencies and genotypes consistent with Hardy-Weinberg proportions. Each SNP additively explains 30% or 60% of the variation in its respective protein levels. Thus, the mean protein level associated with the heterozygotes is midway between the two homozygotes.
Genotypes and protein levels were simulated using the
Genometric Analysis Simulation Package or GASP [37]. Each protein level is then categorized as high, medium, or low with frequencies of 0.25, 0.50, and 0.25, respectively. Disease susceptibility is dependent on an interaction between the two proteins. Under disease model A, subjects affected with the disease have medium or high protein levels for both proteins while those that are unaffected have low protein levels for at least one of the proteins. Under disease model B, subjects are affected if they have medium protein levels for the first protein or the second protein but not both. This is based on the nonlinear XOR function that is not linearly separable. The difference between these two models is that the two proteins in model A each have an independent main effect on disease susceptibility in addition to an interaction effect while the proteins in
15
model B only have an interaction effect. Models similar to A and B have been described previously by Li and Reich [38] and Moore et al. [39]. A total of four different simulation models were used in the present study.
Each model
combined the amount of protein variation explained (30% or 60%) with each disease model (A or B).
Figure 2. Summary of the simulation models. Protein levels are simulated using an additive genetic model that explains either 30% or 60% of their variation. Protein levels are then discretized into high, medium, and low groups. Under disease models A and B, the probability (P) of disease (D) is dependent on the combination of protein levels (PL) present. Here, P(D|PL) = 0 or 1.
16
Datasets Each dataset consisted of a total of 100 subjects that were simulated using each of the four models. Approximately half of the subjects were affected and half unaffected. A total of 100 datasets were simulated using each of the four models. We then took each dataset and created seven new datasets that consisted of 1) all the SNP and protein variables, 2) both SNPs and protein 1, 3) both SNPs and protein 2, 4) just the two SNPs, 5) just the two proteins, 6) just protein 1, and 7) just protein 2 (Figure 3).
This study design allows us to
evaluate the benefit of having multiple data types when all the functional variables are present in the dataset or only certain subsets of variables are present.
17
Figure 3. Summary of the dataset variations analyzed. Variables included in each dataset variation are shaded
Data analysis The test of our working hypothesis that the integrated analysis of multiple data types will improve the identification of biomarkers of clinical endpoints involved two primary analysis goals. The first goal was to model the relationship between each set of genetic and proteomic variables and the clinical endpoint. While many analysis methods, such as Neural Networks, Regression, Generalized Additive Models, and others may prove useful for accomplishing this goal, the symbolic discriminant analysis method, or SDA [40-43], was selected for use here because of its flexibility for modeling different data types. SDA is a 18
supervised pattern mining approach that carries out variable selection and model selection simultaneously and automatically. Using evolutionary computation as the parallel search strategy, SDA builds discriminant functions from a list of mathematical operators and explanatory variables that can distinguish between disease classes in the data. In this study, we provided the selected genetic and proteomic explanatory variables, plus basic model building blocks consisting of arithmetic functions (e.g. +, -, *, /) and additional mathematical functions (e.g. log, exp, sqrt, abs, sine, cos) as has been suggested by Reif et al. [43]. SDA was thus free to construct classification models consisting of any combination of the above mathematical functions and biological variables, without any further a priori specification of model structure.
Therefore, no assumptions about the
relationships among the variables need be pre-specified, and since it has the flexibility to operate on continuous or discrete variables, SDA is a logical choice for handling multiple data types. The goal of the evolutionary search is to identify the combination of variables and functions that minimizes the overlap of the distributions of symbolic discriminant scores among affected and unaffected subjects.
A classification error of zero indicates there is no overlap among the
symbolic discriminant score distributions.
Because we are modeling only
functional variables in this study, we applied SDA directly to the entire dataset to get an estimate of the classification error. Thus, overfitting (spurious selection of noise variables) is not a concern here and the cross-validation and permutationtesting methods suggested by Moore [44] are not necessary.
19
The second goal of the data analysis was to determine whether there are differences in classification error when different subsets of variables are used in the analysis, simulating a situation wherein data are missing. Mean classification errors between dataset types defined in Figure 3 were evaluated using a paired ttest. The resulting p-values for the differences in the mean classification errors between datasets were compared to determine which types of missing data had the most significant effect on disease classification and to identify situations in which integrating multiple data types was beneficial.
Software and hardware The SDA algorithms are programmed in C and integrated into the lil-gp software package (http://garage.cps.msu.edu/software/software-index.html) that was used to carry out genetic programming. In this study, we carried out the parallel search using grammatical evolution, a variation on genetic programming that utilizes Backus-Naur Form grammars to specify construction of SDA models [45].
The SDA modeling was carried out on the VAnderbilt Multi-Processor
Integrated Research Engine or VAMPIRE, a 380-processor Beowulf-style parallel computer system running the Linux operating system. Each population consisted of 100 individuals.
We allowed the genetic programs to run a total of 100
iterations. A recombination frequency of 0.6 was used along with a mutation frequency of 0.02. These parameters are standard for evolutionary searches [46].
20
Simulation results and discussion Table 1 summarizes the average classification errors across the 100 datasets for each of the four models and each of the combinations of variables analyzed.
Figure 4 illustrates the statistical comparison of the mean
classification errors resulting from the analysis of each combination of variables for each of the four models. As in real-world data, there was overlap in the distribution of continuous protein values, thus precluding SDA from achieving perfect classification. For model A, SDA achieved the lowest classification error when given both functional proteins alone. This is expected because disease status was assigned based upon protein levels, meaning there is no noise in this dataset. The phenomenon of increased classification error in datasets with both SNP and protein data compared with both proteins alone would have been mitigated using models with higher heritability between genotype and protein level. The mean classification errors for those datasets consisting of only SNPs was significantly higher than those including protein data as the variation explained by SNPs decreased to 30%. Such a result is expected since there was not a deterministic relationship between the SNPs and the protein levels. SNP data was of increasing utility for classification as the percent variation in protein levels explained by the SNPs increased from 30% to 60%. In the case where SNP variation explained 60% of variation in protein levels, the inclusion of SNP data with either protein classified significantly better than either protein alone. The mean classification error associated with either protein (P1 or P2) alone was consistently high, indicating that information (in SNP or protein form)
21
on both functional proteins is necessary for classification of the disease endpoint. The results for model A suggest that having multiple types of data is beneficial when the etiological model is complex and one or more variables may be missing.
Table 1. Summary of the average classification errors across 100 datasets for each model and each type of dataset analyzed. 1
Mean classification error for each type of dataset
2
Model A 30% A 60% B 30% B 60%
S1 S2 P1 P2 0.1438 0.1359 0.3313 0.3068
S1 S2 P1 0.1981 0.1584 0.3567 0.3231
S1 S2 P2 0.1877 0.1550 0.3573 0.3226
S1 S2 0.3098 0.2108 0.3946 0.3673
P1 P2 0.1133 0.1008 0.2900 0.2848
P1 0.1891 0.1913 0.3532 0.3468
P2 0.1855 0.1937 0.3517 0.3518
1
Combination of variables analyzed where S1 = SNP1, S2 = SNP2, P1 = Protein1, P2 = Protein2 2
A = disease model A (interaction plus main effect), B = disease model B (just interaction), 30% = 30% of the protein variation explained by additive genetic model, 60% = 60% of the protein variation explained by additive genetic model.
The results for model B mirror the pattern seen with model A. The major difference is that the raw classification errors across model B datasets are higher because the underlying disease model is more complex. The best results were for dataset variants in which both proteins were present because other variants are missing a critical variable for modeling the interaction. This is expected since model B is not linearly separable, and there is thus a deterministic relationship between both protein levels and disease risk. As in model A, the inclusion of SNP data was of additional utility as the variation in protein levels explained by
22
the SNPs increased. These results suggest that the joint analysis of multiple data types—in this case, SNP and protein—improves modeling when one of the functional proteins is absent and the etiological model consists of a nonlinear interaction in the absence of main effects.
S1S2P1P2
S1S2P1P2
30%
S1S2P1 ### S1S2P2 ### ###
S1S2 ### ### ###
P1P2 ### ### ### ###
P1P2 ### ### ### ###
S1S2P1P2
P1
P 1P 2
S 1S 2
S 1S 2 P 2
S1S2P1P2
30%
S1S2P1 ###
60%
S1S2P1 ###
S1S2P2 ### ###
S1S2 ### ### ###
P1P2 ### ### ### ###
P1P2 ### ### ### ###
P≤ > .01
P1
P 1P 2
S 1S 2
S 1S2 P 2
S 1S2 P 1
S 1S2 P1P 2
P2
P1
P 1P 2
P2 ### ### ### ### ### ###
S 1S 2
P2 ### ### ### ### ### ### S 1S2 P 2
P1 ### ### ### ### ###
S 1S2 P 1
P1 ### ### ### ### ###
P2
S1S2P2 ### ###
S1S2 ### ### ###
S 1S2 P1P 2
B
S 1S 2 P 1
S 1S2 P 1P 2
P2
P1
P 1P 2
P2 ### ### ### ### ### ###
S 1S 2
P2 ### ### ### ### ### ### S 1S 2 P 2
P1 ### ### ### ### ###
S 1S 2 P 1
P1 ### ### ### ### ###
P2
S1S2P2 ### ###
S1S2 ### ### ###
S 1S2 P 1P 2
A
60%
S1S2P1 ###
P ≤ .01
Figure 4. Summary of the statistical comparison of mean classification errors for each type of dataset for a given heritability (30% or 60%) and model (A or B). Mean classification errors between dataset types defined in Figure 3 were evaluated using a paired t-test. The resulting p-values for the differences in the mean classification errors between datasets are shaded according to the level of statistical significance.
23
Relevance of the joint analysis simulation study and application to real data
How realistic are the disease models? For this study we assumed that disease risk was determined by an interaction between two proteins. The primary difference between interaction models A and B is that each protein in model A also has an independent main effect on disease risk whereas the proteins in model B only influence disease through a nonlinear interaction. The ultimate utility of this study depends on how realistic these models are. While it is unlikely that any human disease follows either of these models exactly, Moore [47] has made the argument that nonlinear interactions among biomarkers are likely to play a more important role in the etiology of common diseases than the independent main effects of any one biomarker. This argument is based on several key ideas. First, the idea that interactions are important has been around for nearly 100 years [48]. Second, the ubiquity of biomolecular interactions at the transcriptional, translational, and biological network levels suggests that interactions are likely to play a very important role in disease susceptibility.
Third, studies of single biomarkers
typically don’t replicate. Finally, nonlinear interactions are commonly found when properly investigated. Thus, while model B may not be an accurate model for any one disease, it does fall into a category of models that are likely to represent the complexity of the genotype to phenotype mapping relationship.
24
How realistic is the scenario in which key functional proteins will be missing from the data analyzed? The models used in this study assume that proteins are the key etiological agents for determining disease susceptibility. How likely is it that one or more of the functional proteins might be missing from a given dataset?
Given the
technical difficulties in accurately measuring and reliably identifying large numbers of proteins in a single experiment, it is very likely that there may be holes in the protein profile.
The current state of the art is to employ some
combination of methods such as 2-D gels, HPLC, tryptic digestion, and one of the variety of mass spectrometric methods. Each of these procedures introduces its own set of methodological biases and is ideally honed to precisely identify proteins meeting a narrow range of criteria. Thus obtaining a reliable portrait of a wide range of proteins—both within and across samples—is a vexing problem. In a mass spectrometric analysis, the chemical noise characteristic of the raw data is normalized away—often obscuring or deleting peaks representing proteins in low abundance, which may be important players in protein-protein interactions. The correct identification of a particular protein species’ spectral peak in large-scale spectrometric analyses is an active area of research for both academics and instrumentation providers [35].
Aside from the procedural
difficulties of proteomics, the dynamic nature of proteins in tissue provides a daunting challenge. Proteins are in continual spatial and temporal flux; thus even an experimentally perfect profile of proteins would represent only a snapshot of protein action in the organism for a given region and a given time slice. Additionally, preserving the native state of protein molecules subject to 25
denaturation,
post-translational
modification,
and
other
physico-chemical
alterations until they can be processed can confound any analysis.
How realistic is the scenario in which functional SNPs are measured when key functional proteins are not? SNPs hold great promise as biomarkers of human disease for several reasons. First, more than 10 million SNPs have been described throughout the human genome.
Efforts are underway to determine the minimal subset
necessary to capture all the common variation in the genome. Second, they are relatively easy to measure using a variety of high-throughput technologies. As these methods become less expensive over the next several years it will be possible to measure hundreds of thousands to millions of SNPs in each of thousands of samples. One can envision a time in the near future when it will be possible to measure a set of non-redundant SNPs in every gene in the genome—although the availability of genome-wide SNP data presents its own set of computational challenges [49]. Third, barring somatic mutations, SNPs do not change in time and space in an individual. This is in contrast to both mRNA and protein expression levels that are highly variable across both time and space. Fourth, SNPs can have functional consequences on both the levels and types of proteins expressed. Given the limitations of proteomic technologies as described above, SNPs hold great promise as biomarkers of human disease. This study indicates that the addition of SNPs to protein information may be beneficial. It is reasonable to assume that it will be easier, and perhaps even less expensive, to measure a comprehensive set of SNPs than a comprehensive 26
set of expressed proteins due to technological limitations and the enormous variability of protein expression. If this is true, combining SNPs with proteomics data will be a powerful strategy.
Conclusions and future directions
In the present study, we present a working hypothesis that the joint analysis of genetic and proteomic data will provide more information for modeling disease susceptibility than either alone.
In the context of the simulations
performed, we conclude that the availability of multiple types of data is beneficial when the underlying etiological model is complex and one or more of the functional variables are missing.
These results provide a baseline for those
planning to collect and/or analyze genetic, genomic, and proteomic data from the same samples. This study represents a first step towards evaluating the merits of combining genetic, genomic, and proteomic data from the same samples for the detection and characterization of biomarkers of human disease susceptibility. From these initial simulation studies, we make the following recommendations. First, when the underlying etiology of the disease is likely to be complex, measuring multiple types of data is advantageous, especially if it is also likely that the technologies are limited in their ability to measure all biomarkers. Thus, we recommend that SNP data be measured in addition to gene expression and/or protein data. Second, we recommend that the multiple types of data be
27
analyzed jointly. In the present study, a SNP-protein interaction was found when the etiological model consisted of two interacting proteins and one of the two proteins was missing for technical reasons from the datasets. It is interesting to note that the analysis of each type of data separately may also be beneficial. For example, in the case that the functional SNPs and the functional proteins are all present in their respective datasets, separate analyses may provide a type of cross-validation. That is, confidence in the inferences made about the functional biomarkers could be increased if the SNPs and proteins discovered through statistical modeling are related to the same set of genes. Finally, we recommend that additional simulations be carried out under a wider array of etiological models and dataset variations to fully evaluate the usefulness of the joint analysis of multiple types of data.
These types of studies should prove
invaluable to those planning to measure genomic and proteomic data from the same samples. The next five years will see the joint analysis of multiple data types become the standard, rather than the exception, in the study of complex human health and disease. Given the rapid expansion of technologies able to generate huge bodies of data, as well as their increasing acceptance in the biomedical research community, we anticipate real datasets appropriate for joint analysis will become increasingly common in the near future.
The burgeoning field of
research into high-throughput technologies will lead to continued improvements in cost-efficiency and reliability and make their use even more widespread. With these data in hand, joint analysis of multiple biological levels becomes a viable
28
option. The notion that integration of multiple data types is the only way to truly represent a complex system flows naturally from the complexity revealed as biologists gain a deeper understanding of common disease etiologies.
Summary of key issues
•
Biological organisms are complex systems integrating information at myriad levels to arrive at observable phenotypes.
•
Achieving a meaningful understanding of complex phenotypes demands the joint analysis of multiple types of information.
•
Development of high-throughput technologies will continue; nonetheless, there will always be issues—whether reflecting biological flux or methodological error—with data collected from any single experiment.
•
Benefits offered by joint analysis of multiple data types over singular analysis include provision of surrogate data to fill gaps in data from any one biological level, amelioration of some methodological unreliability via the partial redundancy between stages, integration of information that is insensitive to spatial and temporal flux (e.g. SNPs) with information subject to dynamic changes (mRNA, protein), and evaluation of organisms as systems comprising many layers of complexity.
•
Datasets amenable to integrated analysis will become increasingly common in the near future, and the joint analysis of multiple data types will become the norm, rather than the exception.
29
Acknowledgments
This work was supported by generous funds from the Robert J. Kleberg, Jr. and Helen C. Kleberg Foundation. This work was also supported by National Institutes of Health grants HL-68744, CA-084239, CA-90949, CA-95103, CA98131, LM-07613, AI-057661, and GM-62758-04.
References
1.
Pusch W, Wurmbach JH, Thiele H et al. MALDI-TOF mass spectrometrybased SNP genotyping. Pharmacogenomics. 3(4), 537-48 (2002).
2.
Ye S, Liang X, Yamamoto Y et al. Detection of single nucleotide polymorphisms by the combination of nuclease S1 and PNA. Nucleic Acids Res Suppl. (2), 235-6 (2002).
3.
Bocker S. SNP and mutation discovery using base-specific cleavage and MALDI-TOF mass spectrometry. Bioinformatics. 19 Suppl 1, I44-I53 (2003).
4.
Iwasaki H, Ezura Y, Ishida R et al. Accuracy of genotyping for single nucleotide polymorphisms by a microarray-based single nucleotide polymorphism typing method involving hybridization of short allele-specific oligonucleotides. DNA Res. 9(2), 59-62 (2002).
5.
Sauer S, Gut IG. Genotyping single-nucleotide polymorphisms by matrixassisted laser-desorption/ionization time-of-flight mass spectrometry. J Chromatogr B Analyt Technol Biomed Life Sci. 782(1-2), 73-87 (2002).
6.
Liang M, Cowley Jr AW, Greene AS. High throughput gene expression profiling: A molecular approach to integrative physiology. J Physiol. [Epub ahead of print] (2003).
7.
Huang JX, Mehrens D, Wiese R et al. High-throughput genomic and proteomic analysis using microarray technology. Clin Chem. 47(10), 19126 (2001).
30
8.
Grant GR, Manduchi E, Pizarro A et al. Maintaining data integrity in microarray data management. Biotechnology Bioengineering. 84 (7), 795800 (2003).
9.
Lion N, Rohner TC, Dayon L et al. Microfluidic systems in proteomics. Electrophoresis. 24(21), 3533-62 (2003).
10.
Marko-Varga G, Nilsson J, Laurell T. New directions of miniaturization within the proteomics research area. Electrophoresis. 24(21), 3521-32 (2003).
11.
Bodnar WM, Blackburn RK, Krise JM et al. Exploiting the complementary nature of LC/MALDI/MS/MS and LC/ESI/MS/MS for increased proteome coverage. J Am Soc Mass Spectrom. 14(9), 971-9 (2003).
12.
Zhang S, Van Pelt CK, Henion JD. Automated chip-based nanoelectrospray-mass spectrometry for rapid identification of proteins separated by two-dimensional gel electrophoresis. Electrophoresis. 24(21), 3620-32 (2003).
13.
Aebersold R, Mann M. Mass spectrometry-based proteomics. Nature. 422(6928), 198-207 (2003).
14.
Ge H, Walhout AJ, Vidal M. Integrating 'omic' information: a bridge between genomics and systems biology. Trends Genet. 19(10), 551-60 (2003).
15.
Cavalcoli JD. Genomic and proteomic databases: large-scale analysis and integration of data. Trends Cardiovasc Med. 11(2), 76-81 (2001).
16.
Navarro DJ, Niranjan V, Peri S. From biological databases to platforms for biomedical discovery. Trends in Biotechnology. 21(6), 263-268 (2003).
17.
Celis JE, Gromov P, Gromova I et al. Integrating Proteomic and Functional Genomic Technologies in Discovery-driven Translational Breast Cancer Research. Mol Cell Proteomics. 2(6), 369-77 (2003).
18.
Camon E, Magrane M, Barrell D et al. The Gene Ontology Annotation (GOA) project: implementation of GO in SWISS-PROT, TrEMBL, and InterPro. Genome Res. 13(4), 662-72 (2003).
19.
Mitchell JA, McCray AT, Bodenreider O. From phenotype to genotype: issues in navigating the available information resources. Methods Inf Med. 42(5), 557-63 (2003).
31
20.
Perrin A, Duracher D, Perret M et al. A combined oligonucleotide and protein microarray for the codetection of nucleic acids and antibodies associated with human immunodeficiency virus, hepatitis B virus, and hepatitis C virus infections. Anal Biochem. 322(2), 148-55 (2003).
21.
Yeger-Lotem E, Margalit H. Detection of regulatory circuits by integrating the cellular networks of protein-protein interactions and transcription regulation. Nucleic Acids Res. 31(20), 6053-61 (2003).
22.
Walhout AJ, Reboul J, Shtanko O et al. Integrating interactome, phenome, and transcriptome mapping data for the C. elegans germline. Curr Biol. 12(22), 1952-8 (2002).
23.
Ge H, Liu Z, Church GM et al. Correlation between transcriptome and interactome mapping data from Saccharomyces cerevisiae. Nat Genet. 29(4), 482-6 (2001).
24.
Strachan T, Read AP. DNA structure and gene expression. In: Human Molecular Genetics (3rd Ed.). Garland Science, New York, USA, 13-31 (2004).
25.
Holland JH. Hidden Order: How Adaptation Builds Complexity. Perseus Publishing, Cambridge, USA (1996).
26.
Luthi-Carter R, Apostol BL, Dunah AW et al. Complex alteration of NMDA receptors in transgenic Huntington's disease mouse brain: analysis of mRNA and protein expression, plasma membrane association, interacting proteins, and phosphorylation. Neurobiol Dis. 14(3), 624-36 (2003).
27.
Novik KL, Nimmrich I, Genc B et al. Epigenomics: Genome-Wide Study of Methylation Phenomena. Current Issues in Molecular Biology. 4(1), 111128 (2002).
28.
Mass S, Rich A, Nishikura K. A-to-I RNA editing: recent news and residual mysteries. Journal of Biological Chemistry. 278(3), 1391-1394 (2003).
29.
Tankaka S. Comparative aspects of intracellular proteolytic processing of peptide hormone precursors: studies of proopiomelanocortin processing. Zoological Science. 20(10), 1183-1198 (2003)
30.
Mattick JS. Challenging the dogma: the hidden layer of non-protein-coding RNAs in complex organisms. Bioessays. 25(10), 930-939 (2003).
31.
Wall NR, Shi Y. Small RNA: can RNA interference be exploited for therapy? Lancet. 362(9393), 1401-1403 (2003).
32
32.
Mamyrin BA. Time of Flight Mass Spectrometry: Concepts, Achievements, and Prospects. International Journal of Mass Spectrometry. 206, 251-266 (2001).
33.
Gentzel M, Kocher, T, Ponnusamy S et al. Preprocessing of tandem mass spectrometric data to support automatic protein identification. Proteomics. 3(8), 1597-16-10 (2003).
34.
Liebler DC. In: Introduction to Proteomics, Tools for the New Biology. Human Press, Totowa, NJ, USA, 62 (2002).
35.
Wool A, Smilanksy Z. Precalibration of matrix-assisted laser desorption/ionization-time of flight mass spectra for peptide mass fingerprinting. Proteomics. 2 (10), 1365-1373 (2002).
36.
Xin L, Liu DP, Ling CC. A hypothesis for chromatin domain opening. Bioessays. 25 (5), 507-514 (2003).
37.
Wilson AF, Bailey-Wilson JE, Pugh EW, et al. The Genometric Analysis Simulation Program (G.A.S.P.): A software tool for testing and investigating methods in statistical genetics. American Journal of Human Genetics. 59, A193 (1996).
38.
Li W, Reich J. A complete enumeration and classification of two-locus disease models. Hum Heredity. 50(6), 334-349 (2000).
39.
Moore JH, Hahn LW, Ritchie MD, Thornton TA, White BC. Application of genetic algorithms to the discovery of complex genetic models for simulation studies in human genetics. In: Proceedings of the Genetic and Evolutionary Computation Conference. Langdon WB et al. (Ed.), Morgan Kaufmann Publishers, San Francisco, USA, 1150-1155 (2002).
40.
Moore JH, Parker JS, Hahn LW. Symbolic discriminant analysis for mining gene expression patterns. In: Lecture Notes in Artificial Intelligence (2167). De Raedt L, Flach P (Ed.), Springer-Verlag, Berlin, DE, 372-381 (2001).
41.
Moore JH, Parker JS. Evolutionary computation in microarray data analysis. In: Methods of Microarray Data Analysis. Lin S, Johnson K (Ed.), Kluwer Academic Publishers, Boston, USA, 23-35 (2002).
42.
Moore JH, Parker JS, Olsen NJ, Aune T. Symbolic discriminant analysis of microarray data in autoimmune disease. Genetic Epidemiology. 23, 57-69 (2002).
33
43.
Reif DM, White BC, Olsen NJ, Aune TA, Moore JH. Complex function sets improve symbolic discriminant analysis of microarray data. In: Lecture Notes in Computer Science (2724). Cantu-Paz E et al. (Ed.), SpringerVerlag, Berlin, DE, 2277-2287 (2003).
44.
Moore JH. Cross validation consistency for the assessment of genetic programming results in microarray studies. In: Lecture Notes in Computer Science (2611). Raidl, G et al. (Ed.), Springer-Verlag, Berlin, 99-106 (2003).
45.
O'Neill M, Ryan C. Grammatical evolution. Evolutionary Computation. 5, 349-358 (2001).
46.
Koza JR Genetic Programming: On the Programming of Computers by Means of Natural Selection. The MIT Press, Cambridge, USA (1992).
47.
Moore JH. The ubiquitous nature of epistasis in determining susceptibility to common human diseases. Hum Heredity. 56, 73-82 (2003).
48.
Bateson, W. Mendel's Principles of Heredity. Cambridge University Press, Cambridge, UK (1909).
49.
Moore JH, Ritchie MD. The Challenges of Whole-Genome Approaches to Common Diseases. Journal of the American Medical Association. 291(13), 1642-1643 (2004).
34
IEEE Transactions on
CHAPTER III
PROTEOMIC BIOMARKERS ASSOCIATED WITH ADVERSE EVENTS FOLLOWING SMALLPOX VACCINATION
The complication rate of smallpox vaccine is higher than any other vaccine currently in widespread use. The live vaccinia virus used is reactogenic in a significant number of vaccinées. While the most common adverse events (AEs) following inoculation are fever, lymphadenopathy, and rash, severe, lifethreatening AEs including encephalitis and myopericarditis have been observed. Given that an unacceptably high rate of adverse reactions occurred in limited, pre-screened healthy populations, the complications resulting from a populationwide vaccination program are potentially disruptive on a vast economic and social scale.
Studies are needed to elucidate the underlying immunological
mechanisms contributing to the development of AEs. It is hypothesized that many systemic AEs, such as fever, lymphadenopathy, and generalized rash, share common etiologies involving the inflammatory response. These systemic AEs likely have a proteomic signature in the serum that involves the action of cytokines and chemokines.
Therefore, to capture this signature, we used a
protein microarray technique to measure circulating (serum) levels of 108 cytokines and chemokines in vaccinées before and one week after primary immunization with Aventis-Pasteur smallpox vaccine (APSV).
Of the 74
individuals with measured proteomic data, 22 suffered a systemic adverse event
35
and 52 did not. We employed a committee of machine learning and statistical methods to identify proteomic biomarkers whose post-vaccination changes were associated with adverse events [1].
The committee identified a consensus
subset of cytokines, which were used to train a final decision-tree model. Our final model included six cytokines: G-CSF (CSF-3), SCF, MIG (CXCL9), ICAM-1 (CD54), eotaxin, and TIMP-2. Changes in dynamic levels of these cytokines after vaccination accurately discriminated between AE status classes. The final model points to a cytokine signature associating adverse events with prolonged or hyper-activated inflammatory pathways.
This proteomic signature also
indicates a significant impact of cytokine secretion by fibroblasts in the development of adverse events following vaccination.
36
Introduction
Smallpox is a potentially lethal disease caused by the variola virus. In addition to its high mortality rate, smallpox is highly contagious, and its successful control through vaccination is one of the greatest triumphs of human medicine. Vaccination against smallpox involves inoculation with live vaccinia virus (VV) in the skin. In most healthy adults, vaccination induces a protective response. The protective response induced by VV may even lessen the severity of illness if given within four days after variola virus infection. demonstrate
that
vaccinia-specific
T
lymphocytes
secrete
Studies
IFN-γ
after
immunization, and that these cells may be long-lived [2-4]. In a previous study, we investigated the effect of the Aventis Pasteur smallpox vaccine (APSV) on a limited panel of systemic cytokine concentrations in a cohort of previously vaccinia-naïve individuals [5].
Systemic cytokines representing lymphocyte
functional subsets of Th1 cells (IFN-γ, TNF-α, and IL-2) and Th2 cells (IL-4, IL-5, and IL-10) were measured using a sensitive flow cytometric bead array assay that allowed multiple cytokine analyses from a single sample [6]. In the systemic compartment, smallpox immunization induces an IFN-γ-dominant response one week after immunization, with concentrations returning to baseline during convalescence. However, systemic IFN-γ concentration was not discriminatory between AE status groups. To identify proteomic biomarkers responsible for systemic AEs following smallpox vaccination, we precisely quantitated 108 serum cytokines and
37
chemokines using rolling-circle amplification technology (RCAT) [7-13] just before (baseline), and one week after (acute phase), immunization with APSV. Of 74 individuals studied following primary vaccination, 22 suffered a systemic AE.
We employed an unweighted voting strategy among a committee of
machine learning methods and statistical procedures to limit the number of false discoveries while maintaining statistical power.
We used support vector
machines (SVMs), nearest shrunken centroids (NSCs), and a false discovery rate (FDR) corrected Wilcoxon rank-sum test to select the soluble factors most associated with AEs.
We then used a decision tree to model the functional
relationship between the selected cytokines and systemic AEs. In this analysis, we find systemic cytokine patterns characteristic of inflammation marked by the prominent induction of IL-17 and IFN-γ related cytokines, as well as patterns characteristic of tissue inflammation and moderate destruction.
Subjects, materials, and methods
Study subjects Healthy adult subjects 18-32 years of age were enrolled in a multi-center study of primary immunization against smallpox using the APSV in the National Institutes of Health Vaccine and Treatment Evaluation Units. At the Vanderbilt University Medical Center site, 148 volunteers were enrolled in this NIHsponsored APSV immunization trial (NIH-DMID Protocol 02-054).
Vaccines,
study subjects, and study design were previously described in detail [14]. All
38
subjects participating in the main smallpox immunization study at the Vanderbilt University Medical Center were invited to participate in the cytokine substudy. Serum samples for cytokine analysis were obtained following informed consent under approval from the Vanderbilt University Institutional Review Board from 107 of the 148 subjects vaccinated in this study at Vanderbilt. All 22 subjects suffering systemic AEs among the 107 who donated serum were included in this analysis, and 52 subjects who did not experience any AE were used as a control group.
Clinical assessments Trained physicians and nurse providers examined the subjects by history and physical examination for indications of vaccine take (presence of a vesicle or pustule at the inoculation site) and AEs at five post-immunization visits in the first month (on days 3-5, 6-8, 9-11, 12-15, and 26-30).
For the purposes of the
current study, we considered the occurrence of three systemic AEs: generalized rash, fever, and lymphadenopathy. Fever was defined as an oral temperature > 38.3 ºC.
A generalized rash was defined as skin eruptions in regions not
contiguous with the site of vaccination. The frequent acneiform rashes seen in this trial have been described elsewhere [15]. Lymphadenopathy was defined as tenderness or enlargement of regional lymph nodes associated with vaccination.
39
Sample collection Pre-vaccination serum samples (baseline) were collected during a screening visit immediately prior to vaccination, and post-vaccination samples were obtained 6-9 days after vaccination (acute phase). Serum samples were collected in 5 ml Vacutainer serum separator tubes (Becton Dickinson, San Jose, CA) and were centrifuged at 700 x g for 10 minutes.
The serum then was
collected, aliquoted into cryovials (Sarstedt Inc., Numbrecht, Germany) and stored at –80 ºC until assayed for cytokine concentrations. RCAT was used to measure 108 serum cytokines and chemokines for all 22 subjects who experienced a systemic AE and 52 subjects who did not experience an AE. Because we are studying cytokine expression in the serum compartment, we focus on systemic AEs, which we expected to be more strongly associated with serum cytokine expression than would a local AE.
Proteomic assay The expression levels of 108 protein analytes were measured in 100 μL serum aliquots from the patient samples using custom dual antibody sandwich immunoassay arrays, as described in [7-13]. The list of analytes is shown in Table 1. Briefly, monoclonal capture antibodies specific for each analyte were fixed to glass slides, with 12 replicate spots for each analyte. Duplicate samples of sera were incubated for 2 hours, and then washed.
Slides were then
incubated with secondary biotinylated polyclonal antibodies, and signals were amplified using a ‘rolling circle’ method [10]. Quality control measures included
40
optimization of antibody pairs, the use of internal controls to minimize array-toarray variation, and standardized procedures of chip manufacturing [10]. Arrays were scanned using a Tecan LS200 unit and mean fluorescence intensities (MFIs) were generated with customized software. To ensure a dynamic working range for each assay, 15 serial dilutions of recombinant analytes at known concentrations (studied in parallel on each slide) were used to develop best-fit equations for each analyte and the upper and lower limits of quantitation were defined. Because of the broad individual range of systemic cytokine expression before and after immunization, changes in serum cytokine concentrations during the early post-immunization phase were calculated as the percent of the corresponding individual’s baseline expression at the pre-vaccination visit.
Table 1. Gene names and symbols of 108 protein analytes measured in 100 μL serum aliquots from the patient samples using custom dual antibody sandwich immunoassay arrays. (Continued on following pages) Gene Symbol CSF3 (G-CSF) IL-10 IFNG ALCAM ANGPT4 BDNF CXCL13 (BLC) CCL28 (MEC) TNFSF7 (CD27) TNFSF8 (CD30) CCL27 (CTACK) TNFRSF21 (DR6) EGF CXCL5 (ENA78) CCL11 (Eot) CCL26 (Eot3) CCL24 (Eot2)
Gene Name Colony stimulating factor 3 (granulocyte) Interleukin 10 Interferon, gamma Activated leukocyte cell adhesion molecule Angiopoietin 4 Brain-derived neurotrophic factor Chemokine (C-X-C motif) ligand 13 (B-cell chemoattractant) Chemokine (C-C motif) ligand 28 Tumor necrosis factor (ligand) superfamily, member 7 Tumor necrosis factor (ligand) superfamily, member 8 Chemokine (C-C motif) ligand 27 Tumor necrosis factor receptor superfamily, member 21 Epidermal growth factor (beta-urogastrone) Chemokine (C-X-C motif) ligand 5 Chemokine (C-C motif) ligand 11 Chemokine (C-C motif) ligand 26 Chemokine (C-C motif) ligand 24
41
FGF4 FGF7 FGF9 FGF2 (FGFB) FGF1 FAS FASLG FLT3LG FST CX3CL1 CXCL6 (GCP2) GDNF CSF2 (GMCSF) CXCL3 (GRO3) CXCL2 (GRO2) CCL14 (HCC1) CCL16 (HCC4) HGF TNFRSF14 (HVEM) CCL1 (I309) CXCL11 (ITAC) ICAM1 ICAM3 IGF2 IGF1R IGFBP1 IGFBP3 IGFBP4 IGFBP2 IL10RB IL-13 IL-15 IL-17 IL-1A IL-1B IL1-RN IL1RL2 IL-2 IL2RB IL2RA IL-3 IL-4 IL-5 IL-6 IL-7 IL-8 IL2RG IL5RA IL-9
Fibroblast growth factor 4 (heparin secretory transforming protein 1) Fibroblast growth factor 7 (keratinocyte growth factor) Fibroblast growth factor 9 (glia-activating factor) Fibroblast growth factor 2 (basic) Fibroblast growth factor 1 (acidic) Fas (TNF receptor superfamily, member 6) Fas ligand (TNF superfamily, member 6) Fms-related tyrosine kinase 3 ligand Follistatin Chemokine (C-X3-C motif) ligand 1 (fractalkine, neurotactin) Chemokine (C-X-C motif) ligand 6 (granulocyte chemotactic protein 2) Glial cell derived neurotrophic factor Colony stimulating factor 2 (granulocyte-macrophage) Chemokine (C-X-C motif) ligand 3 Chemokine (C-X-C motif) ligand 2 Chemokine (C-C motif) ligand 14 Chemokine (C-C motif) ligand 16 Hepatocyte growth factor (hepapoietin A; scatter factor) Tumor necrosis factor receptor superfamily 14 (herpesvirus entry mediator) Chemokine (C-C motif) ligand 1 Chemokine (C-X-C motif) ligand 11 Intercellular adhesion molecule 1 (CD54), human rhinovirus receptor Intercellular adhesion molecule 3 Insulin-like growth factor 2 (somatomedin A) Insulin-like growth factor 1 receptor Insulin-like growth factor binding protein 1 Insulin-like growth factor binding protein 3 Insulin-like growth factor binding protein 4 Insulin-like growth factor binding protein 2, 36kDa Interleukin 10 receptor, beta Interleukin 13 Interleukin 15 Interleukin 17 (cytotoxic T-lymphocyte-associated serine esterase 8) Interleukin 1, alpha Interleukin 1, beta Interleukin 1 receptor antagonist Interleukin 1 receptor-like 2 Interleukin 2 Interleukin 2 receptor, beta Interleukin 2 receptor, alpha Interleukin 3 (colony-stimulating factor, multiple) Interleukin 4 Interleukin 5 (colony-stimulating factor, eosinophil) Interleukin 6 (interferon, beta 2) Interleukin 7 Interleukin 8 Interleukin 2 receptor, gamma (severe combined immunodeficiency) Interleukin 5 receptor, alpha Interleukin 9
42
SELL CSF1 CSF1R CCL2 (MCP1) CCL8 (MCP2) CCL7 (MCP3) CCL13 (MCP4) CXCL9 (MIG) CCL3 (MIP1A) CCL4 (MIP1B) CCL5 (MIP1D) CCL20 (MIP3A) CCL19 (MIP3B) MMP7 MMP9 CCL23 (MPIF1) NTF3 NTF5 OSM PARC PDGFRA PECAM1 PGF TNFRSF11A CCL5 (RANTES) KITLG (SCF) KIT (SCFR) CXCL12 (SDF1) IL1RL1 CCL17 (TARC) TGFA TIMP-2 TIMP1 TNFRSF1A TNF LTA TNFRSF10A TNFRSF10D VEGF KDR BTG2 NM
Selectin L (lymphocyte adhesion molecule 1) Colony stimulating factor 1 (macrophage) Colony stimulating factor 1 receptor Chemokine (C-C motif) ligand 2 Chemokine (C-C motif) ligand 8 Chemokine (C-C motif) ligand 7 Chemokine (C-C motif) ligand 13 Chemokine (C-X-C motif) ligand 9 (monokine induced by gamma interferon) Chemokine (C-C motif) ligand 3 Chemokine (C-C motif) ligand 4 Chemokine (C-C motif) ligand 5 Chemokine (C-C motif) ligand 20 Chemokine (C-C motif) ligand 19 Matrix metalloproteinase 7 (matrilysin, uterine) Matrix metalloproteinase 9 (gelatinase B, 92kDa gelatinase) Chemokine (C-C motif) ligand 23 Neurotrophin 3 Neurotrophin 5 (neurotrophin 4/5) Oncostatin M P53-associated parkin-like cytoplasmic protein Platelet-derived growth factor receptor, alpha polypeptide Platelet/endothelial cell adhesion molecule (CD31 antigen) Placental growth factor, vascular endothelial growth factor-related protein Tumor necrosis factor receptor superfamily, member 11a, activator of NFKB Chemokine (C-C motif) ligand 5 KIT ligand V-kit Hardy-Zuckerman 4 feline sarcoma viral oncogene homolog Chemokine (C-X-C motif) ligand 12 (stromal cell-derived factor 1) Interleukin 1 receptor-like 1 Chemokine (C-C motif) ligand 17 Transforming growth factor, alpha Tissue inhibitor of metalloproteinase 2 Tissue inhibitor of metalloproteinase 1 Tumor necrosis factor receptor superfamily, member 1A Tumor necrosis factor (TNF superfamily, member 2) Lymphotoxin alpha (TNF superfamily, member 1) Tumor necrosis factor receptor superfamily, member 10a Tumor necrosis factor receptor superfamily, member 10d Vascular endothelial growth factor Kinase insert domain receptor (a type III receptor tyrosine kinase) BTG family, member 2 Neutrophil migration
43
Statistical analysis methods Because the types of proteomic effects contributing to systemic AEs after vaccination have not been fully characterized, as well as the fact that changes in the cytokine concentrations measured followed non-standard distributions, we employed a committee of machine learning and statistical methods to identify AE-associated proteomic biomarkers. Since each method in the committee was chosen for its unique analytical perspective, agreement (consensus) between methods on the importance of particular variables indicates that the association of that variable with AEs is more than a single method-specific bias. Consensus cytokines were defined as those identified by at least two of the three committee methods. After using the committee to identify a consensus subset of cytokines whose post-vaccination changes were associated with adverse events, a final decision-tree model was built from these variables. Descriptions of each method in our committee are given below. Modern
high-throughput
experimental
techniques
simultaneous testing of multitudes of statistical hypotheses.
allow
for
the
The issue of
multiple-testing arises in such situations, with the probability of false-positive results in a raft of tests increasing with the total number of tests (N) performed. For a single statistical hypothesis test in the context of this study, the discrepancy in cytokine levels between the two AE groups is declared significant if the p-value is < α. Traditionally, α is set to 0.05, meaning that the probability of making a Type I (false-positive) error is approximately α. A naïve solution to the multipletesting problem is the Bonferroni correction, which chooses a significance level of
44
α* = α / N. This method takes the number of hypotheses tested into account, but the significance level required to declare a positive association becomes prohibitively stringent as N grows large. An alternative statistical procedure that controls the number of type I errors while providing reasonable power when performing multiple hypothesis tests is the false-discovery rate (FDR) method [16]. The FDR procedure returns a significance threshold linked to the distribution of p-values generated by a statistical test, controlling the average fraction of false discoveries made among the multiple hypothesis tests whose null hypotheses were rejected. The q-value measures the proportion of false-positive occurrences (i.e. the false-discovery rate) when a particular test is declared significant. We used the non-parametric Wilcoxon rank-sum test to compare means between systemic AE and non-AE groups. Using a false discovery rate q = 0.3, we found the significance threshold to be 0.02.
The unweighted voting procedure involving SVM and NSC
(described below) was used to further filter out spurious associations. Unless otherwise stated, methods were implemented in the MATLAB programming language Version 7.1 (release 13). The other two methods in our committee were NSC and SVM, both of which are supervised machine learning methods, meaning that the outcome classes are known to the method. In this study, we considered two classes of individuals:
those experiencing systemic adverse events (AE) versus those
without a reported adverse event (non-AE), although the particular AE subsets
45
could be treated as multiple classes in multi-class implementations of these algorithms. For binary classification tasks, a Support Vector Machine (SVM) finds a hyper-plane that maximally separates training data from the two classes. The optimal hyper-plane maximizes the separation (margin) between individuals from each class.
Individuals (each representing a vector of measured proteomic
variables) closest to the hyper-plane are referred to as support vectors. SVMs create non-linear separations by using a kernel technique to automatically realize a non-linear mapping to a feature space. The hyper-plane found by the SVM in feature space corresponds to a non-linear decision boundary in input space [17]. We implemented SVM using the GEMS (Gene Expression Model Selector Version 2.0.2) [18] analysis software.
Parameters included a radial basis
function kernel, Markov blanket feature selection [19], and ten-fold crossvalidation (CV). Prediction accuracy was calculated on each test set created during the ten stage CV procedure, achieving an average prediction accuracy of 69%. SVM found seven cytokines predictive of AE status, five of which passed our inclusion criterion of consensus with the other committee methods. Nearest Shrunken Centroids (NSC) [20] was the final statistical learning method used in our committee strategy to identify consensus proteomic biomarkers. NSC is appropriate for such a task because of its ability to perform automatic feature selection. For each cytokine i, the k components of the class centroids xik (the mean change of cytokine i for individuals in class k) are shrunk toward the overall centroid xi (the mean change of cytokine i across all
46
individuals). Here, k = 2, corresponding to the two AE classes. The centroids are shrunk by a t-statistic-like quantity d ik′ , which is a measure of the ability of cytokine i to distinguish the class-k centroid from the overall centroid. If d ik′ is zero, then the cytokine-i component of the class-k centroid is equal to the component of the overall centroid, and this cytokine does not contribute to classification for class-k. We used the same discriminant score as in Tibshirani et al. [20]. Ten-fold CV was used to tune the regularization term s0 as well as the shrinkage Δ . We found an average prediction accuracy of 70% with Δ = 2.1 and s0 = 0.002 . NSC required less computational time than SVMs. Four out of five cytokines selected by NSC overlapped with those selected by SVM. The final step of our analysis strategy was to create an interpretable model from the cytokines found by consensus among the three feature-selection methods (FDR-Wilcoxon, SVM, and NSC). Decision trees were chosen to build the final AE model because of their ready interpretability and explicit modeling of variable interactions.
We used the implementation of the C4.5 decision-tree
algorithm provided in the Weka machine learning software package [21] to obtain the model in Fig. 1 (see Results section). Individuals are classified into AE or non-AE groups by sorting down a dichotomous tree toward terminal leaves. Starting from the root, the tree splits at a cytokine according to how well the relative change of a given cytokine separates individuals into the appropriate classes. The relative change threshold is calculated by choosing among a set of possible values for each particular split.
Using information gain to rank
cytokines, we place cytokines at tree nodes with the greatest gain among 47
attributes not yet considered in the path from the root node. We used a 25% confidence value for pruning branches that do not improve training accuracy— finding the CV accuracy to be insensitive to changes in this value. We optimized the minimum number of instances that must be present from each AE class in the training data for a new leaf to be created to handle those instances. For these data, a minimum of 5 instances resulted in a more parsimonious tree that more readily generalizes to test sets.
Results
This study aimed to shed light on the proteomic mechanisms underlying the high rate of AEs reported in subjects receiving smallpox vaccine [15]. We measured serum concentrations of cytokines in vaccinia-naïve adults at two time points: pre-vaccination (baseline) and one week post-vaccination (acute phase). Since AEs of a systemic nature, such as fever, generalized rash, and lymphadenopathy are likely related to circulating immune mediators, this study sought to determine whether systemic alterations of serum cytokines are associated with these AEs. In our clinical study, systemic AEs were reported in 22 subjects. There were no subjects reporting serious AEs—defined by the need for clinic or emergency visits or for hospitalization related to vaccination. Subjects without a reported AE (n = 52) exhibited significantly different serum cytokine signatures than subjects with a reported systemic AE (n = 22).
48
The committee strategy identified six consensus cytokines that accurately discriminated the two AE status classes:
stem cell factor (SCF), monokine
induced
inhibitor
by
interferon-γ
(MIG),
tissue
of
metalloproteinases-2,
granulocyte colony stimulating factor (G-CSF or CSF-3), intercellular adhesion molecule-1 (ICAM-1 or CD54), and eotaxin. The feature selection results from the committee are summarized in Table 2, with cytokines ordered by Wilcoxon pvalues. The committee consensus strategy aims to reduce spurious associations due to method-specific biases. Our results indicate that such a strategy may be beneficial, even when using corrective procedures such as the FDR. While a qvalue of 0.3 can be interpreted to mean that up to 30% of the consensus cytokines are false discoveries, it does not mean that the false discoveries are the 30% with the highest p-values. The unweighted committee voting method eliminated two of the seven cytokines selected by the FDR-Wilcoxon procedure.
49
Table 2. Cytokines listed in the first column were found to discriminate between AE and non-AE individuals by at least one of the three statistical methods: false discovery rate (FDR) correction to the Wilcoxon rank-sum test, nearest shrunken centroids (NSC), and support vector machines (SVM). For each cytokine row listed, an X in an FDR, NSC, or SVM column indicates that this cytokine was selected by the corresponding method. Highlighted in bold are cytokines identified by consensus of at least two of the three statistical methods. These highlighted cytokines were used to train a final decision-tree model (see Figure 1). The cytokines are ordered by Wilcoxon rank-sum p-value, listed in the fifth column. The last two columns show the mean relative percent change from baseline for the AE and non-AE groups, respectively. Gene Symbol ICAM-1 G-CSF (CSF3) TIMP-2 IL-10 MIG (CXCL9) ALCAM SCF MPIF1 (CCL23) Eotaxin IL-4 IL-8 NTF3
FDR
NSC
X X X X X X X
X
SVM
X
X X
X
X
X X X
X X X
X X
Wilcoxon p-value
Change (AE)
Change (non-AE)
0.0013 0.0029 0.0054 0.0124 0.0128 0.0151 0.0166 0.0274 0.0463 0.0476 0.0577 0.0990
37.2% 994.5% 27.5% 378.0% 53.2% 21.2% 19.4% 75.8% 4.0% 21.8% 12.4% 17.8%
17.8% 48.3% 10.0% -2.9% 19.4% 10.1% -12.7% 36.2% -6.6% 7.8% -3.7% -1.3%
To obtain a descriptive, interpretive model of the functional relationship between the set of cytokines selected by our committee method and systemic AEs, the final decision-tree in Figure 1 was trained on the full data. This model correctly classifies 92% of individuals in the data.
Using ten-fold CV and
specifying a minimum of five individuals for creation of new branches, we estimated the prediction accuracy of the final decision-tree model to be 77%. The final model includes the cytokines ICAM-1, G-CSF, eotaxin, and TIMP-2.
50
Figure 1. Final pruned decision-tree model for predicting AE status from cytokine expression changes after vaccination. Cytokines identified by the unweighted voting filter (SCF, MIG, TIMP-2, G-CSF, ICAM-1, and eotaxin) were selected to train the decision-tree classifier. Input (ovals) for the if-then rules is the percentage change of the subject’s cytokine level during the acute phase relative to the baseline cytokine level. Based on the value of the input, the inequalities guide the decision of which branch to follow. Given an individual’s cytokine profile, one follows the decision branches from the root (ICAM-1) downward to one of the six terminal nodes (AE or non-AE boxes). When one of the following decision branches is reached, an individual is predicted to be classified as AE or non-AE depending on which inequality is satisfied: ICAM-1 ≤ 11% (non-AE), Eot ≤ -10% (non-AE), TIMP-2 ≤ 51% (AE), TIMP-2 > 51% (nonAE), TIMP-2 ≤ 37% (non-AE), TIMP-2 > 37% (AE). The misclassification rates are given in parentheses below each terminal node.
51
Discussion
Immune responses involve an intricate network of both local and systemic signaling proteins. These cytokine and chemokine signals direct both the action and localization of immunological effectors.
Dysfunction within any of these
communication networks—whether upregulation of activating signals or lack of proper inhibitory signals—can tip the balance of a normally appropriate response towards one in which the immune effectors actually contribute to illness. Adverse events in response to smallpox vaccination may represent such a situation. Since subjects in the present study were successfully vaccinated, it is thought that the development of AEs represents excessive and/or protracted activity of appropriate immune responses. Since comprehensive data concerning serum cytokine concentrations following smallpox vaccination have not been gathered previously, there is a major knowledge gap in our understanding of the systemic mechanisms contributing to AEs associated with vaccination. Filling this knowledge gap will provide important details regarding the pathophysiology of AEs and the successful control of poxvirus infections. The present study contributes to this learning process by identifying patterns of serum cytokine expression changes associated with systemic AEs after vaccination. Previous studies have shown that nearly all subjects with vesicle formation exhibit strong VV-specific cytotoxic T lymphocyte (CTL) responses and increased counts of IFN-γ-producing T cells following vaccination with APSV [4]. These
52
findings suggested that vigorous T-cell and humoral responses are induced if a vesicle forms, independent of vaccine dose. The clinically observable lesions at the inoculation site in subjects receiving APSV suggests the possibility that biologically significant cytokine production occurred locally in our subjects without presenting dramatic increases in the systemic compartment. Since our aim was to identify serum cytokine patterns predictive of systemic AEs, relevant local cytokine dynamics could have been missed.
However, serum cytokine
expression is more readily and reproducibly measured for rapid clinical diagnostic purposes. In the present study, we precisely measured systemic concentrations of 108 cytokines and chemokines in serum samples obtained prior to vaccination, and one week post-vaccination, using a sensitive protein microarray technique incorporating RCAT [7-13, 22].
To extract a useful subset of cytokines that
discriminates between subjects who suffered at least one systemic AE (fever, lymphadenopathy, or generalized rash) from those who did not experience an AE, we employed three different class comparison methods: FDR-Wilcoxon, SVM, and NSC.
A cytokine was selected for building the final decision-tree
model if it was identified by at least two of these three methods. Decision trees were used to derive a descriptive, interpretable model of the functional relationships between the six selected cytokines and AE status. It should be noted that these serum cytokine/chemokine expression levels were measured early in the period following vaccination, well before most AEs had occurred. Therefore, the model could be considered predictive of subsequent AEs.
53
Profiling at early time points following immunization may be useful in predicting AE risk and directing at-risk subjects to properly recognize vaccine-related symptoms. Considering the cytokines selected by our consensus strategy, three are in the pro-inflammatory interleukin-17 (IL-17) signaling pathway. In this pathway, fibroblasts, stimulated by IL-17, are induced to secrete inflammatory and hematopoietic cytokines, including G-CSF, SCF (both identified in our committee method), and IL-8 (also known as CXCL8; identified by the NSC method). These cytokines incite a range of activities that include neutrophil proliferation and differentiation. IL-17 has been shown to enhance cell surface expression of the endothelial cell adhesion molecule ICAM-1 on human fibroblasts [23]. In turn, increased expression of ICAM-1 was shown to aid in T-cell recruitment during contact hypersensitivity (related to delayed-type hypersensitivity) [24].
In the
present study, soluble ICAM-1 was a strong discriminator of smallpox vaccinerelated AE status. In fact, ICAM-1 was the root node of the decision-tree model in Figure 1, meaning that the effect of other cytokines in our model on AE status was conditionally dependent on changes in serum concentration of ICAM-1. While key cytokines in the IL-17 pathway play an important role in our analysis, changes in circulating levels of IL-17 itself were not found to be differentially expressed between AE status groups. Had different time points been chosen for cytokines measurement, IL-17 may have been selected as important. While the one-week post-immunization time point captures the peak concentration for most cytokines, it may not be representative of all AE-relevant cytokines.
54
Another cytokine selected was Eotaxin, which is a chemokine ligand for CCR3 (also known as CD193) that activates and recruits eosinophils to the site of inflammation and stimulates macrophage activation. Activated eosinophils can release reactive oxygen species that contribute to host tissue damage during chronic inflammatory responses. The committee also selected monokine induced by IFN-γ (MIG or CXCL9), a member of the C-X-C subfamily of chemokines and an attractor of activated T cells expressing chemokine receptor CXCR3 [25]. The IFN-γ-induced MIG is produced by macrophages and may play a crucial role in enhancing the recruitment and activation of T cells [26]. The dual function of TIMP-2 in the final model highlights an important property of decision trees in allowing a flexible modeling framework. TIMP-2 was found to be associated with AEs by all three statistical learning methods, and its placement in the decision tree (Fig. 1) points to a complex role in AE development. TIMP-2 appears in two branches of the decision tree, and its effect on the prediction of AE status depends on the context of other cytokines in the tree. Proteins in the TIMP family inhibit the matrix metalloproteinases (MMP), a group of peptidases involved in degradation of extracellular matrix (ECM). Normally, TIMP-2 accelerates wound healing by enhancing the proliferation of epidermal keratinocytes and dermal fibroblasts. Following the branches toward TIMP-2 on the right, when an individual’s increase in TIMP-2 expression is less than 51%, then that individual experiences an AE. This is presumably because the balance between the MMP and its inhibitor tips toward the MMP—promoting
55
excess ECM destruction and further inflammation. However, this situation only occurs when G-CSF expression is substantially increased, relative to baseline. When the increase in G-CSF is less than 97% and the expression of eotaxin does not decrease by more than 10%, then the role of TIMP-2 is qualitatively different. Hence, accurate predictions of AE status based on the expression of TIMP-2 must be taken in the context of other cytokines.
This finding
demonstrates a salient challenge in complex molecular investigations of clinical populations:
statistical interactions between variables must be taken into
account when testing association with a phenotype. Although it is possible that the right-hand branch of the decision tree is the result of over-fitting, this type of complex
TIMP-2
behavior
has
been
observed
previously—where
the
physiological concentration and proteomic context affects whether TIMP-2 has an inhibitory versus activating effect on MMPs [27]. Application of our consensus analysis strategy to protein microarray data indicates a cytokine signature for the pathogenesis of AEs involving stem cell factor
(SCF),
monokine
induced
by
IFN-γ
(MIG),
tissue
inhibitor
of
metalloproteinases 2 (TIMP-2), granulocyte colony stimulating factor (G-CSF or CSF-3), intracellular adhesion molecule 1 (ICAM-1), and eotaxin. This signature suggests that the development of AEs involves excess stimulation of inflammatory pathways and the imbalance of tissue damage repair pathways. Our model of adverse event development following smallpox vaccination involves interactions among soluble cytokines whose excess local secretion leads to remote diffusion and subsequent detection in circulation.
56
It is
hypothesized that the initial local tissue injury in subjects suffering AEs after vaccination triggers an acute inflammatory response not unlike a delayed-type hypersensitivity (DTH) reaction. During the elicitation phase of DTH, antigen presentation to Th1 cells in the dermis leads to the release of T-cell cytokines such as IFN-γ and IL-17 [28, 29]. A cascade of cytokines and chemokines is then released—enhancing the inflammatory response by inducing the migration of monocytes into the lesion and their maturation into macrophages. This signal cascade attracts additional T cells as well. The dominant cytokine responses in the systemic compartment were characteristic of robust macrophage recruitment and activation. Taken together, the prevalence of inflammatory cytokines in AE development, coupled with previous work demonstrating the importance of T-cell derived factors and the similarities of systemic AEs recorded after smallpox vaccination with the clinical presentation of macrophage activation syndrome (MAS) [30], suggests that systemic AEs following smallpox vaccination may be consistent with low-grade MAS caused by virus replication and hyperactive tissue injury and repair mechanisms.
57
Acknowledgments
We would like to thank Jennifer Hicks, Karen Adkins (Vanderbilt Pediatric Clinical Research Office) and the Vanderbilt General Clinical Research Center staff for nursing support, and Molecular Staging Inc. for providing RCAT data. This work was supported by the NIH/NIAID Vaccine Trials and Evaluation Unit contract number NO1-AI-25462, by NIH grants K25-AI-64625, AI-59694 and RR018787, and by infrastructure from the Vanderbilt NIH General Clinical Research Center (RR-00095).
Generous support was also provided by the Vanderbilt
Program in Biomathematics.
References
1.
McKinney BA, Reif DM, Rock MT, Edwards KM, Kingsmore SF, Moore JH, Crowe JE, Jr. Cytokine expression patterns associated with systemic adverse events following smallpox immunization. J Infect Dis 2006;194:444-53
2.
Ennis FA, Cruz J, Demkowicz WE, Jr., Rothman AL and McClain DJ. Primary induction of human CD8+ cytotoxic T lymphocytes and interferongamma-producing T cells after smallpox vaccination. J Infect Dis 2002;185:1657-9
3.
Demkowicz WE, Jr., Littaua RA, Wang J and Ennis FA. Human cytotoxic T-cell memory: long-lived responses to vaccinia virus. J Virol 1996;70:2627-31
4.
Rock MT, Yoder SM, Wright PF, Talbot TR, Edwards KM and Crowe JE, Jr. Differential regulation of granzyme and perforin in effector and memory T cells following smallpox immunization. J Immunol 2005;174:3757-64
5.
Rock MT, Yoder SM, Talbot TR, Edwards KM and Crowe JE, Jr. Adverse events after smallpox immunizations are associated with alterations in systemic cytokine levels. J Infect Dis 2004;189:1401-10 58
6.
Chen R, Lowe L, Wilson JD, et al. Simultaneous Quantification of Six Human Cytokines in a Single Sample Using Microparticle-based Flow Cytometric Technology. Clin Chem 1999;45:1693-1694
7.
Schweitzer B RS, Grimwade B, Shao W, Wang M, Fu Q, Shu Q, Laroche I, Zhou Z, Tchernev VT, Christiansen J, Velleca M, Kingsmore SF. Multiplexed protein profiling on microarrays by rolling-circle amplification. Nature Biotechnology 2002;20:359-365
8.
Mor G, Visintin I, Lai Y, et al. Serum protein markers for early detection of ovarian cancer. Proc Natl Acad Sci U S A 2005;102:7677-82
9.
Kader HA, Tchernev VT, Satyaraj E, et al. Protein microarray analysis of disease activity in pediatric inflammatory bowel disease demonstrates elevated serum PLGF, IL-7, TGF-beta1, and IL-12p40 levels in Crohn's disease and ulcerative colitis patients in remission versus active disease. Am J Gastroenterol 2005;100:414-23
10.
Perlee L, Christiansen J, Dondero R, et al. Development and standardization of multiplexed antibody microarrays for use in quantitative proteomics. Proteome Sci 2004;2:9
11.
Yang D, Chen Q, Rosenberg HF, et al. Human ribonuclease A superfamily members, eosinophil-derived neurotoxin and pancreatic ribonuclease, induce dendritic cell maturation and activation. J Immunol 2004;173:613442
12.
Kaukola T, Satyaraj E, Patel DD, et al. Cerebral palsy is characterized by protein mediators in cord serum. Ann Neurol 2004;55:186-94
13.
Schweitzer B, Wiltshire S, Lambert J, et al. Inaugural article: immunoassays with rolling circle DNA amplification: a versatile platform for ultrasensitive antigen detection. Proc Natl Acad Sci U S A 2000;97:101139
14.
Talbot TR, Stapleton JT, Brady RC, et al. Vaccination success rate and reaction profile with diluted and undiluted smallpox vaccine: a randomized controlled trial. Jama 2004;292:1205-12
15.
Talbot TR, Bredenberg HK, Smith M, LaFleur BJ, Boyd A and Edwards KM. Focal and generalized folliculitis following smallpox vaccination among vaccinia-naive recipients. Jama 2003;289:3290-4
16.
Benjamini YaH, Y. Controlling the false discovery rate: a practical and powerful approach to multiple testing. Journal of the Royal Statistical Society B 1995;57:289-300
17.
Vapnik V. Statistical Learning Theory. New York: Wiley, 1998 59
18.
Statnikov A, Aliferis CF and Tsamardinos I. Methods for multi-category cancer diagnosis from gene expression data: a comprehensive evaluation to inform decision support system development. Medinfo 2004;11:813-7
19.
Aliferis CF, Tsamardinos I and Statnikov A. HITON: a novel Markov Blanket algorithm for optimal variable selection. AMIA Annu Symp Proc 2003:21-5
20.
Tibshirani R, Hastie T, Narasimhan B and Chu G. Diagnosis of multiple cancer types by shrunken centroids of gene expression. Proc Natl Acad Sci U S A 2002;99:6567-72
21.
Witten IHaF, E. Decision Trees in Data Mining: Practical machine learning tools and techniques. San Francisco: Morgan Kaufmann, 2005
22.
Kingsmore SF, Patel DD. Multiplexed protein profiling on antibody-based microarrays by rolling circle amplification. Curr Opin Biotechnol 2003;14:74-81
23.
Z. Yao SLP, W.C. Fanslow, D. Ulrich, B.M. Macduff, M.K. Spriggs, R.J. Armitage. Human Il-17: A novel cytokine derived from T-cells. Journal of Immunology 1995;155:5483-
24.
McHale JF, Harari OA, Marshall D, Haskard DO. Vascular Endothelial Cell Expression of ICAM-1 and VCAM-1 at the Onset of Eliciting Contact Hypersensitivity in Mice: Evidence for a Dominant Role of TNF-alpha. Journal of Immunology 1999;162:1648 - 1655
25.
Weng Y SS, Waldburger KE, et al. Binding and functional properties of recombinant and endogenous CXCR3 chemokine receptors. Journal of Biological Chemistry 1998;273:18288-18291
26.
Loetscher M GB, Loetscher P, et al. Chemokine receptor specific for IP10 and mig: structure, function, and expression in activated T-lymphocytes. Journal of Experimental Medicine 1996;184:963-9
27.
Lu KV, Jong KA, Rajasekaran AK, Cloughesy TF and Mischel PS. Upregulation of tissue inhibitor of metalloproteinases (TIMP)-2 promotes matrix metalloproteinase (MMP)-2 activation and cell invasion in a human glioblastoma cell line. Lab Invest 2004;84:8-20
28.
Fong TA, Mosmann TR. The role of IFN-gamma in delayed-type hypersensitivity mediated by Th1 clones. J Immunol 1989;143:2887-93
60
29.
Susumu Nakae YK, Aya Nambu, Katsuko Sudo, Michiko Iwase, Ikuo Homma, Kenji Sekikawa, Masahide Asano, Yoichiro Iwakura. Antigespecific T cell sensitization is impaired in IL-17-deficient mice, causing suppression of allergic cellular and humoral responses. Immunity 2002;17:375-387
30.
Grom AA, Passo M. Macrophage activation syndrome in systemic juvenile rheumatoid arthritis. J Pediatr 1996;129:630-2
61
CHAPTER IV
GENETIC POLYMORPHISMS ASSOCIATED WITH ADVERSE EVEENTS FOLLOWING SMALLPOX VACCINATION
Immunization with vaccinia virus is highly effective against smallpox, but adverse reaction to vaccination is an unfortunately common occurrence. Population-wide vaccination programs could put many people at risk, given the high reactogenicity of certain vaccines.
Identifying stable genetic factors
associated with adverse events (AEs) may allow more effective pre-vaccine screening and even direct vaccine development. To investigate the relationship between adverse events following smallpox vaccination and genetic factors, a panel of candidate single-nucleotide polymorphisms (SNPs) was genotyped in two independent study samples.
Systemic adverse events, such as fever,
prolonged rash, and lymphadenopathy were recorded for all vaccinées. After identifying candidate genetic factors in the first study sample, the statistically significant findings were validated in the second, independent study.
We
identified multiple AE-associated SNPs in three candidate genes: Interleukin 4 (IL-4), Interferon Regulatory Factor 1 (IRF-1), and Methylenetetrahydrofolate reductase (MTHFR). The odds ratios associating each of these polymorphisms with AEs were consistent across both the original and validation studies. The demographics of both study samples were statistically similar, and the allele frequencies for each significantly associated SNP were comparable between
62
samples. Confidence in these results is augmented by the fact that they have been validated in an independent study sample. Since all of the patients under study were successfully vaccinated, the AE outcomes reported represent immune reactions either beyond the necessary magnitude or sustained longer than necessary. The candidate genes validated in both studies include a major anti-inflammatory cytokine (IL-4), an immunological transcription factor (IRF-1), and a metabolism gene previously associated with adverse reactions to a variety of pharmacologic agents (MTHFR).
Since the outcome of interest is the
aggregation of specific symptoms, it is logical that more than one gene may be involved. These genes are all involved in processes that are consistent with previously hypothesized mechanisms for the development of AEs involving prolonged stimulation of inflammatory pathways and imbalance of normal tissue damage repair pathways. While the immune modulatory roles of IL-4 and IRF-1 have been thoroughly studied in a variety of contexts, the association of polymorphisms in these genes with systemic AEs is exciting.
The non-
synonymous polymorphism in MTHFR is a novel result with promising clinical significance.
63
Introduction
Adverse reaction following vaccination with vaccinia virus, the live attenuated vaccine for smallpox, is a common occurrence that can have significant health effects.
Amid recent geopolitical concerns, there has been
renewed interest in protection against infectious agents such as smallpox, which is considered a potential agent of bioterrorism.
Population-wide vaccination
programs may put many people at risk, given the high reactogenicity of conventional smallpox vaccines [1].
Given that the biological mechanisms
underlying such adverse events (AEs) are not well-understood, there is a need to elucidate the molecular and cellular pathways and highlight pharmacological targets for intervention. Vaccination of healthy adults with vaccinia virus induces a protective response in the majority of individuals who are immunized—indicated by a significant rise in vaccinia virus–neutralizing antibodies in the serum and clinically observable features such as the development and expansion of a papule at the site of vaccination. The papule generally develops into an inflammatory vesicular lesion termed a “pock”, and resolves into a scar, which is a marker of “vaccine take” that correlates with protection. Since all of the patients under study were successfully vaccinated, the AE outcomes reported represent immune reactions either beyond the necessary magnitude or sustained longer than necessary. Poxviruses have evolved multiple mechanisms to evade host immune responses, such as targeting of primary innate immunity mediators (including interferons,
64
interleukins, chemokines, and others) and manipulating intracellular signal transduction pathways [2].
These mechanisms also may contribute to AE
development by creating a state of altered innate or adaptive immune stimulation. Previously, we have investigated smallpox vaccine with respect to its effects on the humoral and cellular immune response, reactogenicity, and patterns of systemic cytokine expression [3-8].
In the current report, we utilize
data collected for two independent studies to identify stable genetic factors associated with adverse events (AEs) in hopes that this may contribute to more effective screening and help direct vaccine development.
To investigate the
relationship between adverse events following smallpox vaccination and genetics, a panel of candidate single-nucleotide polymorphisms (SNPs) was genotyped in two independent clinical studies of the same vaccine, in which a significant proportion of vaccinees suffered systemic AEs—including fever, lymphadenopathy, and prolonged acneiform rash. For both studies, the data are genotypes at 1536 SNPs across roughly 500 candidate genes.
The second
study was used to validate the most promising results from the initial study. Most genetic association studies fail to replicate [9,10], thus, independent validation can be seen as the “gold standard” for genetic association studies. Results that successfully replicate are excellent candidates for in-depth follow-up via functional studies and deep resequencing in candidate genomic regions.
65
Subjects, materials, and methods
Study subjects Vaccines, study subjects, and study design for the original study have been described in detail [4]. Briefly, the original study enrolled 148 (116 with recorded AE information) healthy adults at the Vanderbilt University Medical Center as part of a multi-center study of primary immunization against smallpox using the Aventis-Pasteur Smallpox Vaccine (APSV) at the Vanderbilt National Institutes of Health (NIH) Vaccine and Treatment Evaluation Units [7]. NIH-DMID Protocol 02-054 was implemented. The study subjects for the validation sample also were collected at Vanderbilt University Medical Center, as a part of NIH-DMID Protocol 03-044, also using the APSV at the Vanderbilt NIH Vaccine and Treatment Evaluation Units [7]. A total of 102 healthy adults (all with recorded AE information) were enrolled as part of the validation study. In both studies, individuals were asked to self-identify race, with White (96%), Black (2%), and Asian (2%) as the most common categories reported. Both studies complied with the internal review board policies of Vanderbilt University and the NIH, and written consent was obtained for all individuals participating.
66
Clinical assessments For both studies, the same team of trained physicians and nurse providers examined the medical history and clinical symptoms of the subjects to insure consistent clinical assessment across studies. Subjects were examined on 5 visits within the first month post-vaccination and were assessed for occurrence of an adverse event. For all subjects, the first visit occurred during days 3-5 postvaccination, the second during days 6-8, the third during days 9-11, the fourth during days 12-15, and the final during days 26-30. Systemic adverse events were considered for both studies, including fever, generalized rash, and lymphadenopathy. More specifically, fever was defined as an oral temperature of greater than 38.3° C. Generalized rash was defined as skin eruptions on noncontiguous areas in reference to the site of vaccination. Detailed descriptions of the acneiform rashes considered in this study can be found in Talbot et al. [11]. Finally, lymphadenopathy was defined as enlargement or tenderness of regional lymph nodes due to vaccination.
Identification of genetic polymorphisms The custom SNP panel used in this study targets investigation of soluble factor mediators and signaling pathways, many of which have known immunological significance.
Genotyping for single nucleotide polymorphisms
(SNPs) was performed using DNA amplified directly from EBV-transformed B cells generated from peripheral blood samples collected from each subject. Genotyping was performed at the Core Genotyping Facility of the National
67
Cancer
Institute
(NCI)
(http://cgf.nci.nih.gov/home.cfm).
in Genotypes
Gaithersburg, were
Maryland
generated
using
the
IlluminaTM GoldenGate assay technology. Of the 1536 SNPs assayed, a total of 1442 genotypes passed quality control filters (genotyping efficiency > 80%) for both the original and validation samples. The list of all 1442 SNPs is given in Table 1.
Table 1. List of all 1442 SNPs analyzed, organized according to location. SNP names are taken from http://snp500cancer.nci.nih.gov.
SNP Name
dbSNP ID (rs#)
SNP Region
SNP Location (Base Pair)
RXRA-03 RXRA-01 APOB-01 CCR2-01 CCR2-02 CCR2-06 CCR5-02 CCR5-04 CCR5-07 APOB-21 APOB-08 APOB-04 APOB-07 ZFPM1-07 CCND1-02 CCND1-03 CCND1-01 OPRD1-03 IL15RA-02 IL15RA-05 IL15RA-04 IL15RA-06 OPRD1-05 IL10-06 IL10-05 IL10-13 IL10-07 IL10-01 IL10-03 IL10-17
rs1805352 rs1536475 rs1042034 rs1799864 rs1799865 rs3138042 rs2734648 rs1799987 rs1800024 rs3791981 rs1469513 rs1367117 rs1800481 rs904797 rs603965 rs7177 rs678653 rs760589 rs2296135 rs2296141 rs2228059 rs3136614 rs204076 rs3024496 rs3024509 rs3021094 rs3024491 rs1800871 rs1800896 rs1800890
IVS1-46A>C IVS6+70A>G Ex29+926G>A Ex2+241G>A Ex2+831C>T IVS2+118A>G IVS1+151G>T IVS1+246A>G IVS2+80C>T IVS18+336T>C IVS6+410G>A Ex4+56C>T -392C>T IVS1+9545A>G Ex4-1G>A Ex5+230C>A Ex5+852C>G IVS1-23001G>A Ex8-361A>C IVS6-242A>G Ex5-39A>C IVS4+32C>T 594bp 3' of STP T>A Ex5+210C>T IVS3-58C>T IVS1-192A>C IVS1-286G>T -7334T>C -1116A>G -3584T>A
15414 36621 41215 46295 46885 48119 58934 59029 59653 61301 75496 79834 83144 90248 323109 326314 326936 355421 357590 361555 365264 368570 383346 404971 406404 408059 408153 409741 410004 412472
68
TFRC-01 AHRR-10 AHRR-02 SFTPD-03 SFTPD-01 BCL2L1-03 CYBB-12 CYBB-09 CYP2E1-31 BCL2L1-02 BCL2L1-01 CYP2E1-02 CYBB-11 CYBB-27 CYBB-28 RAD54L-04 DRD4-15 DRD4-07 UGT1A1-24 OCA2-23 OCA2-07 OCA2-03 TYMS-10 TYMS-01 TYMS-05 TFF3-02 IGF1R-05 IGF1R-18 TFF1-01 IGF1R-06 NOS2A-07 NOS2A-02 APEX1-09 RAD52-01 RAD52-07 IGF1R-26 IGF1R-27 IGF1R-01 IGF2-09 IGF2-02 IGF2-22 IGF2-16 IGF2-03 IGF2AS-04 IGF1R-12 IGF2AS-01 IGF2AS-03 ABCA7-05 ABCA7-06 RET-01
rs3817672 E1518_63 rs10078 rs2243639 rs721917 rs1994251 rs6610650 rs4422908 rs8192766 rs1484994 rs3181073 rs2070676 rs5964125 rs5964149 rs5964151 rs1048771 rs4987059 rs916457 rs1042640 rs1900758 rs1800407 rs1800404 rs1059394 rs699517 rs2790 rs2236705 rs2137680 rs2175795 rs2839488 rs907806 rs9282801 rs2297518 rs3136814 rs11226 rs6413436 rs3743259 rs3743260 rs2229765 rs2230949 rs734351 rs3213223 rs3213221 rs3213216 rs3741212 rs9282715 rs1003483 rs3741211 rs3764651 rs3752241 rs1800858
Ex4-11G>A 2912bp 3' of STP G>C 3152bp 3' of STP T>G Ex5-13A>G Ex2+95T>C IVS2+22130A>C -2820A>G IVS2+90A>C -1514G>T IVS2+3483C>T IVS2+2259G>T IVS7-118G>C IVS7+118A>G IVS12-350A>G Ex13+686G>T Ex18+157C>T -870A>G -290C>T Ex5-402G>C IVS13+113A>G Ex13+17G>A Ex10+21G>A IVS7-68T>C Ex8+157C>T Ex7+227A>G IVS2-449T>G IVS2+61405G>A IVS2+61518G>A IVS1+334G>C IVS2-89673G>A IVS16+88T>G Ex16+14C>T Ex1+8A>C Ex11-571C>T IVS10-61C>T IVS5+311A>G IVS5+442A>G Ex16-58G>A Ex4-233C>T IVS2+384C>T IVS1-171C>T IVS1-285C>G IVS1+1280A>G Ex1+112A>G 3164bp 3' of STP C>T Ex2+69T>G Ex3+563A>G IVS20+166A>G Ex23-7C>G Ex2+62A>G
69
420545 427862 428102 450238 454840 483420 486282 491298 494964 502067 503291 506716 508223 519466 520501 563292 576433 577014 614298 633086 633307 638762 662792 663016 663086 727269 762592 762705 780627 794732 833467 833591 843425 876074 876940 893012 893143 928076 941429 943454 944171 944285 945420 949099 953687 954784 956351 991751 993524 999281
RET-02 ABCA6-05 ABCA6-01 GPX4-09 GPX4-06 GPX4-08 GPX4-12 SRA1-04 SRA1-03 SRA1-05 GC-02 STK11-03 ABCA5-01 CD14-03 CD81-04 CD81-06 PIN1-01 PIN1-16 PIN1-21 PIN1-02 PIN1-17 SLC6A18-13 WRN-01 TERT-03 WRN-07 TERT-02 TERT-15 TYR-02 TERT-14 TYR-08 TERT-08 ARNT-07 WRN-08 ARNT-01 ARNT-01 ARNT-10 ARNT-06 ARNT-06 ARNT-05 ARNT-05 TERT-54 TERT-21 WRN-03 ARNT-23 WRN-04 FANCA-03 FANCA-37 FANCA-28 FANCA-25 FANCA-34
rs1800860 rs9282553 rs9282552 rs757228 rs3746165 rs4807542 rs8178977 rs801460 rs801459 rs10463297 rs7041 rs741764 rs15886 rs2569190 rs708155 rs810225 rs2233678 rs2233679 rs889162 rs1985604 rs2010457 E3563_106 rs2230009 rs2853690 rs2725349 rs2075786 rs13167280 rs1393350 rs2853677 rs1800422 rs2735940 rs1889740 rs1800392 rs2228099 rs2228099 rs1027699 rs2256355 rs2256355 rs2864873 rs2864873 rs3816659 rs1801075 rs1801195 rs7517566 rs1346044 rs1061646 rs7195906 rs17227099 rs12931267 rs2159116
Ex7+33A>G Ex16-39G>C IVS13-16G>A -2050A>G -1831G>A Ex1-49G>A IVS6+19C>G NC_A>G NC_A>C NC_G>A Ex11+34T>G IVS6+145T>C Ex39+497T>A -1994T>C -1784A>G IVS1+5757A>C IVS1-834C>G IVS1-659C>T IVS3+2592T>C IVS3+3419G>A IVS3+62A>G IVS8+267C>T Ex4-16G>A Ex16+203C>T Ex6+9C>T IVS10+269T>C IVS3-24T>C IVS3-6895A>G IVS2-4455C>T Ex4+21G>A Ex2T>C IVS12-662A>G Ex20-88G>T Ex7+81G>C Ex7+81G>C IVS6+205G>A IVS6+123G>A IVS6+123G>A IVS5+726T>C IVS5+726T>C -22715C>T -22844G>A Ex26-12G>T -991T>C Ex34-93T>C IVS39-16C>T IVS39+55T>A IVS32-42A>G IVS30-102G>C IVS27-36G>T
70
1010000 1034634 1036166 1041992 1042211 1044078 1046477 1094857 1096550 1099166 1125344 1161484 1169561 1175843 1184236 1191843 1207981 1208156 1214718 1215545 1221680 1233245 1242709 1243744 1245331 1256310 1270477 1272668 1277194 1279583 1286486 1290110 1294731 1299244 1299244 1302067 1302149 1302149 1304529 1304529 1307820 1307949 1320054 1340390 1345428 1366594 1366964 1375834 1379349 1392127
FANCA-39 FANCA-22 SLC6A3-10 FANCA-35 FANCA-16 FANCA-02 FANCA-12 SLC6A3-14 TNFRSF10A-02 TNFRSF10A-06 SLC6A3-05 SLC6A3-03 SEPT2-01 CBS-03 ERCC6-04 CBS-07 CBS-01 ERCC6-12 VIL2-03 VIL2-02 FOXC1-23 FOXC1-22 FOXC1-02 FOXC1-13 FOXC1-06 FOXC1-07 ERBB2-03 ICAM1-19 ICAM1-15 ICAM1-06 ICAM1-16 CDKN1C-09 NUBP2-01 IGFALS-84 IGFALS-91 MTR-01 MTR-01 MTR-06 MTR-05 TEP1-03 TEP1-02 TEP1-10 TEP1-11 TEP1-01 TEP1-08 TNKS-01 TNKS-03 TNKS-05 TNKS-46 CSF3-06
rs7203907 rs886951 rs6347 rs3785275 rs2016571 rs2239359 rs2239360 rs460700 rs2235126 rs4871857 rs2652511 rs6413429 rs7568 rs12613 rs2228529 rs6586282 rs234706 rs2228527 rs3123109 rs901369 rs6928414 rs2235716 rs2235718 rs9405496 rs984253 rs2745599 rs1810132 rs5030390 rs281432 rs5498 rs3093032 rs431222 rs344357 rs1065663 rs344360 rs1805087 rs1805087 rs2275566 rs2275565 rs1713449 rs1760904 rs872072 rs872074 rs1760898 rs1760897 E5132_301 E5132_489 E5133_300 E5133_164 rs2227338
IVS26-129G>C IVS24+107C>T Ex9-55A>G IVS21+121C>G IVS20+933C>G Ex16+31C>T IVS15-73G>A IVS4+2610A>G IVS7+218G>A Ex4-4G>C -3076C>T -3714G>T Ex13+362A>G Ex18-391A>G Ex21+176A>G IVS15-134G>A Ex9+33C>T Ex18-142A>G IVS6+2368G>A IVS2-977T>C -3906C>T -3564C>T -3077C>T -2049A>C 1186bp 3' of STP A>T 1343bp 3' of STP A>G IVS4-61C>T IVS1+635G>A IVS2-3499C>G Ex6-22A>G Ex7+546C>T -1679G>A IVS1-283C>G Ex7-164A>G 505bp 3' of STP C>T Ex26-20A>G Ex26-20A>G IVS26+43G>A IVS26+157T>G Ex45+36G>A Ex24+49T>C IVS13+84C>T Ex13+51G>A Ex4+51C>A Ex1-222T>C Ex1-74G>A IVS1+115C>T IVS1+381C>T IVS1+517C>G IVS3+58A>G
71
1394391 1397482 1401412 1402646 1404893 1410097 1410200 1419969 1431494 1433637 1436389 1437027 1466347 1468132 1471569 1472938 1479791 1482833 1489523 1496551 1546773 1547115 1547602 1548630 1553528 1553685 1590301 1645339 1653460 1658485 1659138 1695640 1776256 1779024 1779222 1806289 1806289 1806351 1806465 1841547 1851869 1858853 1859045 1872721 1876093 1889400 1889588 1889854 1889990 1897238
CSF3-02 APEX1-16 APEX1-03 TNKS-33 TNKS-34 TNKS-64 TNKS-35 TNKS-36 TNKS-76 TNKS-11 TNKS-12 TNKS-13 BPI-01 TNKS-38 TNKS-15 TNKS-18 TNKS-20 TNKS-22 TNKS-23 TNKS-26 EPHX1-15 EPHX1-14 EPHX1-18 EPHX1-17 COL18A1-02 EPHX1-06 EPHX1-10 EPHX1-01 EPHX1-12 CASP9-27 COL18A1-03 CASP9-01 CASP9-03 IL1A-01 IL1A-04 COL18A1-01 SLC19A1-05 SLC19A1-01 IL1B-08 IL1B-02 IL1B-12 IL1B-03 SOD2-01 SOD2-06 FLJ45983-03 FLJ45983-16 GATA3-46 GATA3-10 GATA3-76 SLC39A2-10
rs1042658 rs1760944 rs3136820 rs7462102 rs7464476 E5135_413 E5153_301 E5154_301 rs13276464 E5137_301 E5138_301 rs6985140 rs1131847 rs11249938 rs7006985 rs12542457 rs7462910 rs7001395 rs9644708 E5147_301 rs2854461 rs2671272 rs3738043 rs2854456 rs2236451 rs1051740 rs2260863 rs2234922 rs1051741 rs2020898 rs2236467 rs1052576 rs2020902 rs17561 rs2071374 rs7499 rs1051298 rs1051266 rs1071676 rs1143634 rs3136558 rs1143627 rs1799725 rs5746081 rs1149901 rs1269486 rs10905277 rs2229359 rs3781093 rs945352
Ex4-165C>T -655T>G Ex5+5T>G IVS2-11724C>T IVS2-11659A>C IVS3+238C>T IVS3+11245A>T IVS3+21545G>T IVS3-25352G>T IVS3-25329G>T IVS3-23879C>T IVS3-34A>G Ex15+70A>G IVS5+6476A>G Ex8-71A>G IVS8+93C>T IVS12+1931C>T IVS14-34A>T IVS17-4617T>C IVS23-32A>C -4786A>C IVS1-1310G>A IVS1-1127A>G IVS1-1067C>T Ex3-8A>G Ex3-28T>C IVS3+114C>G Ex4+52A>G Ex8+31C>T IVS7-122C>T Ex13-25C>T Ex5+32A>G IVS3+8T>C Ex5+21G>T IVS4-109A>C Ex43+227A>G Ex8-198C>T Ex4-114T>C Ex7-97C>G Ex5+14C>T IVS3-123C>T -580C>T Ex2+24T>C -1254C>T Ex1-425G>A -2994T>C -250A>G Ex2-158C>T IVS2+1123T>C -824T>C
72
1898198 1922989 1924994 1936719 1936784 1948776 1959783 1970083 1987460 1987483 1988933 2012778 2018532 2020137 2039788 2039951 2055337 2066106 2076268 2098521 2187838 2191310 2191493 2191553 2193419 2195827 2195968 2202600 2208423 2213456 2217746 2225381 2227198 2244966 2245095 2249664 2252162 2275130 2295176 2298133 2299018 2302130 2401213 2402795 2457683 2459095 2460264 2463543 2464823 2466621
SLC39A2-07 SLC39A2-05 GATA3-21 GATA3-68 GATA3-23 GATA3-25 GATA3-27 GATA3-28 GATA3-29 LDLR-01 LDLR-12 LDLR-18 MGMT-12 LDLR-08 LDLR-03 IL1RN-05 IL1RN-02 IL1RN-04 SCARB1-09 SCARB1-08 PARP1-14 PARP1-13 SCARB1-03 PARP1-01 SCARB1-01 MGMT-06 IGF2R-05 PARP1-12 SCARB1-02 PARP1-10 IGF2R-02 IGF2R-11 PARP1-06 ALDH2-08 IGF2R-04 IGF2R-07 MGMT-19 MGMT-03 IGF2R-03 KRT23-03 LITAF-01 LITAF-02 BCR-01 BCR-02 TXNRD2-76 MBL2-30 MBL2-27 MBL2-09 TXNRD2-83 MBL2-06
rs2149666 rs2234636 rs570730 rs10752126 rs569421 rs520236 rs422628 rs406103 rs528778 rs1003723 rs5930 rs5925 rs16906252 rs2116898 rs14158 rs419598 rs454078 rs380092 rs989892 rs865716 rs747659 rs747657 rs4765621 rs1136410 rs3924313 rs12917 rs1570070 rs1805415 rs4765181 rs1805414 rs998075 rs998074 rs1805407 rs2238151 rs629849 rs2282140 rs2296675 rs2308327 rs1803989 rs2269858 rs7102 rs4280262 rs12233352 rs140504 rs6518591 rs2099902 rs10082466 rs930508 rs9306230 rs1838066
IVS2-119G>T Ex4+46T>C IVS3+358T>C IVS3+646C>G IVS3+2491C>T IVS3-2162C>G IVS3-27C>T IVS4+60C>T IVS4+582C>T IVS9-30C>T Ex10+55A>G Ex13-29T>C N/A IVS17-147G>A Ex18+88A>G Ex5-35T>C IVS6+59A>T IVS6+166A>T IVS7-2428G>T IVS7+1451A>T IVS21+59G>A IVS20-63G>C IVS1-18462G>A Ex17+8T>C IVS1+19766T>C Ex2-25C>T Ex9+5A>G Ex8+45A>G IVS1+8913T>G Ex7+18T>C Ex16+88A>G IVS16+15T>C IVS2+82A>G IVS1+6933C>T Ex34-93A>G IVS34+20C>T IVS3-54A>G Ex4+119A>G Ex45+11C>T Ex2+338C>T 1050bp 3' of STP T>C Ex3+54A>G IVS8-20A>G Ex11-20A>G IVS2+1485T>C Ex4-710G>A Ex4-1483T>C IVS3-28G>C IVS1+1202T>C IVS2-250T>C
73
2467996 2468991 2469355 2469643 2471488 2472170 2474305 2474517 2475039 2486983 2487067 2493683 2499476 2504612 2504846 2594950 2596536 2596643 2697149 2700789 2726935 2727118 2730648 2731496 2738308 2740214 2741319 2747034 2749161 2749558 2755619 2755724 2766027 2781342 2781750 2781862 2798929 2799101 2804822 2817164 2955321 2960571 3006370 3017938 3076171 3077004 3077777 3079453 3080172 3080480
MBL2-46 TXNRD2-88 MBL2-03 MBL2-12 MBL2-44 MBL2-11 MBL2-38 MBL2-65 COMT-29 COMT-16 COMT-03 COMT-01 IL8-01 IL8-11 IL8-05 TP53I3-03 TP53I3-12 ARVCF-05 TP53I3-18 TP53I3-10 TP53I3-13 PLA2G2A-03 EDN1-01 EDN1-02 NINJ1-03 NINJ1-01 ALOX5-02 ALOX5-06 ALOX5-10 ALOX5-12 ALOX5-15 ALOX5-28 ALOX5-26 IL12B-04 IL12B-11 CDC25B-06 MSR1-02 MSR1-01 UCP3-01 UCP3-02 ALOX15-02 ALOX15-12 NBN-04 CTSB-03 NBN-13 NBN-01 NBN-02 CARD15-04 CARD15-19 CARD15-05
rs10824793 rs4646310 rs5030737 rs7096206 rs11003124 rs11003125 rs1031101 rs12264958 rs7290221 rs4646312 rs6269 rs4680 rs4073 rs2227549 rs2227306 rs2303287 rs4149372 rs2240716 rs4149371 rs10170774 rs7603220 rs2236771 rs5369 rs5370 rs1127857 rs1127851 rs4986832 rs4987105 rs2029253 rs1369214 rs892691 rs1565097 rs2242332 rs3212227 rs730690 rs910656 rs971594 rs414580 rs2075577 rs1800849 rs2664593 rs7220870 rs1063053 rs1065712 rs867185 rs1805794 rs1063045 rs2066850 rs2067085 rs2066843
IVS2-405T>C IVS1+418T>C Ex1-34C>T -289G>C -495C>A -618G>C -1964T>C -2200T>C IVS1-6042C>G IVS1-385C>T IVS2-98A>G Ex4-12G>A -351A>T IVS1+298A>G IVS1-204C>T IVS4+68G>A IVS2+243A>C IVS3-82A>G -578A>G -931G>A -2503T>C Ex4+56G>C Ex3-72A>G Ex5+61G>T Ex4-86C>G Ex4-179A>T -1699A>G Ex1+63C>T IVS3+100A>G IVS3-6910A>G IVS4-2397A>G IVS7+44C>T IVS9-247C>T Ex8+159A>C IVS1+1274G>A 1887bp 3' of STP G>A IVS7+563G>C IVS2+93A>T Ex5-14C>T -2077C>T -11273G>C -271T>G Ex16+304C>T Ex12-296C>G IVS8+1488T>C Ex5-32C>G Ex2+65G>A -925A>C>G>T Ex2-7C>G Ex4+731C>T
74
3080635 3080956 3082397 3082840 3083046 3083169 3084515 3084751 3094830 3100487 3102102 3103421 3113034 3113747 3114065 3118179 3121445 3121846 3123708 3124061 3125633 3129304 3152516 3154513 3205070 3205163 3271341 3273061 3294797 3304042 3320405 3327569 3341552 3552508 3565724 3727496 3852196 3880321 3938291 3942914 4148505 4148591 4165710 4177472 4193323 4208652 4213192 4344428 4348058 4359398
CARD15-09 CARD15-10 HSD17B1-06 HSD17B1-10 COASY-01 PGR-18 PGR-23 PGR-01 PGR-12 PGR-07 PGR-11 PGR-26 PGR-14 PGR-17 PGR-16 PGR-05 PGR-28 PGR-15 PGR-21 PGR-27 PGR-20 PGR-24 SLC23A2-02 SLC23A2-01 SLC23A2-05 SLC23A2-03 SLC23A2-25 SLC23A2-33 IL6R-04 SLC23A2-48 SLC23A2-31 BRCA1-21 BRCA1-32 BRCA1-05 BRCA1-20 BRCA1-01 BRCA1-06 BRCA1-18 BRCA1-26 PCNA-10 PCNA-07 PCNA-06 AKR1C3-31 LRP6-03 AKR1C3-29 AKR1C3-33 AKR1C3-30 AKR1C3-28 AKR1C3-17 AKR1C3-19
rs748855 rs1077861 rs597255 rs676387 rs598126 rs1870019 rs561650 rs1042839 rs492457 rs9282823 rs1042838 rs660541 rs516693 rs572483 rs543215 rs613120 rs565186 rs529359 rs481775 rs10895068 rs474320 rs568157 E1028_301 rs1110277 rs4987219 rs1776964 rs1715364 rs4813725 rs8192284 rs6084957 rs12479919 rs1799966 rs8176212 rs1060915 rs4986852 rs16940 rs1799949 rs1799950 rs799923 rs17352 rs17349 rs25406 rs10795241 rs2075241 rs28943575 rs6601899 rs17134288 rs28942669 rs11252937 rs1937845
IVS6+513A>G IVS10+64T>A IVS1-42C>T IVS4-150C>A Ex3+57A>G 8373bp 3' of STP C>T IVS6-3061G>A Ex5-48C>T IVS4-4561T>C IVS4+566G>A Ex4+72G>T IVS3-884T>C IVS2-1136A>G IVS2-4965A>G IVS2-11426G>A IVS2-11671T>C IVS2+13109G>A IVS2+2892A>G IVS2+2063T>C Ex1+1042A>G -14747A>T -24480T>C Ex17-1890G>A Ex11+57T>C IVS8+453C>G Ex6+51C>T IVS3-5272G>A IVS2-4623G>A Ex9+7A>C IVS1+1547G>A IVS1+1312G>A Ex17-150A>G IVS15-63C>G Ex14-50T>C Ex12-978G>A Ex12+1641T>C Ex12+1412C>T Ex12+397A>G IVS8-34C>T IVS5+140A>C IVS2-4C>T IVS2-124C>T -32346T>C IVS15-11G>C -23066G>C -18314A>C Ex2C>T -1632C>T -1423T>C -488A>G
75
4365597 4373746 4429396 4430569 4440816 4463889 4478310 4484618 4489276 4495028 4495828 4496783 4526159 4529988 4536449 4536694 4546045 4556262 4557091 4562630 4576965 4586698 4774894 4794682 4804946 4820308 4838896 4857985 4917325 4920505 4920740 4947390 4950897 4958766 4968725 4969533 4969762 4970777 4976227 5037976 5039516 5039636 5044290 5050453 5053570 5058322 5072588 5075004 5075213 5076148
AKR1C3-24 AKR1C3-01 AKR1C3-08 AKR1C3-11 AKR1C3-21 AKR1C3-26 AKR1C3-36 AKR1C3-35 AR-12 LRP6-02 AR-15 AKR1C4-01 AR-13 SLC30A1-01 HADHA-05 HADHA-01 HADHA-10 AR-14 ERCC4-01 ERCC4-15 RB1CC1-24 PMS2-11 PMS2-10 PMS2-01 RB1CC1-10 JTV1-01 RB1CC1-40 RB1CC1-50 CDKN1B-04 TGM1-01 TGM1-02 BIRC3-02 BIRC3-03 EPHX2-04 BIRC2-01 RAC1-03 PARP4-01 PARP4-03 PARP4-19 PARP4-23 PARP4-17 PHB-02 MMP1-03 MMP1-09 MMP1-05 MMP1-01 BLM-02 BLM-05 BLM-22 TNFRSF1A-02
rs3763676 rs12529 rs2245191 rs2275928 rs10904422 rs7070041 rs7921327 rs1937920 rs1204038 rs3782528 rs2361634 rs3829125 rs1337080 rs2278651 rs1049987 rs7260 rs2289019 rs1337082 rs1800067 rs1799800 rs17845549 rs6463524 rs2345060 rs3735295 rs2305427 rs2009115 rs17337252 Poly-0014935 rs7330 rs2229463 rs2855006 rs3758841 rs3460 rs1126452 rs1943781 rs2303364 rs13428 rs6413414 rs750771 rs1807111 rs1539096 rs4987082 rs5854 rs2071230 rs5031036 rs10488 rs2238335 rs2072352 rs2072351 rs887477
-137A>G Ex1-70C>G IVS3+73C>A IVS8+40A>G 1532bp 3' of STP G>C 1875bp 3' of STP A>G 9757bp 3' of STP A>G 12259bp 3' of STP G>A IVS1+21621G>A IVS3+4071A>T IVS1-255A>G Ex4-14C>G IVS2+15670A>G IVS1+273C>T Ex20-309A>G Ex20+348A>G IVS13-163C>G 40331bp 3' of STP A>G Ex8+31G>A IVS9-28A>G Ex23+32T>C Ex7-24G>C IVS5-223T>C IVS1+72G>A Ex18+83T>C IVS1-2221G>A Ex7+129T>C -29373T>C Ex3-387C>A Ex15-194C>T Ex7-14C>A IVS6+879C>T Ex9-76C>G Ex19+4A>C IVS5+694G>A IVS7+30C>T Ex31+172G>C Ex20-19A>T IVS17-110A>G IVS15-995C>T Ex3-89G>A 979bp 3' of STP A>G Ex10-224C>T Ex10+294T>C IVS5+19A>G Ex2-36G>A IVS1-253G>C IVS15+105G>A IVS15+184T>A IVS1-2572G>T
76
5076499 5076651 5079815 5087909 5091228 5091571 5099453 5101955 5106213 5111040 5180831 5187784 5196907 5214167 5229750 5229850 5236742 5302003 5342112 5351631 5390668 5394028 5396177 5405604 5408421 5409604 5440058 5480755 5633891 5718355 5728134 5765267 5770806 5776249 5797557 5798751 5989441 6013200 6014384 6025158 6055859 6134652 6223290 6223375 6228580 6230438 6255893 6299706 6299785 6300243
BLM-25 BLM-03 BLM-16 BLM-06 HTR1D-01 HTR1D-04 HTR1D-03 GSTM3-05 GSTM3-01 GSTM3-06 MTHFR-07 MTHFR-02 MTHFR-02 MTHFR-03 MAOA-01 ALOX12-02 CD4-03 SLC2A4-02 EXO1-02 EXO1-01 INSR-28 INSR-06 INSR-01 INSR-07 INSR-30 MPDU1-01 INSR-19 INSR-05 SAT2-01 SAT2-03 SHBG-05 SHBG-13 SHBG-01 SHBG-12 INSR-11 INSR-51 ATP1B2-13 ATP1B2-04 INSR-61 INSR-59 ATP1B2-01 TP53-14 TP53-11 TP53-66 TP53-09 TP53-69 WDR79-11 WDR79-09 WDR79-08 WDR79-06
rs16944831 rs2270132 rs389480 rs2073919 rs605367 rs6300 rs676643 rs2234696 rs7483 rs1537234 rs12121543 rs1801133 rs1801133 rs2066470 rs6323 rs1126667 rs3213427 rs5435 rs735943 rs4149963 rs3745551 rs1051690 rs1799817 rs2860175 rs8110533 rs4227 rs3815901 rs891087 rs13894 rs858520 rs6257 rs858517 rs6259 rs727428 rs1035942 rs1035940 rs1641535 rs1624085 rs3745545 E1424_156 rs1641512 rs1614984 rs12951053 rs2909430 rs8079544 rs2078486 rs2287499 rs17885803 rs2287498 rs17886268
IVS16-479C>T IVS19-499A>C IVS19-437G>A IVS20+630G>A Ex1-137G>A Ex1-1246T>C -627T>C Ex8+190A>C Ex8+91G>A IVS7-30G>T IVS7-76T>G Ex5+79C>T Ex5+79C>T Ex2-120C>T Ex2-65G>T Ex6-26A>G Ex10+283T>C Ex4-59T>C Ex11+20A>G Ex12+49C>T 2778bp 3' of STP A>G Ex22-326T>C Ex17-4C>T IVS14+88A>G IVS13+2860C>A Ex7-334G>T IVS7-126C>T Ex3+131C>T Ex6+31C>T Ex4-11G>A IVS1-17T>C IVS3+84C>T Ex8+6G>A 1121bp 3' of STP T>C IVS2-15155C>T IVS2-15330C>G -8703T>C Ex2G>C IVS2-27193A>G IVS2-27322G>A Ex7+414G>A 21226bp 3' of STP C>T IVS7+92T>G IVS4-91A>G IVS1-112G>A IVS1-3143C>T Ex1-230C>G IVS1-60C>T Ex2+19C>T IVS2-106C>T
77
6306468 6317395 6317457 6318646 6342866 6343975 6345682 6365717 6365816 6365936 6392038 6393745 6393745 6400424 6440845 6500108 6783008 6784471 6787940 6793171 7054288 7056963 7065297 7072081 7078828 7088525 7106541 7124518 7127251 7127620 7131066 7131620 7133876 7135141 7139803 7139978 7143482 7151092 7151841 7151970 7156811 7168801 7174756 7175994 7177401 7180432 7189517 7189831 7189909 7190151
INSR-13 EFNB3-01 EFNB3-02 MYBL2-19 MYBL2-30 MYBL2-31 MYBL2-06 MYBL2-36 MYBL2-03 MYBL2-46 MYBL2-09 LPL-01 LPL-04 LPL-08 LPL-03 LPL-09 LPL-05 LPL-06 XPA-02 SCUBE2-13 ARHGDIB-01 SCUBE2-02 ARHGDIB-03 ARHGDIB-03 SCUBE2-03 MTRR-22 MTRR-05 MTRR-10 MTRR-11 MTRR-07 MTRR-19 RERG-31 RERG-10 RERG-41 RERG-44 RERG-36 LIG3-08 RERG-37 RERG-29 RERG-30 RERG-33 RERG-47 RERG-24 RERG-03 DIO1-01 DIO1-05 PTEN-10 PTEN-01 XBP1-02 XBP1-01
rs919275 rs3744263 rs3744262 rs385345 rs619289 rs826950 rs419842 rs285164 E3013_458 rs420755 rs285171 rs263 rs316 rs325 rs326 rs327 rs328 rs1059507 rs1800975 rs3751058 rs921 rs3751052 rs2075267 rs2075267 rs2003906 rs2287779 rs2287780 rs10380 rs1802059 rs9332 rs8659 rs1045733 rs17834986 rs1055151 rs2193174 rs3748302 rs1052536 rs715398 E3288_225 rs10160846 rs2216225 rs767201 rs6488766 E3265_338 rs1883454 rs2235544 rs1903858 rs701848 rs2267131 rs2097461
IVS2+5915A>G Ex5-986T>C Ex5-929G>A -3962C>T -1310C>T IVS1-75C>T IVS3+316A>T IVS7+92C>T IVS9+172A>G IVS9-1919C>G IVS9-728C>G IVS5-540C>T Ex8+25C>A IVS8-298C>T IVS8-187A>G IVS8-90G>T Ex9-7C>G Ex10-807C>T Ex1+62T>C IVS18+25A>G Ex6-198C>T IVS13+13G>A -11454C>A -11454C>A IVS6-6T>C Ex9+9G>A Ex9-85C>T Ex14+14C>T Ex14-42G>A Ex15-526G>A Ex15-405A>T Ex5-277T>C Ex5-721A>T Ex5+273C>T IVS2-30357C>T IVS2-30974G>A Ex21-250C>T IVS2-36011A>C IVS2-36221T>G IVS2-36286G>A IVS2+27493C>T IVS1-341T>C -4206G>A -6205A>G -850G>T IVS3-34A>C IVS1-96G>A 1515bp 3' of STP C>T 1062bp 3' of STP G>A IVS4+156G>A
78
7201441 7211057 7211114 7344876 7347528 7355286 7363726 7381691 7387085 7389599 7390790 7657740 7663364 7664256 7664367 7664464 7664652 7668891 7780783 7838647 7854136 7859381 7874075 7874075 7874774 7879216 7879304 7887191 7887319 7890712 7890833 8019967 8020411 8021153 8063384 8064001 8068555 8069038 8069248 8069313 8101844 8129852 8133604 8135603 8178426 8194963 8402202 8475261 8581040 8582448
XBP1-09 XBP1-10 ABCC4-04 CCL5-04 CCL5-03 ABCC4-07 JAK3-01 JAK3-12 JAK3-02 TGFBR1-03 TGFBR1-04 TGFBR1-01 FAS-09 FAS-01 FAS-04 OGG1-12 OGG1-13 GDF15-01 GDF15-02 CD40-01 CD40-03 CRP-03 CRP-02 SEC14L2-01 SEC14L2-04 SEC14L2-05 HSPB8-01 VDR-12 VDR-07 CSF1R-05 CETP-08 CSF1R-03 CSF1R-02 CETP-23 CETP-21 SLAMF1-04 SLAMF1-03 SLAMF1-02 NCOA3-04 PAK6-43 NCOA3-01 NCOA3-02 PAK6-24 PAK6-19 PAK6-16 PAK6-14 PAK6-13 GPX3-21 GPX3-04 GPX3-25
rs2239815 rs3788409 rs3765535 rs2280789 rs2107538 rs2274406 rs3008 rs3212752 rs3212711 rs928180 rs334358 rs868 rs2234768 rs1324551 rs1468063 rs125701 rs2304277 rs1059519 rs1059369 rs1535045 rs3765459 rs1205 rs1800947 rs1010324 rs2267154 rs2267155 rs11038 rs757343 rs2239185 rs10079250 rs820299 rs3829987 rs2228422 rs289717 rs1801706 rs1061217 rs164283 rs2295612 rs2076546 rs900055 rs396221 rs427967 rs11636097 rs936216 rs748556 rs2242120 rs2242119 rs2042235 rs1946234 rs8177404
IVS3+395G>A -1638C>A IVS17-65T>C IVS1+231C>T -10155G>A Ex8+40A>G Ex23+291A>G IVS12+9A>G IVS2+22C>T IVS3-2409A>G IVS8+547G>T Ex9+195A>G -690C>T IVS1+853T>C Ex9-252T>C -1492G>A IVS7+110G>A Ex2+42G>C Ex2-136T>A IVS1+1066C>T IVS8-114G>A 3431bp 3' of STP G>A Ex2+491G>C IVS2+182A>G IVS5-314A>G IVS8-1361C>T Ex3-245A>G IVS8+443G>A IVS6-3968C>T Ex8+3A>G IVS2-3014T>G>C>A IVS6+28C>T Ex5-4C>T IVS10+325G>A Ex16-95A>G Ex7-127C>T IVS4-1126G>A Ex1-44C>A Ex15-74A>G IVS1-216G>A IVS17-1728T>G IVS17-1632A>G Ex3-53A>G IVS4+78C>A IVS5+48A>G Ex11+558T>A Ex11+696C>A Ex2T>C -1005A>C -631C>T
79
8583239 8588720 8905211 8943983 8944760 8948672 9200231 9211534 9217823 9218937 9231818 9232861 9498459 9500032 9523807 9730478 9741080 9759826 9759943 9801007 9810315 10172588 10173793 10186458 10195431 10200956 10201816 10382981 10387865 10613068 10614483 10619747 10620614 10623587 10631861 11070370 11081120 11107058 11321401 11323141 11326997 11327093 11335995 11347825 11349301 11359242 11359380 11560850 11562146 11562520
GPX3-28 GPX3-18 GPX3-16 TNIP1-02 NPAT-01 ATM-06 APOA2-04 APOA2-06 APOA2-02 ATM-27 ATM-02 ATM-03 RAD51-22 RAD51-01 RAD51-01 RAD51-23 RAD51-15 RAD51-17 ATM-01 ATM-01 RAD51-16 ATM-37 ATM-38 RAD51-24 MGC33948-02 RAD51-21 RAD51-20 GRPR-01 GRPR-02 P2RX7-10 PTH-01 PTH-04 PTH-03 PPARG-11 PPARG-06 PPARG-07 ABCB1-12 ABCB1-01 ABCB1-09 PCTP-01 PCTP-03 POLB-05 POLB-16 POLB-08 BIC-21 BIC-33 BIC-15 BIC-04 BIC-34 BIC-07
rs8177426 rs869975 rs8177447 rs2277940 rs228589 rs189037 rs6413453 rs5085 rs5082 rs664677 rs1800889 rs1801516 rs2619679 rs1801320 rs1801320 rs2619681 rs2304579 rs4924496 rs664143 rs664143 rs2412546 rs170548 rs3092993 rs4144242 rs4585 rs2412547 rs11852786 rs4986945 rs4986946 rs3751144 rs6256 rs6254 rs177706 rs1801282 rs2938392 rs1175541 rs1211152 rs2235074 rs9282564 rs2114443 rs12948867 rs3136717 rs2979895 rs2953983 E5157_511 rs4143370 rs12482371 rs915860 rs4817027 rs1893650
IVS1-1961A>G IVS2-89A>G IVS4-14T>C 796bp 3' of STP T>C IVS1+19A>T -4518A>G IVS3-4C>T IVS3+197G>C -756C>T IVS21-77C>T Ex31-34C>T Ex38+61G>A -4719T>A Ex1-96G>C Ex1-96G>C IVS1+1398T>C IVS2+110A>G IVS3+1932T>C IVS62+60G>A IVS62+60G>A IVS5-4480G>A IVS62-973A>C IVS62-694C>A IVS5-4016G>A IVS10-12792C>A IVS6+1598C>A 1131bp 3' of STP G>C Ex2+40T>C Ex2-103T>C Ex13+132C>T Ex3+161C>A IVS2-50A>G IVS1-98A>G Ex4-49C>G IVS7+357G>A IVS9+6835A>C IVS4-118G>T IVS4+36C>T Ex3-8G>A -1212A>G -1148A>G IVS1-89C>T IVS2-2264G>A IVS7+171G>A NC_G>T NC_G>C NC_C>T NC_C>G NC_A>G NC_C>T
80
11565876 11569308 11570392 11572413 11655624 11656249 11682671 11682866 11684038 11705598 11725903 11737878 11776794 11778085 11778085 11779578 11781710 11785892 11788077 11788077 11797080 11797252 11797531 11797544 11802044 11803252 11815065 12135032 12135242 12191748 12301294 12301504 12301746 12333125 12374608 12405488 12448786 12458715 12463109 12480530 12480594 12516830 12520596 12533645 12597384 12598844 12600224 12600356 12600860 12602686
BIC-01 BIC-10 BIC-11 BIC-32 GSTP1-01 GSTP1-02 SLC2A1-01 LRP5-01 LRP5-04 LRP5-15 LRP5-06 LRP5-07 RGS5-01 BRCA2-25 BRCA2-01 BRCA2-02 BRCA2-03 BRCA2-04 BRCA2-32 BRCA2-06 CG018-03 MGC20255-03 TGFB1-03 XPC-01 MGC4093-03 XPC-08 XPC-03 APC-09 APC-19 APC-03 APC-26 APC-13 ABCA1-17 ABCA1-31 ABCA1-15 ABCA1-12 ABCA1-26 ABCA1-04 MPO-04 PLK1-15 CYP2C19-08 CYP2C19-03 SOD3-05 CAV1-29 CAV1-19 CAV1-23 CAV1-02 IGFBP6-18 CAV1-05 CAV1-07
rs928883 rs2829801 rs767649 rs2829803 rs947894 rs1799811 rs1770810 rs312016 rs491347 rs608343 rs607887 rs3736228 rs15049 rs1799943 rs144848 rs1801406 rs543304 rs1799955 rs206147 rs15869 rs1207953 rs2241719 rs1800471 rs2228001 rs1800469 rs3731151 rs2228000 rs2229992 rs2909786 rs41115 rs866006 rs459552 rs2230808 rs2297404 rs2777801 rs4149313 rs7031748 rs2230806 rs2071409 rs40076 rs4986894 rs4244285 rs2855262 rs6950798 rs10257125 E5097_419 rs2215448 rs7974876 rs8713 rs1049334
NC_A>G NC_G>T NC_A>T NC_A>G Ex5-24A>G Ex6+5C>T IVS2+2784C>T IVS1+2130T>C IVS7-1263G>A IVS16-213T>C IVS16-82C>T Ex18-12C>T Ex5+416A>C Ex2+14A>G Ex10+321A>C Ex11+1487A>G Ex11+1898T>C Ex14-194A>G IVS24+5507C>T Ex27-336A>C IVS6-195G>C Ex5+1082T>A Ex1-282C>G Ex16+211A>C 308bp 3' of STP C>T Ex11+28A>G Ex9-377C>T Ex12+50T>C IVS14-2583A>G Ex16+2521G>A Ex16+3310T>G Ex16+3507T>A Ex35-14A>G IVS33-26C>G IVS32+30T>G Ex18-8A>G Ex15-76C>A Ex7-65G>A IVS11-6A>C IVS3+26A>G -97C>T Ex5+39G>A Ex3-489C>T -3533C>T -2812A>T -2499C>G -1164A>G -18227T>C Ex3+798A>C Ex3-851A>G
81
12605896 12606176 12606593 12610181 12658484 12659374 13378031 13388198 13475483 13502625 13502756 13507090 13525818 13870572 13886729 13891888 13892299 13909232 13939789 13953012 13957532 14097799 14127094 14127450 14128514 14133890 14139889 14577867 14583078 14590783 14591572 14591769 14884009 14885671 14888082 14907958 14912477 14942072 15001508 15005484 15270891 15290142 15477334 15588122 15588843 15589156 15590491 15622440 15626340 15626923
CAV1-09 IGFBP6-17 IGFBP6-19 SOAT2-21 SOAT2-01 SOAT2-09 MET-13 MET-26 GGH-02 GGH-01 MET-04 MET-01 HTR1B-02 HTR1B-07 AKR1A1-02 HAO2-01 HSD3B2-25 HSD3B2-19 HSD3B2-14 HSD3B2-07 LOC391073-01 HSD3B1-23 HSD3B1-26 HSD3B1-24 HSD3B1-22 HSD3B1-25 HSD3B1-18 XRCC1-01 SLC30A4-01 ERCC5-01 ERCC5-05 ERCC5-02 AHR-19 AHR-17 ERCC3-04 AHR-01 ERCC3-02 ZNF230-01 ANKK1-01 DRD2-03 DRD2-01 HFE-01 HFE-07 HFE-08 SSTR3-01 SSTR3-03 FAM82A-01 FAM82A-08 FAM82A-02 CYP1B1-08
rs1049337 rs12821902 rs822688 rs2280698 rs2280699 rs17123210 rs11762213 E4094_67 rs1031552 rs719235 rs13223756 rs41736 rs6296 rs130058 rs2088102 rs1417604 rs879332 rs4659175 rs12411115 rs1361530 rs1417608 rs2064902 rs6667572 rs4659182 rs1998182 rs6428830 rs10754400 rs25487 rs1153829 rs1047768 rs2227869 rs17655 rs7796976 rs2074113 rs4150474 rs2066853 rs4150416 rs12753 rs1800497 rs1079597 rs1799978 rs1799945 rs1572982 rs707889 rs229569 rs86582 rs163077 rs1367696 rs163086 rs10916
Ex3-644C>T -3308C>T IVS1-1109C>T -73A>G IVS1-237A>G IVS1-8C>G Ex2+158G>A Ex2+548C>T IVS7-3001C>T -353C>A Ex7-22A>G Ex20+60C>T Ex1-313G>C -160A>T IVS5+282T>C IVS4+707G>A -17124G>A -1569T>C IVS2-1665G>T Ex4-88C>G 10174G>A -31680A>C -27428A>G -24247G>T -12386A>G IVS3+485A>G 713bp 3' of STP G>T Ex10-4A>G Ex8-66G>A Ex2+50T>C Ex8-369G>C Ex15-344G>C Ex1+185A>G IVS7+33T>G IVS10-2790G>T Ex10+501G>A IVS6-108G>T Ex5-284C>A Ex8-313G>A IVS1-882A>G -50977T>C Ex2+111C>G IVS5-47A>G IVS6+462G>A Ex2-807C>T Ex1+453G>A IVS10-8520T>C IVS10-7211A>G IVS10-1363T>C Ex3+1284G>T
82
15627130 15631499 15636693 15640594 15641004 15641233 15765817 15766207 15786543 15805034 15824125 15862321 15992431 15993452 16004892 16014498 16027033 16042588 16046491 16051679 16063948 16104534 16108786 16111967 16123828 16140890 16144097 16323944 16567901 16594193 16604761 16617678 16704367 16739720 16741069 16745061 16754290 16783732 16833244 16858702 16908767 16949430 16952618 16954182 16993566 16993905 17101538 17102847 17108695 17113103
CYP1B1-31 CYP1B1-07 CYP1B1-27 CYP1B1-28 CYP1B1-18 TSG101-30 TSG101-40 TSG101-28 TSG101-33 TSG101-07 TSG101-36 CYP7B1-03 CYP7B1-02 CYP7B1-06 CYP7B1-01 RAD23B-02 RAD23B-03 RAD23B-04 RAD23B-05 APOE-03 CYP24A1-08 CYP24A1-05 CYP24A1-03 CYP24A1-01 PLA2G6-08 PLA2G6-10 PLA2G6-02 PLA2G6-12 CASP3-09 CASP3-08 CASP3-07 CASP3-02 KRAS-12 KRAS-05 KRAS-22 KRAS-08 KRAS-04 ERCC2-03 ERCC2-09 KRAS-06 KRAS-19 KRAS-10 KRAS-17 KRAS-15 KRAS-07 KRAS-20 KRAS-16 KRAS-21 PPP1R13L-01 KRAS-03
rs162562 rs1800440 rs162556 rs162555 rs10175368 rs2291752 rs2279900 rs2279902 rs2292176 rs12574333 rs2292179 rs1451868 rs1376772 E3566_386 rs3779870 rs1805335 rs1805330 rs1805329 rs1805334 rs440446 rs751087 rs2296241 rs2259735 rs2248359 rs2016755 rs84473 rs4376 rs132987 rs6948 rs1049216 rs1405938 rs3087455 rs1137196 rs13096 rs9266 rs712 rs17473423 rs28365048 rs1799787 rs4246229 rs6487461 rs11047902 rs17388148 rs17329025 rs4623993 rs7133640 rs17329424 rs7973746 rs6966 rs10505980
Ex3+939A>C Ex3+315A>G -3922C>T -4977A>G -5329G>A 364bp 3' of STP G>A IVS9+18G>A IVS7-13T>C IVS5+61G>T IVS4+10C>A -182T>C 9712bp 3' of STP C>T 9625bp 3' of STP C>T IVS4-1678T>C IVS4-1752T>C IVS5-15A>G IVS6-3C>T Ex7+65C>T IVS7-22A>G IVS1+69C>G IVS7-1255A>G Ex4+9T>C IVS2-105T>C Ex2G>A IVS3-309T>C IVS2+7899A>G IVS2+4480G>A IVS2+1653T>C Ex8-280C>A Ex8+567T>C IVS3-46A>G IVS2-1555A>C Ex6-790T>G Ex6-1662T>C Ex6+629A>G Ex6+294A>C Ex6+69A>G Ex23+61A>C IVS19-70C>T IVS5+702G>A IVS5+287T>C IVS3+375C>T IVS2-1840T>G IVS2-3467A>G IVS2-5082C>T IVS2-7970G>C IVS2+7144A>C IVS2+6969G>C Ex6-67A>T IVS2+5765C>T
83
17113448 17114072 17122387 17123442 17123794 17288969 17290400 17292873 17318269 17323456 17335787 17352839 17352926 17372445 17372519 17402223 17405466 17405533 17407354 17677385 17829825 17839127 17841222 17844426 17930119 17947841 17951260 17954087 17961070 17962029 17968558 17973117 18117943 18118815 18121191 18121526 18121751 18123137 18124362 18126643 18127058 18138767 18141160 18142787 18144402 18147290 18150038 18150213 18151180 18151417
KRAS-01 KRAS-02 KRAS-11 KRAS-13 KRAS-14 KRAS-09 KRAS-18 ERCC1-30 ERCC1-05 ERCC1-06 CALCR-01 CALCR-03 BRIP1-05 BRIP1-02 BRIP1-03 BRIP1-09 BRIP1-15 BRIP1-01 IL4R-24 IL4R-27 IL4R-02 IL4R-03 IL4R-05 IL4R-07 IL4R-10 SOD1-01 FOXA1-41 CDK7-01 RPA4-01 DRD1-02 LEPR-08 LEPR-03 LEPR-01 LEPR-04 SULT1A2-09 AURKA-08 AURKA-15 AURKA-16 AURKA-06 ABCB11-08 AURKA-04 AURKA-02 AURKA-03 CSTF1-21 CSTF1-22 CSTF1-10 CSTF1-08 ABCB11-02 SELE-01 APOA4-07
rs10842515 rs2970532 rs11047918 rs12226937 rs12228277 rs10842518 rs4368021 rs3212986 rs11615 rs3212948 rs1801197 rs2074122 rs4986763 rs4986764 rs4986765 rs1015771 rs4988340 rs2048718 rs2057768 rs3024544 rs1805011 rs1805012 rs1805015 rs1805016 rs8832 rs2070424 E3074_384 rs2972388 rs2642219 rs5326 rs1887285 rs7602 rs1137100 rs1137101 rs3194168 Poly-0014870 rs8173 rs10485805 rs6024840 rs853785 rs2298016 rs1047972 rs2273535 rs16979877 rs6064387 rs6099129 rs6064389 rs3770603 rs5361 rs5100
IVS2+4685T>C IVS2+2173C>T IVS2+1176G>A IVS2+506C>T IVS2+190T>A IVS1-1877G>T IVS1+1863T>C 196bp 3' of STP G>T Ex4+33A>G IVS3+74C>G Ex13+149T>C IVS8+245C>A Ex20+506T>C Ex19-151T>C Ex19+62A>G IVS14+3238T>C IVS1+12A>G -1918G>A -29429C>T IVS3-85C>T Ex10+300A>C Ex11+392T>C Ex10+608T>C Ex10-1169T>G Ex10-309A>G IVS3-251A>G N/A Ex2-28C>T Ex1+500G>A IVS2-90A>G IVS2+6686G>A IVS2+6890A>G Ex4-45A>G Ex6-36A>G 336bp 3' of STP T>C 800bp 3' of STP G>C Ex11-347G>C IVS9-68T>C IVS7-80T>C IVS19-1123A>G IVS6+30G>C Ex5+127A>G Ex5+49T>A IVS1+269G>A IVS1+390A>G IVS1+870G>T IVS1+966G>T IVS1+4517G>A Ex4+24A>C IVS2-97T>C
84
18152497 18155009 18156006 18156676 18156992 18159180 18160796 18180954 18191871 18192580 18286270 18303190 18414057 18416408 18416526 18503585 18593694 18593880 18635174 18666436 18686951 18687043 18687259 18688006 18688866 18701191 19066999 19125611 19435714 19679782 19717140 19717344 19855834 19877906 19916091 19997321 19997699 19998691 20009615 20012011 20012204 20014371 20014449 20020946 20021067 20021547 20021643 20092635 20110000 20255110
APOA4-02 IFNAR2-01 IFNAR2-06 IFNAR2-10 CDK4-01 ABCC2-01 METTL1-01 ABCC2-02 ABCC2-03 ABCC2-10 IFNGR2-03 LIG1-02 LIG1-18 LIG1-29 LIG1-01 LIG1-03 HIF1AN-02 HSD17B4-15 HSD17B4-19 HSD17B4-01 HSD17B4-21 HSD17B4-10 HSD17B4-17 HSD17B4-03 HSD17B4-18 HSD17B4-08 HSD17B4-16 IL10RA-08 IL10RA-02 FUT2-05 LCAT-03 LCAT-05 DHDH-02 DHDH-03 BAX-03 BAX-05 ROS1-20 ROS1-18 ROS1-03 ROS1-12 CYP2D6-65 ROS1-15 ROS1-14 ROS1-04 LIG4-01 CDKN2A-03 CDKN2A-09 CDKN2A-11 CDKN2A-14 CDKN2A-12
rs5092 rs3153 rs7279064 rs2236757 rs2072052 rs717620 rs703842 rs2273697 rs3740074 E3510_102 rs1059293 rs13436 rs3729512 rs156641 rs20580 rs20579 rs2295780 rs2451818 rs384346 rs28943585 rs7737181 rs2546210 rs32659 rs17145464 rs3797372 rs28943596 rs246965 rs2229114 rs9610 rs603985 rs5923 rs1109166 rs4987162 rs2270939 rs4645887 rs905238 rs498251 rs497186 rs581235 rs574664 rs2854741 rs1998206 rs2243377 rs2243 rs1805386 rs3088440 rs2518719 rs3731246 rs2811708 rs3731239
Ex2+38G>A IVS1-4640G>A Ex2-28T>G IVS6-50A>G -1218T>G Ex1+8C>T Ex7+196C>T Ex10+40G>A IVS15+169T>C IVS27-73A>G Ex7-128C>T Ex26+3G>C IVS25+19A>G IVS19-131A>G Ex7+44C>A Ex2-24C>T IVS5+159A>G -27855G>T -18796A>T -2124A>T IVS8+4959C>G IVS9-194C>T IVS15+428A>G IVS22+74G>C IVS22-1666G>A Ex24-76A>G 13225bp 3' of STP A>G Ex7+449C>T Ex7-109G>A 11bp 3' of STP C>T Ex6-167C>T IVS1-267A>G IVS2+65C>G Ex4-26T>C IVS4+286A>T 490bp 3' of STP A>G IVS37+85A>T IVS36-4A>G IVS32+504A>G IVS32+361A>T IVS6-56C>G Ex5-6A>C IVS4-31C>T IVS3+31C>T Ex2-1349T>C Ex4+83C>T IVS3+474T>C IVS2-682C>G IVS2+981C>A IVS2+185C>T
85
20255880 20271375 20276125 20286787 20290025 20291104 20306045 20312341 20320054 20352532 20471563 20889226 20890565 20899598 20922743 20937020 21054491 21175428 21184487 21201159 21234688 21242614 21258025 21282186 21285465 21292962 21305928 21432294 21434502 21475447 21588152 21591581 21706623 21711123 21728066 21733574 21808695 21808848 21819417 21819560 21834300 21894877 21895051 21906819 21951589 21958159 21960427 21961989 21963422 21964218
CDKN2A-13 CDKN2A-20 CDKN2A-19 CDKN2A-18 CDKN2A-16 IL6-04 IL6-01 AXIN2-09 AXIN2-12 AXIN2-14 AXIN2-11 AXIN2-13 AXIN2-10 AXIN2-03 CYP19A1-08 CYP19A1-09 CYP19A1-06 CYP19A1-04 CYP19A1-01 CYP19A1-34 CYP19A1-40 CYP19A1-14 CYP19A1-29 CYP19A1-39 CYP19A1-41 CYP19A1-16 CYP19A1-30 LTA-05 LTA-01 TNF-12 TNF-09 TNF-02 TNF-13 CYP19A1-15 CYP19A1-27 CYP19A1-38 CDH1-06 CYP19A1-36 IRF3-02 IRF3-12 IRF3-01 CYP19A1-37 CDH1-09 APAF1-03 APAF1-04 APAF1-07 APAF1-09 ABCG8-06 ABCG8-01 ABCG8-02
rs2518720 rs3731217 rs3731211 rs3731198 rs3218020 rs1800797 rs1800795 rs11868547 rs7210356 rs4128941 rs4541111 rs11867417 rs3923087 rs2240308 rs4646 rs10046 rs1065779 rs2304463 rs700518 rs2414096 rs727479 rs767199 rs12907866 rs6493494 rs749292 rs730154 rs28566535 rs3093546 rs909253 rs1799964 rs1800630 rs1800629 rs3093661 rs1004984 rs1004983 rs2470144 rs9282650 rs2445765 rs7251 rs2304206 rs2304204 rs2446405 rs1801026 rs2278361 rs2288729 rs1007573 rs1866477 rs9282575 rs9282572 rs6544718
IVS1-3882G>A IVS1+9477G>T IVS1+7291A>T IVS1+4661A>G -3418C>T -660A>G Ex2C>G 2490bp 3' of STP G>C IVS9+1080A>G IVS8+413G>A IVS3-77C>A IVS2-223T>C IVS1-3483T>C Ex1+237G>A Ex11+410G>T Ex10+268C>T IVS8-53T>G IVS7-106T>G Ex4-57A>G IVS3-573T>C IVS3+418G>T IVS2-5240T>C IVS2-10307T>C IVS2-14688T>C IVS2-23584T>C IVS2+24809A>G IVS2+14872T>G Ex1+50A>G IVS1+90G>A -1210C>T -1042A>C -487A>G IVS1+54G>A IVS2+2484C>T IVS2+2361G>T -86615T>C IVS2-25933A>T -99788G>C Ex8-81G>C IVS1+17C>T -924A>G -111683A>T Ex16+264A>C>G>T IVS3-58G>A IVS12+2093G>A IVS16-565G>A IVS25+515T>G Ex5-20G>A IVS5+46C>T Ex13+11T>C
86
21968979 21974661 21976847 21979477 21987872 22162516 22162940 22252344 22257691 22260072 22263279 22266639 22278002 22283332 22293401 22293543 22295368 22298677 22319669 22320336 22325104 22330944 22336011 22340392 22349288 22381761 22391698 22398393 22398564 22400559 22400727 22401282 22402009 22404086 22404209 22412282 22423839 22425455 22431099 22437061 22437210 22437350 22481655 22525398 22549781 22574812 22602024 22895539 22895604 22920858
BZRP-09 BZRP-03 BZRP-05 TERF2-14 TERF2-01 TERF2-03 FASLG-01 CBR1-01 CBR1-10 CBR1-11 CBR3-01 POLD1-13 CYP17A1-13 CYP17A1-08 CYP17A1-11 CYP17A1-10 CYP17A1-12 CYP17A1-01 NQO1-15 NQO1-08 NQO1-07 MYO5A-01 MYO5A-06 MYO5A-07 ALAD-03 ALAD-10 ALAD-01 POT1-37 POT1-18 POT1-02 POT1-11 POT1-10 POT1-09 POT1-07 POT1-05 POT1-03 LOC401398-01 RXRB-11 RXRB-02 BAK1-05 BAK1-06 NR1H4-18 BAK1-07 NR1H4-05 CYP3A7-01 CYP3A4-57 CTH-01 CTH-07 CTH-10 CTH-03
rs3937387 rs113515 rs6971 rs251796 rs153045 E3673_301 rs929087 rs25678 rs1005695 rs2156406 rs881712 rs1726787 rs619824 rs10883782 rs4919682 rs284849 rs4919687 rs743572 rs10517 rs689453 rs689452 rs1058219 rs2290336 rs2242058 rs1805313 rs8177806 rs1139488 E5058_689 rs1034794 rs727506 rs10250202 rs10244817 rs10263573 rs7784168 rs6959712 E5047_301 rs6466966 rs2072915 rs2076310 rs210135 rs513349 E3706_375 rs210145 rs35724 rs12360 Poly-0014748 rs663465 rs6413471 rs473334 rs663649
IVS1-22C>G IVS2-136C>G Ex4+118A>G IVS7-42T>C IVS7-2001A>G IVS6+27G>A IVS2-1417A>G Ex1-71G>C IVS2+210G>C IVS2+316A>G Ex1-11C>T IVS2+21C>T 9170bp 3' of STP G>T 6526bp 3' of STP T>C 6128bp 3' of STP G>A IVS7+83C>A IVS1-99T>C Ex1+27T>C Ex6-452T>C Ex2+65G>A IVS1-27C>G Ex29-114C>T IVS20-78G>A IVS19+38G>A IVS11+66C>T Ex6+17C>T Ex4+4T>C 22999bp 3' of STP T>C 22614bp 3' of STP A>T 1988bp 3' of STP C>T IVS13-98T>G IVS12-111G>A IVS12+41T>A IVS6-33G>A IVS5+8T>A -1386G>A IVS1-7C>T Ex10+525T>A IVS3+51C>T Ex6-364T>A IVS5-35T>C IVS4-3518G>A IVS1+362G>C IVS9-285G>C Ex13+125C>T -17677G>A -340A>G IVS3-66A>C IVS7-799A>G IVS7-583G>T
87
22945707 22947435 22949439 23009633 23011592 23016451 23040996 23104502 23105435 23105541 23169639 23170521 23329814 23332458 23332856 23339708 23343774 23345678 23357959 23366572 23366663 23434121 23458292 23462341 23472395 23474144 23475104 23862828 23863213 23883839 23887321 23889286 23891083 23913853 23920819 23960442 24002124 24020332 24024284 24398942 24399969 24404909 24405690 24437569 24565711 24653205 24696151 24706576 24716360 24716576
CTH-14 CTH-13 ZNF350-08 ZNF350-04 ZNF350-06 ADH1C-01 ADH1C-16 ADH1C-15 ADH1C-18 HMGCR-01 HMGCR-02 CGA-03 CGA-02 CGA-05 CGA-06 TERF1-27 CD80-01 CD80-04 CD80-02 TERF1-02 TERF1-04 TERF1-01 TERF1-06 GSK3B-37 GSK3B-09 GSK3B-22 GSK3B-14 GSK3B-05 GSK3B-04 GSK3B-08 GSK3B-07 GSK3B-35 GSK3B-18 GSK3B-25 GSK3B-38 GSK3B-20 GSK3B-41 GSK3B-43 GSK3B-19 GSK3B-15 GSK3B-31 GSK3B-03 GSK3B-39 GSK3B-32 GSK3B-23 GSK3B-29 GSK3B-01 GSK3B-40 GSK3B-42 GSK3B-34
rs559062 rs515064 rs2278414 rs2278415 rs4988334 rs698 rs2009181 rs283411 rs17526590 rs2241402 rs2303151 rs4986869 rs6631 rs6155 rs932742 rs10106086 rs2228017 rs9282638 rs1385520 E3663_301 rs2306494 rs2306492 rs3863242 rs3732361 rs2873950 rs10934500 rs4624596 rs1719889 rs1719888 rs1732170 rs1719895 rs2319398 rs7617372 rs1574154 rs4072520 rs6438553 rs7620750 rs9873477 rs9878473 rs4688046 rs17810235 rs1381841 rs4688047 rs17810302 rs10934503 rs17204605 rs1154597 rs6770314 rs9851174 rs1870931
IVS10-430C>T IVS10-303A>G Ex5-229T>C Ex5-610A>T Ex5+470T>C Ex8-56A>G IVS6-680T>C IVS5+62G>T IVS1-42C>T IVS8+56T>A IVS18+70T>C 292bp 3' of STP A>G Ex4-38T>A Ex2+22A>G IVS1+46A>G -27187A>G Ex3+35G>A IVS2-56G>A IVS2+851C>T IVS7+82C>T IVS8-124G>A IVS9+448G>A IVS9-163C>T 3337bp 3' of STP A>G IVS11-1360T>G IVS10-5923T>C IVS10-9341G>A IVS10+3478A>T IVS10+3386A>G IVS9-1224A>G IVS7-148C>T IVS7+11660C>A IVS7+5272T>C IVS6-2548T>C IVS4-372C>A IVS4+2191T>A IVS3-851G>A IVS3-3646A>G IVS3-8458G>A IVS3+2245G>A IVS2-8853C>T IVS2-12604T>C IVS2-16563C>T IVS2-19279A>G IVS2-24969T>C IVS1-12578G>A IVS1-15747T>C IVS1-21635G>A IVS1-28325G>A IVS1-35927C>G
88
24723334 24723461 24736012 24736393 24737188 24755493 24757251 24760661 24763749 25240613 25249809 25615352 25615430 25618075 25624856 25747287 25758826 25758916 25770771 25796065 25804580 25805255 25811386 26037443 26042208 26063269 26066687 26073934 26074026 26078822 26090649 26108088 26114476 26122393 26130539 26135175 26138327 26141122 26145934 26159016 26170197 26173948 26177907 26180623 26186313 26228810 26231979 26237867 26244557 26252159
GSK3B-21 GSK3B-27 GSK3B-02 GSK3B-28 GSK3B-17 GSK3B-30 IGF1-24 GSK3B-33 IGF1-22 IGF1-27 GSK3B-36 IGF1-16 GSK3B-11 GSK3B-12 IGF1-44 IGF1-46 IGF1-15 GSK3B-45 IGF1-11 IGF1-04 MSH2-08 MSH2-15 MSH2-06 MSH2-21 MSH2-09 MSH2-19 MSH2-18 MSH2-12 MSH2-20 MSH2-13 MSH2-03 MSH2-03 MSH2-14 MSH2-10 MSH2-16 MSH6-01 MSH6-04 LEP-01 NFKB1-01 NFKB1-02 NFKB1-33 NFKB1-09 PIM1-03 PIM1-17 PIM1-25 PIM1-01 NFKB1-21 NFKB1-14 CD86-03 CD86-02
rs6781942 rs16830683 rs12630592 rs16830689 rs6779828 rs17204878 rs5742714 rs17810676 rs5742694 rs978458 rs334535 rs4764883 rs334555 rs334559 rs5742667 rs5742665 rs2373721 rs3755557 rs5742629 rs2162679 rs1863332 rs4952887 rs17036577 rs7607076 rs1981928 rs7602094 rs7585925 rs3771281 rs17036614 rs3821227 rs2303428 rs2303428 rs4608577 rs2042649 rs6544991 rs3136228 rs1800935 rs2167270 rs3774932 rs3774937 rs230532 rs230496 rs262933 rs1757000 rs12197850 rs10507 rs4648059 rs230547 rs9282641 rs1129055
IVS1-36963T>C IVS1-39082C>T IVS1+43948C>A IVS1+40923G>C IVS1+37047G>A IVS1+35314G>T Ex4-177C>G IVS1+31645T>C IVS3-2892C>A IVS3-5895A>G IVS1+19890C>T IVS3+6982G>A IVS1+8058G>C IVS1+2589T>C IVS2-10010C>T IVS2-10082C>G IVS2-13577G>C N/A IVS2+12158A>G IVS1-1682A>G -432T>G IVS6+3400C>T IVS7-5849T>C IVS7-1122A>G IVS7-212T>A IVS8+719T>C IVS8+1488T>G IVS9-1516C>T IVS11+501A>G IVS11-1207C>T IVS12-6C>T IVS12-6C>T IVS13+274T>G IVS15-214T>C 2691bp 3' of STP A>C -556G>T Ex3+83T>C Ex1-11A>G IVS1+1246A>G IVS1+11306C>T IVS2-826T>A IVS6+199A>G -3975A>G -3185A>G Ex6+253C>A Ex6+713C>T IVS12-452C>G IVS23-1330T>C Ex2+19A>G Ex8+35G>A
89
26253195 26255314 26263392 26266417 26270293 26272026 26272042 26275695 26281426 26284429 26287450 26288495 26299282 26304751 26305668 26305740 26309235 26310103 26339453 26353449 26445831 26462901 26482771 26487498 26488408 26489448 26490217 26508214 26514635 26516890 26519433 26519433 26519917 26525637 26528713 26825749 26839048 27296893 27918904 27928964 27944878 27983208 27992626 27993416 28000212 28000672 28010316 28030988 28291914 28333465
CASR-11 CASR-05 MX1-04 MX1-28 CASR-15 MX1-07 MX1-08 MX1-22 MX1-03 MX1-10 MX1-01 MX1-11 CASR-07 CASR-06 CASR-09 CASR-01 BHMT-02 BHMT-01 BHMT-04 CHEK1-01 CHEK1-03 CHEK1-02 LIPC-17 LIPC-01 LIPC-02 MEST-03 LIPC-25 LIPC-04 LIPC-37 LIPC-06 LIPC-08 LIPC-23 LIPC-09 DHFR-07 DHFR-11 DHFR-18 MSH3-02 MSH3-29 MSH3-03 MSH3-07 IFNG-07 MSH3-12 MSH3-09 MDM2-01 ALDH1L1-06 ALDH1L1-03 ALDH1L1-01 PTGS1-02 LMO2-08 LMO2-01
rs4678045 rs1965357 rs458582 rs455599 rs3749208 rs469270 rs469390 rs2070229 rs2280807 rs2072683 rs1050008 rs469304 rs2279802 rs2270916 rs2270917 rs1042636 rs567754 rs585800 rs617219 rs558351 rs491528 rs506504 rs1077834 rs1800588 rs3825776 rs2072574 rs1869145 rs1968687 rs1968689 rs6083 rs2242064 rs2242066 rs6074 E5043_337 rs865646 rs1650697 rs1805355 rs1677649 rs836802 rs3797896 rs1861494 rs32983 rs26279 rs769412 rs9282690 rs1127717 rs2305230 rs5788 rs3740616 rs3740617
IVS1+20204A>G IVS1-4243C>T IVS5+404G>T IVS5+577A>G IVS3-91C>T IVS11-198G>A Ex13+4G>A Ex14+50T>C IVS14+43A>G IVS15-99C>T Ex16+114A>G Ex16-64G>A IVS5+52A>G IVS6+16C>T IVS6+163C>T Ex7+1236A>G IVS4+52C>T Ex8+453A>T 2654bp 3' of STP A>C -1399T>C IVS2-36G>T Ex13+76A>G -752C>T -556C>T IVS1+22511T>C IVS5-85A>G IVS1-33033C>T IVS1-7835G>T IVS1-7747C>T Ex5+70A>G IVS5+1098G>T IVS5+1163A>G Ex9+49C>A IVS3+2979C>G IVS3+2851A>C Ex1-3G>A Ex4-100A>G IVS4+69A>G IVS8+8888G>C IVS19+5137C>G IVS3+284G>A IVS20+10801C>T Ex23+3A>G Ex12+162A>G IVS21+46G>A Ex21+31A>G Ex10-40G>T Ex6-40C>A Ex6+226T>A Ex6+106A>G
90
28418009 28463698 28466376 28466549 28475430 28479047 28479800 28482983 28483135 28486319 28486531 28486603 28490087 28496245 28496392 28498915 29010774 29021566 29023952 29057680 29059882 29087611 29514036 29514232 29537387 29555519 29588056 29613254 29613342 29628567 29629829 29629894 29651520 30536587 30536715 30545139 30560387 30560555 30578158 30688158 30694715 30714719 30763295 31376521 32321092 32321213 32351849 32464996 32668137 32668257
LMO2-04 CCND3-01 CCND3-02 RNASEL-01 RNASEL-02 XRCC4-05 XRCC4-07 MBD2-01 MBD2-02 MBD2-03 XRCC4-10 MBD2-04 XRCC4-04 XRCC4-01 CAT-07 CAT-02 CAT-15 CAT-05 CAT-03 CAT-06 IL3-01 CSF2-02 NCF2-05 NCF2-04 NCF2-03 AMACR-01 AMACR-08 AMACR-09 AMACR-02 AMACR-17 AMACR-03 AMACR-05 IRF1-05 IRF1-03 IL13-02 IL13-03 IL13-06 IL13-01 IL4-02 IL4-01 IL4-03 IL4-11 IL4-10 VEGF-19 VEGF-05 VEGF-04 NFKBIE-03 NFKBIE-02 NFKBIE-08 NFKBIE-01
rs3781577 rs9529 rs2479717 rs11072 rs486907 rs2075685 rs2662238 rs7614 rs1145315 rs609791 rs2891980 rs603097 rs3777015 rs1805377 rs9282626 rs769214 rs1049982 rs769218 rs769217 rs475043 rs40401 rs25882 rs699244 rs2296164 rs2274064 rs2278008 rs6863657 rs840409 rs34677 rs10941112 rs34689 rs3195676 rs839 rs9282763 rs1881457 rs1800925 rs1295686 rs20541 rs2243248 rs2243250 rs2070874 rs2243268 rs2243290 rs1005230 rs25648 rs3025039 rs2282151 rs730775 rs513688 rs483536
IVS1-3051T>C Ex5-337A>G IVS2-42T>A Ex6-560A>G Ex1-96G>A Ex2G>T IVS4-64A>G Ex8+438A>G IVS6+1938A>G IVS3-3743G>C IVS7-6281C>T -2176C>T IVS7-61G>A IVS7-1A>G -1042C>T -843G>A Ex1+49T>C IVS1-60A>G Ex9-29C>T 820bp 3' of STP C>T Ex1-84C>T Ex4+23T>C IVS15-87C>A IVS10-21C>T Ex6+41T>C Ex5+90G>A IVS4+4012T>C IVS4+3803C>G Ex4-23G>T Ex3-29A>G IVS1+169G>T Ex1+114A>G Ex10-347C>T IVS6-68G>A -1469A>C -1069C>T IVS3-24T>C Ex4+98A>G Ex2T>G -588C>T Ex1-168C>T IVS2-1443A>C IVS3-9A>C -2487C>T Ex1-73C>T 236bp 3' of STP C>T 8321bp 3' of STP A>G IVS1+645T>C IVS1-2163C>A -14107A>T
91
32693725 32761257 32763424 32952270 32963496 32967023 33093665 33170346 33178057 33208228 33237021 33242208 33243241 33243301 33246759 33246958 33247782 33257920 33270149 33281042 33811491 33826473 33934391 33943874 33951326 33962275 33967491 33967700 33971525 33977464 33980466 33980857 34234139 34237146 34407422 34407822 34410856 34410977 34423657 34424167 34424723 34428976 34433182 34594746 34597227 34610786 35084445 35090324 35093940 35094103
EGF-08 RAG1-01 EGF-02 EGF-04 MBD4-02 HSD17B2-02 HSD17B2-01 IL7R-01 IL7R-08 ENPP1-04 MLH1-02 MLH1-05 PTGS2-33 PTGS2-44 PTGS2-19 PTGS2-08 PTGS2-05 CCNH-01 CCNH-04 ENG-06 CX3CR1-02 CX3CR1-01 CDC25C-01 PMS1-56 PMS1-57 PMS1-49 PMS1-15 PMS1-24 PMS1-48 PMS1-27 PMS1-63 PMS1-28 PMS1-60 PMS1-47 PMS1-26 PMS1-50 PMS1-61 PMS1-62 PMS1-54 PMS1-31 PMS1-53 PMS1-52 PMS1-51 MATR3-01 SLC23A1-20 SLC23A1-09 SLC23A1-05 SLC23A1-18 SEP15-04 SEP15-02
rs4444903 rs2227973 rs2237051 rs971696 rs140696 rs723012 rs1424151 rs1494555 rs7737000 rs1044582 rs1799977 rs2286940 rs5275 rs4648276 rs5277 rs20417 rs689466 rs2266690 rs3093816 rs1330684 rs3732378 rs3732379 rs1042124 rs5742926 rs5742938 rs1233299 rs1233302 rs5743030 rs1233284 rs1233288 rs1233291 rs1233297 rs5743072 rs1233255 rs1233258 rs12618262 rs5743112 rs5743116 rs256567 rs256564 rs256563 rs256552 rs256550 rs11738738 rs6596471 rs4257763 E3359_310 rs10063949 rs540049 rs5845
Ex1+61A>G Ex2+2473A>G Ex14+71G>A IVS22-1443T>A Ex6+2C>T IVS3-5735C>T IVS4-2328A>G Ex4+33G>A Ex4-43C>T Ex25-243A>T Ex8-23A>G IVS12-169C>T Ex10+837T>C IVS7+111C>T Ex3-8G>C -898G>C Ex2A>G Ex8+49T>C IVS7+132C>T IVS12-117A>G Ex2+848C>T Ex2+754G>A Ex1-62G>T Ex2G>T IVS1+639G>A IVS3+3961A>C IVS3-1498C>A IVS4-4198G>A IVS5+6865G>A IVS5+7819C>T IVS5+8045G>C IVS5+11269C>T IVS5-11766A>G IVS5-2598A>C IVS5-1656C>T IVS5-617C>T IVS6+176C>A IVS6-3413T>C IVS9-938C>T IVS10+1095A>G IVS10-693A>G 211bp 3' of STP A>G 2575bp 3' of STP T>C 3101bp 3' of STP A>T IVS14+2088T>C IVS10+109T>C Ex8+22G>A -583G>A Ex5-176C>T Ex5+450T>C
92
35329240 35384554 35396328 35422995 35647243 35732971 35743551 35843947 35844030 36316537 36993572 37010110 37051997 37054427 37057136 37059260 37059690 37289632 37291745 37900803 39247166 39247260 40082358 40858221 40859374 40874054 40878296 40887961 40899187 40900141 40900367 40903591 40906340 40915508 40916450 40917489 40918398 40923384 40936947 40939465 40941248 40951790 40954154 41083199 41120601 41129172 41130515 41134539 41147701 41148232
DNAJC18-01 CTNNB1-11 CTNNB1-01 CTNNB1-14 CTNNB1-07 CTNNB1-05 CTNNB1-16 CTNNB1-15 CTNNB1-19 CTNNB1-02 CTNNB1-03 CTNNB1-13 CTNNB1-08 CTNNB1-17 CTNNB1-21 IFNGR1-01 IFNGR1-05 MYC-02 STAT1-01 GHR-31 GHR-28 GHR-16 GHR-11 GHR-11 GHR-214 GHR-33 GHR-79 GHR-29 GHR-30 GHR-27 GHR-50 GHR-47 GHR-21 GHR-45 GHR-90 GHR-77 GHR-46 GHR-01 GHR-34 GHR-03 SEPP1-02 SEPP1-01 GSTA4-01 GSTA4-02 GSTA4-07 GSTA4-04 IGFBP1-01 IGFBP3-04 ESR2-02 ESR2-05
rs4315920 rs3864004 rs11564437 rs4533622 rs2371452 rs1798794 rs9813198 rs5743395 rs1880481 rs11564452 rs11564465 rs4135385 rs2953 rs11129895 rs9883073 rs11914 rs3799488 rs3891248 rs2066804 rs2972395 rs2940930 rs7732059 Poly-0009029 Poly-0009029 rs1858136 rs2972418 rs2972419 rs2940944 rs2972392 rs2940913 rs7735889 rs7712701 rs28943882 rs6873545 rs28943889 rs6878512 rs6897530 rs6179 rs2972780 rs6180 rs6413428 rs7579 rs405729 rs367836 rs543613 rs4986947 rs4619 rs2471551 rs4986938 rs3020450
4151bp 3' of STP T>C -25382A>G IVS1+832A>G IVS1+1177A>C IVS1+1702A>G IVS1-10154G>T IVS1-7464A>G IVS7+309A>T IVS7-2751C>A IVS7-562A>T IVS10-175C>T IVS13-67A>G Ex15-547G>T 2548bp 3' of STP A>G 3702bp 3' of STP C>A Ex7+189T>G IVS6-4G>A IVS1-355T>A IVS21-8C>T -165670C>T -160465G>A -142504C>G -142290T>C -142290T>C N/A -82283T>C Ex2G>A IVS1+65085C>A Ex2A>C -66359G>T IVS1-3767A>G IVS2+4144A>C IVS2+29065C>T IVS3+2059C>T IVS2+16453T>C IVS3-21121C>T IVS3-21055C>T Ex6-61A>G IVS8+1229C>T Ex10+685A>C Ex5+710T>C Ex5+626C>T Ex7-31A>G Ex7+260C>A IVS6-134A>G IVS5+32C>T Ex4+111A>G IVS2-17G>C 38bp 3' of STP C>T -18598A>G
93
41160698 41180181 41181997 41182342 41182867 41195362 41198052 41209156 41212085 41214274 41217044 41219444 41221392 41223386 41224540 41624017 41624209 41968318 42051175 42373063 42378268 42396229 42396443 42396443 42408866 42456450 42456634 42461899 42468592 42472374 42534956 42542947 42567868 42604021 42618415 42640628 42640694 42672801 42687607 42691996 42773481 42773565 43701012 43701362 43701755 43707461 45304115 45328495 45699569 45768055
CYP1A1-78 CYP1A1-15 CYP1A1-14 CYP1A1-91 CYP1A1-81 CCR3-01 CCR3-05 GPX2-07 GPX2-19 GPX2-13 GPX2-14 GPX2-09 GPX2-16 GPX2-17 GPX2-21 GPX2-02 GPX2-18 RAB15-04 RAB15-03 RAB15-02 CFH-01 CFH-06 CFH-07 CFH-03 CFH-05 CCNA2-12 CCNA2-06 CCNA2-01 HUS1-01 HUS1-05 IL2-03 IL2-01 CDC25A-04 GPX1-06 GPX1-28 TCTA-04 TCTA-02 NICN1-01 CTSH-01 NOS3-34 NOS3-01 CDK5-08 CDK5-16 SLC4A2-01 SLC4A2-02 SLC4A2-04 CASP10-02 LMOD1-03 CASP8-06 CASP8-07
rs2198843 rs4646421 rs2606345 rs17861115 rs2472299 rs4987053 rs3091312 Poly-0014684 rs4902345 rs10133054 rs10133290 rs17880380 rs12172810 rs2071566 rs2737844 rs1800669 rs2296327 rs3825644 rs3742599 rs2277502 rs800292 rs1329423 rs2300430 rs2274700 rs1065489 rs3217773 rs1396080 rs769242 rs1056663 rs2242478 rs2069763 rs2069762 rs936426 rs1800668 rs3448 rs6784820 rs6997 rs8897 rs3129 rs3918226 rs1799983 rs2069456 rs1549760 rs6464120 rs10245199 rs13240966 rs3900115 rs2820312 rs2349070 rs2293554
11599bp 3' of STP C>G IVS1-728C>T IVS1+606T>G -9893G>A -17961T>C Ex3+62T>C 754bp 3' of STP A>T 2680bp 3' of STP T>A 2301bp 3' of STP G>A 2089bp 3' of STP G>C 1763bp 3' of STP T>G 1306bp 3' of STP G>A 823bp 3' of STP G>A IVS1-444C>T IVS1+714C>T IVS1+19T>A -6793G>A 3715bp 3' of STP T>G 3306bp 3' of STP C>A 2936bp 3' of STP A>G Ex2-61G>A IVS4-219T>C IVS7+1346T>C Ex10+83G>A Ex18+26G>T IVS7+78C>T IVS5+73A>C Ex3+30A>G Ex8+74G>A IVS3+25G>A Ex2-34G>T Ex2T>G IVS9+521T>C Ex1+35C>T -39303A>G IVS2+321A>G Ex3-75T>C Ex7-28G>A Ex12-109G>A IVS1-665C>T Ex8-63G>T IVS7+11A>C -903G>A IVS1+549A>G IVS1-530A>G IVS1-194C>G Ex3-171A>G Ex2+623T>C IVS4-876A>C IVS5+73T>G
94
45791548 45806510 45807494 45815650 45823718 46246704 46248476 46403278 46403657 46403869 46404195 46404652 46405135 46406753 46408262 46408957 46410300 46411252 46411661 46412031 47051172 47055326 47064652 47091886 47118713 47234252 47235585 47237348 47376947 47389981 47872613 47873111 48155257 49335761 49336755 49390868 49393838 49400411 50004535 50051985 50058257 50114701 50117932 50119491 50120576 50120912 52260093 52278196 52339724 52341003
CASP8-22 FZD7-17 FZD7-06 FZD7-10 FZD7-20 FZD7-15 FZD7-16 MTHFD2-01 RGS6-04 RGS6-02 RGS6-05 EGFR-05 EGFR-03 EGFR-04 CTLA4-16 CTLA4-19 CTLA4-17 CTLA4-10 CTLA4-25 CTLA4-01 CTLA4-07 VCAM1-02 VCAM1-38 VCAM1-05 ESR1-31 ESR1-14 ESR1-34 ESR1-01 ESR1-08 ESR1-17 ESR1-07 ESR1-13 ESR1-30 FOS-02 FOS-06 FOS-08 RGS17-01 RGS17-03 OPRM1-01 OPRM1-02 OPRM1-23 OPRM1-03 GSTZ1-02 GSTZ1-03 BARD1-18 BARD1-04 BARD1-11 BARD1-22 BARD1-02 IL12A-09
rs1035142 rs1207955 E7045_223 rs13034206 rs4673222 E7064_389 rs12474408 rs1667627 rs3784058 rs2238284 rs2238280 rs2017000 rs1140475 rs2293347 rs11571315 rs4553808 rs11571316 rs11571317 rs5742909 rs231775 rs3087243 rs1041163 rs2392221 rs3176879 rs488133 rs2071454 rs9340770 rs2077647 rs1801132 rs2273206 rs2228480 rs3798577 rs3798758 rs7101 rs1063169 rs4645856 rs2295231 rs3870366 rs1799971 rs607759 rs9282821 rs562859 rs7972 rs1046428 rs5031011 rs2070094 rs2229571 rs2070096 rs1129804 rs582537
1760bp 3' of STP G>T -2321G>A -2082G>A Ex1-1926C>T Ex1-1251G>A 2569bp 3' of STP G>A 2710bp 3' of STP A>G IVS1+3323T>C IVS1+12785G>A IVS1-11668C>A IVS1-5967T>C IVS21+96A>G Ex25+8C>T Ex27+36C>T -1764T>C>G -1660A>G -1576G>A -657C>T -318C>T Ex1-61A>G 1383bp 3' of STP A>G -1591T>C IVS3-7C>T Ex9+149G>A Ex2T>C -2223G>T -945A>C Ex1+392T>C Ex4-122G>C IVS6+52G>T Ex8+229G>A Ex8+1264T>C Ex8+1988C>A Ex1+96C>T IVS2-145G>T IVS2-5C>T IVS1-170T>C IVS1+12492C>T Ex1-173A>G IVS1+11468C>T IVS3+1768A>C IVS3+1966T>C Ex5-12G>A Ex7+29T>C IVS6+14T>C Ex6-50G>A Ex4-181G>C Ex4-262G>C Ex1+44C>G IVS2-701A>C
95
52362494 53106465 53106704 53110651 53111326 53113081 53113222 53245129 53412557 53419574 53425275 54635882 54659689 54662188 54940317 54940421 54940505 54941424 54941763 54942130 54948335 55003218 55009566 55023220 56280294 56281674 56282952 56283927 56420372 56537161 56574945 56575980 56576704 56745379 56746871 56747011 57520198 57594617 58515647 58527287 58569225 58569423 58792990 58794036 65841608 65841671 65854880 65854961 65883738 66205256
IL15-06 IL15-01 IL15-07 IL15-10 IL15-02 XRCC5-14 XRCC5-17 XRCC5-19 XRCC5-02 XRCC5-12 IGFBP2-26 IGFBP2-29 IGFBP2-25 IGFBP5-05 IGFBP5-10 IL8RA-04 MYNN-01 FBXW7-01 FBXW7-05 FBXW7-44 FBXW7-04 FBXW7-02 IRS1-04 IRS1-08 IRS1-03 TLR2-06 TLR2-04 TLR2-05 XRCC3-03 XRCC3-04 AKT1-15 MASP1-21 MASP1-42 MASP1-01 MASP1-48 MASP1-53 MASP1-50 MASP1-45 MASP1-44 MASP1-46 MASP1-49 MASP1-47 MASP1-52 MASP1-43 MASP1-54 MASP1-07 MASP1-09 BCL6-07 BCL6-09 BCL6-06
rs1493013 rs2254514 rs2857261 rs1057972 rs10833 rs828910 rs828702 rs207916 rs1051685 rs2440 rs1106037 rs2372848 rs2270360 rs2241193 rs1978346 rs2854386 rs1317082 rs2676330 rs2714804 rs2676329 rs2714805 rs2292743 rs1366757 rs9282766 rs1801278 rs4696480 rs3804099 rs3804100 rs1799796 rs1799794 rs2498799 rs3733001 rs1001073 rs3774268 rs696405 rs710459 rs698090 rs3105782 rs1533593 rs3864099 rs698079 rs4376034 rs698105 rs13094773 rs7609662 rs12635264 rs13089330 rs1474326 rs3774309 rs1464645
Ex3+163C>T Ex3-92T>C IVS3+8A>G Ex9-181A>T Ex9-66T>C IVS2-711A>G IVS9+1081A>G IVS17+789A>G Ex22+466A>G Ex22-238G>A -13556C>T IVS1+5424A>G IVS1-294A>C IVS1+4949A>G -1968C>T 5661bp 3' of STP C>G IVS4+236A>G IVS4+2575A>G IVS3+230T>C IVS1-1417A>G IVS1-20897G>A -144T>A IVS1+12345G>C IVS1+4357G>A Ex1-840G>A -16933A>T Ex2+613T>C Ex2-1122T>C IVS7-14A>G Ex2+2A>G Ex10+24G>A IVS15-34G>A IVS12-397T>C Ex11+32C>T IVS10-1868A>C IVS9+790C>T IVS8-2891G>A IVS5-193T>C IVS5-1224A>G IVS2+4675A>C IVS2+3841T>G IVS2+3257T>C IVS2+118A>G IVS1-339A>G IVS1+2718G>A>T IVS1+2650G>A>C -849C>T IVS10+202G>T IVS7-511C>T IVS7-571G>A
96
67135593 67135669 67135768 67149563 67149678 67186444 67202894 67236976 67279792 67280182 67694106 67713528 67734402 67763629 67770883 69236918 75992743 77760638 77766095 77770526 77790006 77828231 77856775 77864763 77869959 79102257 79119787 79120540 85165680 85179020 86240939 93434114 93439863 93449482 93451381 93455640 93459458 93466454 93467485 93494096 93494930 93495514 93498653 93499341 93501856 93501924 93505428 93937685 93940355 93940415
BCL6-11 BCL6-05 TP73L-03 TP73L-17 TP73L-15 TP73L-16 TP73L-13 TP73L-28 TP73L-26 TP73L-52 TP73L-46 TP73L-47
rs3774306 rs3172469 rs17514215 rs7653848 rs6789961 rs6790167 rs9840360 rs7613791 rs1345186 E4057_169 E4064_458 E4065_308
IVS7-643A>G IVS1+4110A>C IVS5+34T>G IVS7+121C>T IVS8-22A>G IVS9+79A>G IVS10+41A>G IVS10-4859C>T IVS10-23T>C Ex14+342C>T Ex14-559G>A Ex14-430C>T
97
93940487 93954246 96077399 96081010 96082249 96082432 96085983 96094482 96099318 96107494 96109665 96109794
Statistical analysis Demographic characteristics including age, gender, and race were compared between the original and validation studies using Student’s T-test (for age) and two-sample tests of proportions (for AE status, gender, and race). Allele frequencies were estimated from the total number of copies of individual alleles divided by the number of all alleles in the sample, and they were compared between the two studies using a two-sample test of proportions. Deviations in frequencies from Hardy-Weinburg Equilibrium were evaluated using the exact test described in Wigginton et al. [12]. In the original study, potential associations were tested between each of the 1442 SNPs passing quality control filters and the occurrence of adverse events using logistic regression. For each SNP in the initial sample, we recorded the odds ratio estimate and p-value of the likelihood ratio test for a univariate allelic logistic model. No correction for multiple comparisons was made in our initial sample, because we reserved the validation sample for the purpose of weeding out false-positives. In the validation sample, we tested only those SNPs having an AE-associated p-value ≤ 0.05 in the original sample. We considered a significant SNP association in the initial sample to have replicated if it met the following criteria in the validation sample:
an odds ratio that consistently
associated AE risk with the same genotypes and a p-value ≤ 0.10. The more liberal p-value criterion was chosen to maintain power in the face of the smaller size of the validation sample compared to that of the original sample. While this
98
approach may increase the chances of false-positive results, the trade-off in favor of power is appropriate given the exploratory scope of the current study. Potential patterns of linkage disequilibrium (LD) between replicated SNPs on the same chromosome were assessed using Haploview [13]. Haplotypes were estimated for SNPs in high LD (r2 > 0.90) using the iterative approach described in Lake et al. [14].
The resulting haplotypes were tested for
association with AEs using univariate logistic models. Statistical analyses were performed using R version 2.2.1, Stata version 9, and Haploview version 3.32 [13,15-17].
Results
Demographic characteristics of subjects included in genetic analysis In both studies, all participants were invited to donate genetic samples. In the original study, of the 148 participants enrolled, a total of 96 individuals consented for the genetic substudy. Of those 96 subjects with genetic data, 27 experienced adverse events relating to immunization. Since systemic AEs were the outcome of interest, of the 27 individuals experiencing an AE, those 11 reporting only a localized rash near the inoculation site were left out, and the other 69 reporting no AEs were used as controls. In the validation study, 102 total healthy adults were enrolled and 90 gave consent for genotyping. Of the 90 individuals with genetic data, 46 were vaccine-naïve and 44 were vaccine-
99
experienced. Of the naïve individuals, 24 experienced systemic AEs, and of the experienced individuals, only 10 suffered systemic AEs. There was a difference in vaccination history status between the two studies, with the original study including only vaccine-naïve participants and the validation study including both naïve and experienced individuals.
Pooling
vaccination history status, there was a statistically significant difference in mean age between the two studies (p < 0.001). However, when only the vaccine-naïve individuals in the validation study are compared to the original study sample, the mean difference in age was only one year (p = 0.15), indicating that the inclusion of vaccine-experienced individuals accounts for the age differential. Because age stratification can have a profound effect on immune function (especially for the inflammatory responses thought to be important in AEs) [18-20], only the vaccine-naïve individuals in the validation study were considered in all subsequent analyses. Table 2 summarizes age, race, gender, and AE status decompositions of both studies.
Table 2 also describes the results of the
demographic comparisons between the original and validation studies— considering only vaccine-naïve subjects. As the table indicates, there was no statistical difference in age, gender, or race between the two vaccine-naïve study samples. In the original study, 40 (47%) individuals were male, 84 (99%) were Caucasian and 1 (1%) was Asian. In the validation study, 27 (59%) individuals were male, 44 (96%) were Caucasian, 1 (2%) was African American, and 1 (2%) was Asian.
100
Table 2. Summary of AE status, age, gender, and race for both studies. Only vaccine-naïve subjects are considered. Genetic (SNP) Data
Dataset/Study Original (N = 85) Validation (N = 46) P-value of Difference
c
a
AE/nonAE
Age
Gender (M/F)
Race (W/B/A)
16/69
23.2 (3.9)
40/45
84/0/1
24/22
24.2 (3.8)
27/19
44/1/1
< 0.01
0.15
0.20
0.25
b
a
Mean (Standard Deviation) W = “White”, B = “Black”, A = “Asian” c Two-sided p-value for t-test (Age) or two-sample test of proportions (AE status, Gender, Race) b
Genetic associations with adverse events Table 3 lists all SNPs with an AE-associated p-value ≤ 0.05 in the original sample. The significant genetic association results from the original study that replicated in the validation study are listed in Table 4. Two SNPs in the IRF-1 gene, three SNPs in the IL-4 gene, and one SNP in the MTHFR gene met our significance criteria for association with the occurrence of systemic adverse events.
101
Table 3. List of all SNPs with an AE-associated p-value ≤ 0.05 in the original sample, organized according to location. SNP names are taken from http://snp500cancer.nci.nih.gov.
SNP Name
dbSNP ID (rs#)
SNP Region
SNP Location (Base Pair)
IGF1R-26 SRA1-03 PIN1-21 SLC6A3-14 CDKN1C-09 EPHX1-01 GATA3-46 SLC39A2-07 TXNRD2-83 MBL2-03 BLM-02 BLM-25 MTHFR-02 MPDU1-01 SAT2-03 TP53-14 GDF15-02 GGH-01 AHR-19 CYP1B1-18 TSG101-40 TSG101-07 TSG101-36 AURKA-02 HSD17B4-19 HSD17B4-21 LTA-05 CDH1-06 CTH-03 NFKB1-14 CASR-06 IRF1-05 IRF1-03 IL4-03 IL4-11 IL4-10 CFH-03 FZD7-20
rs3743259 rs801459 rs889162 rs460700 rs431222 rs2234922 rs10905277 rs2149666 rs9306230 rs5030737 rs2238335 rs16944831 rs1801133 rs4227 rs858520 rs1614984 rs1059369 rs719235 rs7796976 rs10175368 rs2279900 rs12574333 rs2292179 rs1047972 rs384346 rs7737181 rs3093546 rs9282650 rs663649 rs230547 rs2270916 rs839 rs9282763 rs2070874 rs2243268 rs2243290 rs2274700 rs4673222
IVS5+311A>G NC_A>C IVS3+2592T>C IVS4+2610A>G -1679G>A Ex4+52A>G -250A>G IVS2-119G>T IVS1+1202T>C Ex1-34C>T IVS1-253G>C IVS16-479C>T Ex5+79C>T Ex7-334G>T Ex4-11G>A 21226bp 3' of STP C>T Ex2-136T>A -353C>A Ex1+185A>G -5329G>A IVS9+18G>A IVS4+10C>A -182T>C Ex5+127A>G -18796A>T IVS8+4959C>G Ex1+50A>G IVS2-25933A>T IVS7-583G>T IVS23-1330T>C IVS6+16C>T Ex10-347C>T IVS6-68G>A Ex1-168C>T IVS2-1443A>C IVS3-9A>C Ex10+83G>A Ex1-1251G>A
893012 1096550 1214718 1419969 1695640 2202600 2460264 2467996 3080172 3082397 6255893 6306468 6393745 7088525 7127620 7168801 9759943 15805034 16704367 17123794 17290400 17323456 17335787 20014371 21184487 21234688 22398393 22423839 24716576 28030988 28496245 34234139 34237146 34424723 34428976 34433182 47091886 53111326
102
Table 4. Significant genetic associations consistent across both studies. Original Study Gene IRF-1
IL-4 MTHFR a b
SNP (rs#)
SNP Location (Base Pair)
Chromosomal Location
rs9282763 rs839 rs2070874 rs2243268 rs2243290 rs1801133
34237146 34234139 34424723 34428976 34433182 6393745
5q31.1 5q31.1 5q31.1 5q31.1 5q31.1 1p36.3
a
Odds Ratio (95% C.I.)
3.2 (1.1 - 9.8) 3.2 (1.1 - 9.8) 2.4 (1.0 - 5.7) 2.6 (1.1 - 6.0) 2.4 (1.1 - 5.4) 2.3 (1.1 - 5.2)
b
p-value 2 (χ ) 0.03 0.03 0.05 0.03 0.04 0.04
Validation Study a
Odds Ratio (95% C.I.)
3.0 (1.1 - 8.3) 3.0 (1.1 - 8.3) 3.8 (0.9 - 16.6) 3.8 (0.9 - 16.6) 3.8 (0.9 - 16.6) 4.1 (1.4 - 11.4)
b
p-value 2 (χ ) 0.03 0.03 0.06 0.06 0.06 < 0.01
Estimated odds ratio (95% Confidence Interval) Likelihood ratio chi-square test with one degree of freedom Only those 38 SNPs (within 31 genes) that showed significant
associations in the original study were tested for potential associations in the validation study. The statistical results that replicated in the second study are shown alongside those from the original study in Table 4. The SNPs in IRF-1, IL4, and MTHFR met our statistical significance criterion in the validation sample (p = 0.03, p = 0.06, and p < 0.01, respectively), and maintained an AE risk effect associated with the variant genotypes. While the SNPs in the IL-4 gene were not significant at a strict p ≤ 0.05 level in the smaller validation set, these SNPs had p-values just beyond the traditional threshold. Considering the reduced size of the validation sample and the fact that the AE risk associated with variant genotypes was consistent across studies, these IL-4 SNPs warrant further study. The distribution of common versus variant genotypes at the replicated candidate SNPs is given in Table 5.
103
Table 5. Distribution of common versus variant (pooled) genotypes at the replicated candidate SNPs.
Gene
SNP (rs #)
SNP Location (Base Pair)
rs9282763
34237146
rs839
34234139
rs2070874
34424723
rs2243268
34428976
rs2243290
34433182
rs1801133
6393745
IRF-1
IL-4
MTHFR
Genotype
Original Study Sample Count (Percent)
Validation Study Sample Count (Percent)
AA AG GG GG AG AA CC CT TT AA AC CC CC AC AA CC CT TT
39 (46%) 43 (51%) 3 (4%) 39 (46%) 43 (51%) 3 (4%) 52 (62%) 28 (33%) 4 (5%) 52 (62%) 27 (32%) 5 (6%) 53 (62%) 26 (31%) 6 (7%) 36 (42%) 39 (46%) 10 (12%)
17 (37%) 24 (52%) 5 (11%) 17 (37%) 24 (52%) 5 (11%) 34 (74%) 12 (26%) 0 (0%) 34 (74%) 12 (26%) 0 (0%) 34 (74%) 12 (26%) 0 (0%) 18 (39%) 21 (46%) 7 (15%)
It is important to note that several of the significant SNPs (those located in the IRF-1 and IL-4 genes) were located in the same chromosomal region (5q31.1), suggesting an indirect association with one or more functional variants in that region. Because of the close physical proximity of the associated variants in those two genes, Haploview [13] software was used to look at the patterns of linkage disequilibrium (LD) among those variants in each sample.
Figure 1
shows that the LD plots for SNPs in these two genes follow the same pattern in each study sample.
While there is strong LD between SNPs within the two
genes, there is no evidence for LD between the two genes, indicating that the associations for each gene are statistically separate signals.
104
Figure 1. Haploview plot of SNPs at chromosome 5q31.1. Panel A is the plot for the original study, and panel B is the plot for the validation study. Dark squares are indicative of strong evidence for LD between the pairwise markers (r2 > 0.90), whereas lighter squares indicate no evidence (r2 < 0.01 for white squares) or very weak evidence (r2 < 0.10 for light gray squares) for LD. The same two LD blocks, separated by 190 Kb, are apparent in both studies, encompassing SNPs in IRF-1 (rs839 and rs9282763) or IL-4 (rs2070874, rs2243268, and rs2243290).
IRF-1
IL-4
IRF-1
A
IL-4
B
It has been demonstrated that this region of chromosome 5q31 contains discrete haplotype blocks [21]. Therefore, separate haplotypes were estimated for significant AE-associated SNPs in IRF-1 (rs839 and rs9282763) and IL-4 (rs2070874, rs2243268, rs2243290).
In both study samples, two IRF-1
haplotypes accounted for all subjects. The common IRF-1 haplotype listed in Table 6 represented 71% of the original sample and 63% of the validation sample. The rare IRF-1 haplotype was significantly associated with AEs in both samples (p = 0.03). Across both studies, two different three-SNP haplotypes in
105
IL-4 accounted for 99% of subjects. The common IL-4 haplotype listed in Table 6 represented 78% of the original sample and 87% of the validation sample. The rare IL-4 haplotype was significantly associated with risk of AEs in the original sample (p = 0.05) and marginally associated with risk of AEs in the validation sample (p = 0.06).
Table 6. Haplotypes estimated for significant AE-associated SNPs in IRF-1 and IL-4. Original Study c
Haplotype
Gene a
IRF-1 IL-4
Baseline b Risk a Baseline b Risk
A-G G-A C-A-C T-C-A
Odds Ratio (95% C.I.)
d
p-value 2 (χ )
Validation Study c
Odds Ratio (95% C.I.)
d
p-value 2 (χ )
3.2 (1.0 - 10.2)
0.03
3.0 (1.0 - 9.0)
0.03
2.4 (1.0 - 5.7)
0.05
3.8 (1.0 - 14.4)
0.06
a
Most common haplotype considering 2 SNPs in IRF-1 (s839-rs9282763) or 3 SNPs in IL-4 (rs2070874-rs2243268-rs2243290) b Rare (variant) haplotype considering 2 SNPs in IRF-1 (s839-rs9282763) or 3 SNPs in IL-4 (rs2070874-rs2243268-rs2243290) c Estimated odds ratio comparing Risk haplotype to Baseline haplotype (95% Confidence Interval) d Likelihood ratio chi-square test with one degree of freedom
106
Discussion
Biological mechanisms contributing to adverse events While statistical association in two independent samples is a highly convincing result, it is the biological implications of such findings that are clinically relevant. These statistical results have strong biological plausibility and are in agreement with previous work on the topic of AEs following smallpox vaccination. The candidate genes validated in both studies include a major antiinflammatory cytokine (IL-4), an immunological transcription factor (IRF-1), and a metabolism gene previously associated with adverse reactions to a variety of pharmacologic agents (MTHFR).
Since the outcome of interest is the
aggregation of specific AEs, it is logical that more than one gene may be involved. These genes are all potentially involved in pathways that are in line with our previously hypothesized mechanism of adverse events involving excess stimulation of inflammatory pathways and the imbalance of tissue damage repair pathways. This model was developed from studies of circulating cytokines and relevant immunological effector cells [3-5]. For subjects experiencing adverse events, vaccination appears to trigger an acute inflammatory response akin to a delayed-type hypersensitivity reaction. Antigen presentation to Th1 cells in the dermis leads to the release of T-cell cytokines that trigger a cascade of cytokines and chemokines whose release enhances the inflammatory response by promoting the migration of monocytes into the lesion and their maturation into
107
macrophages and by further attracting T cells [22,23]. Taken together, these previous findings suggest that systemic adverse events following smallpox vaccination may be consistent with low-grade macrophage activation syndrome caused by virus replication and vigorous tissue injury and repair.
Relationship between genetic results and proposed model of adverse events The 5,10-methylenetetrahydrofolate reductase (MTHFR) gene is located on chromosome 1. A SNP in MTHFR (rs1801133) is strongly associated with AE risk in both datasets. This non-synonymous SNP in the fifth exonic segment of the gene causes an amino acid change from Alanine to Valine.
Functional
characterization of this SNP has demonstrated that it is thermolabile and affects both the quantity and activity of the MTHFR enzyme [24]. The
gene
product
catalyzes
the
conversion
of
5,10-
methylenetetrahydrofolate to 5-methyltetrahydrofolate, which is a cosubstrate for homocysteine remethylation to methionine.
Proper MTHFR function provides
pools of methyl groups that are crucial for the control of DNA synthesis and repair mechanisms [25]. It is a key enzyme in homocysteine metabolism, which plays a major role in regulating endothelial function. The MTHFR enzyme has been associated with many phenotypes, including
cardiovascular
function,
transplant
health,
toxicity
of
immunosuppressive drugs, and systemic inflammation [26-29]. Elevated plasma homocysteine levels stimulate endothelial inflammatory responses, which could contribute to systemic adverse events.
108
Alternatively, since vaccination elicits
immune responses involving the rapid proliferation of cells, demand for DNA synthesis metabolites would be elevated, and alterations in the level or activity of MTHFR enzyme may exert significant influence over this process. The Interleukin-4 (IL4) gene is located in a gene cluster on chromosome 5q31 that includes IL-13, IL-5, IRF-1, CSF-2, and IL-3. IL-4 has been found to be coordinately regulated with IL-13 and IL-5 by several long-range regulatory elements on the chromosome [30]. In addition to genetic polymorphisms, two alternatively spliced transcript variants of IL-4 that encode distinct isoforms have been discovered [31,32].
We found three SNPs in the IL-4 gene that are
significantly associated with AEs in both studies:
rs2070874 is a C>T
substitution in the first exonic segment, rs2243268 is a A>C substitution in the second intronic segment, and rs2243290 is a A>C substitution in the third intronic segment. Interleukin-4 encodes a pleiotropic cytokine produced by a variety of cells, including activated T cells and mast cells. The IL-4 cytokine is normally a major player in the activation of humoral immune responses, isotype switching to IgE, and suppression of Th1 (CTL) cell functions.
IL-4 is considered an anti-
inflammatory cytokine for its inhibition of monocyte and dendritic cell migration to inflamed tissue, as well as its promotion of Th2 effector pathways [33,34]. Naïve CD4+ T-cell differentiation away from the Th1 pathway renders them unable to activate macrophages. There is also evidence that IL-4 cytokine secretion by Tregulatory cells is associated with the inhibition of many inflammatory T-cell responses [35].
109
Upon immunological challenge by vaccination, the differentiation of naïve CD4+ T-cells into armed Th1 versus Th2 cells plays a vital role in determining whether the adaptive immune response will be dominated by humoral effectors or macrophage activation [35].
Thus, genetic polymorphisms related to
inappropriate regulation of IL-4 expression and/or activity of IL-4 cytokine may over-stimulate inflammatory responses—leading to the development of AEs. IL-4 dysregulation may also play a role in AEs resulting from the inappropriate clearance of apoptotic immune effector cells after infection, as this function is normally carried out by macrophages. The Interferon Regulatory Factor-1 (IRF-1) gene is part of the immunological gene cluster on chromosome 5q31. We found two SNPs in the IRF-1 gene that are significantly associated with AEs in both study samples: rs9282763 is an A>G substitution in the sixth intronic segment and rs839 is a G>A substitution in the tenth exonic segment.
The IRF-1 locus was initially
mapped as a tumor suppressor, having genetic abnormalities associated with leukemia, myelodysplasia, and other cancers [36]. The IRF-1 gene encodes the transcription factor Interferon Regulatory Factor-1, a member of the interferon regulatory transcription factor (IRF) family. The IRF family regulates interferons and interferon-inducible genes.
Many
viruses use IRFs to evade host immune responses by binding to cellular IRFs and blocking transcriptional activation of IRF targets [37].
IRF-1 activates
transcription of the Type I interferons alpha and beta as well as genes induced by
110
the Type II interferon gamma [38]. Type I interferon production by virus-infected cells enhances CTL and macrophage activity. Polymorphisms in the gene coding for a transcription factor with such farreaching effects as IRF-1 could have profound effects on the proper immune response and clearance of vaccinia virus.
Hyperactive IRF-1 may push
macrophage activity beyond the threshold of AE development. Hyperactive IRF1 may also prolong the life of immune cells that should be cleared following infection, protracting the period of inflammation and leading to AEs. Although the SNPs identified in IRF-1 and IL-4 do not change amino acids in the encoded proteins, recent evidence suggests that synonymous SNPs may exert functional influence over protein abundance [39,40]. Thus, the fact that multiple SNPs in high LD were identified in regions of IRF-1 and IL-4 presents three hypotheses for functional consequences of these SNPs. In one scenario, these SNPs are evidence of indirect association—meaning that the functional variant lies somewhere within the regions of LD defined in these two genes. In another scenario, one of the candidate polymorphisms identified here is the relevant variant; however, for these data, the LD between SNPs is too high to identify which one is functional. Finally, accumulated variation of the haplotypes defined within these genes contributes to alterations in protein levels by altering transcript stability or transcriptional rate.
111
Summary and future directions These data present the rare opportunity to study two independent cohorts of smallpox vaccinées relating genetic factors to the occurrence of postvaccination adverse events. Statistical analysis of the original study revealed potentially interesting associations between SNPs in biologically interesting candidate genes. Of the AE-associated genes identified in the original study, three replicated in an independent validation cohort. Genetic association studies are notorious for their failure to replicate, and validation studies are the epidemiological “gold standard” for reducing the risk of false positive findings. We avoid multiple testing issues by testing only the most promising results in the validation sample. Therefore, while all SNPs were tested in the original study, only those SNPs significantly associated with AEs were tested in the validation cohort. The validation of SNPs in three genes across both studies and their biologically viable connection with AEs lends credence to the reproducibility of these associations. The results of this study demonstrate the importance and utility of validation in genetic studies of complex phenotypes.
As with any statistical
association, follow-up studies are needed to identify the particular genetic susceptibility
variants
and
examine
the
polymorphisms in the AE-associated genes.
functional
consequences
of
Since we found multiple AE-
associated SNPs in regions of IL-4 and IRF-1, focused studies should be undertaken to characterize the genetic variability in these candidate regions. While the association of AEs with a non-synonymous polymorphism in the gene
112
for MTHFR points toward functional significance of this SNP, deep resequencing should determine whether this is indeed the case. For all three candidate genes, functional studies are needed to connect genetic polymorphisms to variability in our hypothesized etiological pathways.
113
Acknowledgements
This work was supported by the National Institutes of Health (NIH)/National Institute of Allergy and Infectious Diseases (NIAID), Vaccine Trials and Evaluation Unit (contract N01-AI-25462, study DMID 02-054); NIH/NIAID (grants K25-AI-064625, R21-AI-59365, and R01-AI-59694); and NIH (GM62758).
References
1.
Kemper AR, Davis MM, Freed GL: Expected adverse events in a mass smallpox vaccination campaign. Eff Clin Pract 2002, 5: 84-90.
2.
Seet BT, Johnston JB, Brunetti CR, Barrett JW, Everett H, Cameron C et al.: Poxviruses and immune evasion. Annu Rev Immunol 2003, 21: 377423.
3.
McKinney BA, Reif DM, Rock MT, Edwards KM, Kingsmore SF, Moore JH et al.: Cytokine Expression Patterns Associated with Systemic Adverse Events following Smallpox Immunization. J Infect Dis 2006, 194: 444-453.
4.
Rock MT, Yoder SM, Talbot TR, Edwards KM, Crowe JE, Jr.: Adverse events after smallpox immunizations are associated with alterations in systemic cytokine levels. J Infect Dis 2004, 189: 1401-1410.
5.
Rock MT, Yoder SM, Wright PF, Talbot TR, Edwards KM, Crowe JE, Jr.: Differential regulation of granzyme and perforin in effector and memory T cells following smallpox immunization. J Immunol 2005, 174: 3757-3764.
6.
Rock MT, Yoder SM, Talbot TR, Edwards KM, Crowe JE, Jr.: Cellular Immune Responses to Diluted and Undiluted Aventis Pasteur Smallpox Vaccine. J Infect Dis 2006, 194: 435-443.
7.
Shaklee JF, Talbot TR, Muldowney JA, III, Vaughan DE, Butler J, House F et al.: Smallpox vaccination does not elevate systemic levels of prothrombotic proteins associated with ischemic cardiac events. J Infect Dis 2005, 191: 724-730. 114
8.
Talbot TR, Stapleton JT, Brady RC, Winokur PL, Bernstein DI, Germanson T et al.: Vaccination success rate and reaction profile with diluted and undiluted smallpox vaccine: a randomized controlled trial. JAMA 2004, 292: 1205-1212.
9.
Hirschhorn JN, Lohmueller K, Byrne E, Hirschhorn K: A comprehensive review of genetic association studies. Genet Med 2002, 4: 45-61.
10.
Lohmueller KE, Pearce CL, Pike M, Lander ES, Hirschhorn JN: Metaanalysis of genetic association studies supports a contribution of common variants to susceptibility to common disease. Nat Genet 2003, 33: 177182.
11.
Talbot TR, Bredenberg HK, Smith M, LaFleur BJ, Boyd A, Edwards KM: Focal and generalized folliculitis following smallpox vaccination among vaccinia-naive recipients. JAMA 2003, 289: 3290-3294.
12.
Wigginton JE, Cutler DJ, Abecasis GR: A note on exact tests of HardyWeinberg equilibrium. Am J Hum Genet 2005, 76: 887-893.
13.
Barrett JC, Fry B, Maller J, Daly MJ: Haploview: analysis and visualization of LD and haplotype maps. Bioinformatics 2005, 21: 263-265.
14.
Lake SL, Lyon H, Tantisira K, Silverman EK, Weiss ST, Laird NM et al.: Estimation and tests of haplotype-environment interaction when linkage phase is ambiguous. Hum Hered 2003, 55: 56-65.
15.
Ihaka R, Gentleman R: R: A Language for Data Analysis and Graphics. Journal of Computational and Graphical Statistics 1996, 5: 299-314.
16.
R Development Core Team. R: A Language and Environment for Statistical Computing. R Foundation for Statistical Computing. http://www.R-project.org. 2006. Vienna, Austria.
17.
StataCorp.. Stata Statistical Software. [Release 9]. 2005. College Station, TX, StataCorp LP.
18.
Huang H, Patel DD, Manton KG: The immune system in aging: roles of cytokines, T cells and NK cells. Front Biosci 2005, 10: 192-215.
19.
Larbi A, Douziech N, Fortin C, Linteau A, Dupuis G, Fulop T, Jr.: The role of the MAPK pathway alterations in GM-CSF modulated human neutrophil apoptosis with aging. Immun Ageing 2005, 2: 6.
20.
Moroni F, Di Paolo ML, Rigo A, Cipriano C, Giacconi R, Recchioni R et al.: Interrelationship among neutrophil efficiency, inflammation, antioxidant activity and zinc pool in very old age. Biogerontology 2005, 6: 271-281.
115
21.
Daly MJ, Rioux JD, Schaffner SF, Hudson TJ, Lander ES: High-resolution haplotype structure in the human genome. Nat Genet 2001, 29: 229-232.
22.
Fong TA, Mosmann TR: The role of IFN-gamma in delayed-type hypersensitivity mediated by Th1 clones. J Immunol 1989, 143: 28872893.
23.
Grom AA, Passo M: Macrophage activation syndrome in systemic juvenile rheumatoid arthritis. J Pediatr 1996, 129: 630-632.
24.
Martin YN, Salavaggione OE, Eckloff BW, Wieben ED, Schaid DJ, Weinshilboum RM: Human methylenetetrahydrofolate reductase pharmacogenomics: gene resequencing and functional genomics. Pharmacogenet Genomics 2006, 16: 265-277.
25.
Friso S, Girelli D, Trabetti E, Olivieri O, Guarini P, Pignatti PF et al.: The MTHFR 1298A>C polymorphism and genomic DNA methylation in human lymphocytes. Cancer Epidemiol Biomarkers Prev 2005, 14: 938-943.
26.
Dedoussis GV, Panagiotakos DB, Pitsavos C, Chrysohoou C, Skoumas J, Choumerianou D et al.: An association between the methylenetetrahydrofolate reductase (MTHFR) C677T mutation and inflammation markers related to cardiovascular disease. Int J Cardiol 2005, 100: 409-414.
27.
Lim U, Peng K, Shane B, Stover PJ, Litonjua AA, Weiss ST et al.: Polymorphisms in cytoplasmic serine hydroxymethyltransferase and methylenetetrahydrofolate reductase affect the risk of cardiovascular disease in men. J Nutr 2005, 135: 1989-1994.
28.
Murphy N, Diviney M, Szer J, Bardy P, Grigg A, Hoyt R et al.: Donor methylenetetrahydrofolate reductase genotype is associated with graftversus-host disease in hematopoietic stem cell transplant patients treated with methotrexate. Bone Marrow Transplant 2006, 37: 773-779.
29.
Urano W, Taniguchi A, Yamanaka H, Tanaka E, Nakajima H, Matsuda Y et al.: Polymorphisms in the methylenetetrahydrofolate reductase gene were associated with both the efficacy and the toxicity of methotrexate used for the treatment of rheumatoid arthritis, as evidenced by single locus and haplotype analyses. Pharmacogenetics 2002, 12: 183-190.
30.
Loots GG, Locksley RM, Blankespoor CM, Wang ZE, Miller W, Rubin EM et al.: Identification of a coordinate regulator of interleukins 4, 13, and 5 by cross-species sequence comparisons. Science 2000, 288: 136-140.
31.
Klein SC, Golverdingen JG, van Wichen DF, Bouwens AG, Stuij I, Tilanus MG et al.: Expression of two interleukin 4 mRNA isoforms in B lymphoid cells. Cell Immunol 1996, 167: 259-268. 116
32.
Sorg RV, Enczmann J, Sorg UR, Schneider EM, Wernet P: Identification of an alternatively spliced transcript of human interleukin-4 lacking the sequence encoded by exon 2. Exp Hematol 1993, 21: 560-563.
33.
Mangan DF, Robertson B, Wahl SM: IL-4 enhances programmed cell death (apoptosis) in stimulated human monocytes. J Immunol 1992, 148: 1812-1816.
34.
Soruri A, Kiafard Z, Dettmer C, Riggert J, Kohl J, Zwirner J: IL-4 downregulates anaphylatoxin receptors in monocytes and dendritic cells and impairs anaphylatoxin-induced migration in vivo. J Immunol 2003, 170: 3306-3314.
35.
Janeway CA, Travers P, Walport M, Shlomchik MJ: Immunobiology: The Immune System in Health and Disease, 5th edn. New York, New York: Garland Publishing; 2001.
36.
Willman CL, Sever CE, Pallavicini MG, Harada H, Tanaka N, Slovak ML et al.: Deletion of IRF-1, mapping to chromosome 5q31.1, in human leukemia and preleukemic myelodysplasia. Science 1993, 259: 968-971.
37.
Goodbourn S, Didcock L, Randall RE: Interferons: cell signalling, immune modulation, antiviral response and virus countermeasures. J Gen Virol 2000, 81: 2341-2364.
38.
Harada H, Fujita T, Miyamoto M, Kimura Y, Maruyama M, Furia A et al.: Structurally similar but functionally distinct factors, IRF-1 and IRF-2, bind to the same regulatory elements of IFN and IFN-inducible genes. Cell 1989, 58: 729-739.
39.
Crawford DC, Nickerson DA: Definition and clinical importance of haplotypes. Annu Rev Med 2005, 56: 303-320.
40.
Duan J, Wainwright MS, Comeron JM, Saitou N, Sanders AR, Gelernter J et al.: Synonymous mutations in the human dopamine receptor D2 (DRD2) affect mRNA stability and synthesis of the receptor. Hum Mol Genet 2003, 12: 205-216.
117
CHAPTER V
FEATURE SELECTION USING RANDOM FORESTS FOR THE INTEGRATED ANALYSIS OF MULTIPLE SIMULATED DATA TYPES
Complex clinical phenotypes arise from the concerted interactions among the myriad components of a biological system.
Therefore, comprehensive
models can only be developed through the integrated study of multiple types of experimental data gathered from the system in question. The Random Forests™ (RF) method is adept at identifying relevant features having only slight main effects in high-dimensional data.
This method is well-suited to integrated
analysis, as relevant attributes may be selected from categorical or continuous data, and there may be interactions across data types. RF is a natural approach for studying gene-gene, gene-protein, or protein-protein interactions because importance scores for particular attributes take interactions into account. Thus, Random Forests is a promising solution to the analysis challenge posed by highdimensional datasets including interactions among attributes of different types. In this study, we characterize the performance of RF on a range of simulated genetic and/or proteomic datasets.
We compare the performance of RF in
identifying relevant attributes when given genetic data alone, proteomic data alone, or a combined dataset of genetic plus proteomic data. Our results indicate that utilizing multiple data types is beneficial when the disease model is complex and the phenotypic outcome-associated data type is unknown. The results of
118
this study also show that RF is adept at identifying relevant features in highdimensional data with small main effects and low heritability.
119
Introduction
Adverse drug reaction is one of the leading causes of hospitalizations in the Unites States. For example, in 1994 alone, adverse drug reactions accounted for more than 2.2 million serious hospitalizations [1]. Currently, there is no definitive way to determine how a person will respond to a medication—limiting pharmaceutical development to a "one size fits all" system. This system allows for the development of drugs to which the "typical" patient will respond, but one size does not necessarily fit all, sometimes with dire consequences. The need to screen patients for biomarkers predictive of response a priori to prevent adverse reactions has created a subspecialty within the field of human genetics known as pharmacogenomics. The goal of pharmacogenomics is the identification and characterization of genes that predict drug response [2]. Due to the inherent complexity of the response phenotype, it is hypothesized that patient outcome is largely dependent upon interactions among genes and the environment. These nonlinear genetic interactions, known as epistasis, quickly diminish the applicability of traditional statistical methods.
Taken together with the current explosion of genetic
information as the field pushes towards genome-wide association studies, epistasis presents analytical challenges of an enormous combinatorial magnitude [3;4]. Traditional parametric analysis methods can be overwhelmed by datasets having huge numbers of attributes yet few samples. In response to the complex nature of current genetic studies, a number of novel statistical and computational
120
methods have been developed, such as Monte Carlo logic regression, two-stage approaches, Combinatorial Partitioning Method, Multifactor Dimensionality Reduction, and Detection of Informative Combined Effects [5-9]. Even with suitable analytical methodology, considering experimental information gathered from only one type of biological data will not permit the capture of the enormous complexity of systemic response phenotypes. Systems biology seeks to integrate multiple levels of information to understand how biological systems function [10]. By studying the relationships and interactions between various parts of a biological system, a more comprehensive model can be developed. Furthermore, because biology operates through a hierarchy of levels, incorporating data from multiple levels can provide surrogate data to fill gaps from any one biological level, and the partial redundancy between levels can further mitigate methodological unreliability [11]. For pharmacogenomic studies, an initial systems biology approach might measure variation in both genes and proteins in a patient to identify biomarkers that predict response to a given drug. While there is intuitive appeal to such a strategy, adding pieces of information on different scales of measurement (i.e. continuous proteomic data as well as categorical genetic data) creates additional analytical challenges. Therefore, appropriate computational analysis methods must not only traverse large numbers of input variables, but will also need to handle diverse data types. One such computational method is the Random Forests (RF) approach [12]. RF is a machine learning technique that builds a forest of classification
121
trees wherein each tree is grown on a bootstrap sample of the data, and the attribute at each tree node is selected from a random subset of all attributes. The final classification of an individual is determined by voting over all trees in the forest. There are many advantages of the RF method that make it an ideal approach for the analysis of diverse biological data in pharmacogenomic studies. First, it can handle a large number of input attributes—both qualitative (e.g. Single Nucleotide Polymorphisms, or “SNPs”) and quantitative (e.g. microarray expression levels or data from high-throughput proteomic technologies). Second, it estimates the relative importance of attributes in determining classification, thus providing a metric for feature selection. Third, RF produces a highly accurate classifier with an internal unbiased estimate of generalizability during the forest building process. Fourth, RF is fairly robust in the presence of etiological heterogeneity and relatively high amounts of missing data [13]. Finally, and of increasing importance as the number of input variables increases, learning is fast and computation time is modest even for very large datasets [14]. In the current study, we use simulated data to investigate the potential of using a RF approach for the combined analysis of both genetic and proteomic data gathered in a study of adverse events associated with trials of a new smallpox vaccine [15;16]. The simulations are based on data collected from recent clinical trials of the Aventis-Pasteur Smallpox Vaccine (APSV), in which a significant proportion of vaccinees suffered systemic adverse events (AEs)— including fever, lymphadenopathy, and generalized rash.
The data include
genotypes at 1442 SNPs and measured circulating levels of 108 immunological
122
proteins. This dataset was chosen for its complex phenotype, the large number of attributes, and the multiple types of data collected. By using the actual data collected as the basis for our simulations, we reduce the number of oversimplifying assumptions and hope to better model the complexity inherent in real data. Because adverse reaction to vaccination is a complex phenotype, it is likely due to the coordinated action of multiple biological factors. Therefore, our simulated outcome (adverse event) models involve attribute interactions with only slight main effects. In this study, we evaluate the ability of RF to detect outcome-associated simulated attributes by analyzing genetic data alone, proteomic data alone, or combined genetic and proteomic data. We address several questions with this study. First, to address the unresolved issue of where to set the importance cutoff for relevant attributes [13], can an appropriate threshold be set for the calculated RF importance relative to all attributes in the particular dataset analyzed that includes our simulated functional attributes? Second, how does RF perform when given different types of simulated biological data as input? Third, is there a relationship between the degree of informational redundancy and the ability of RF to select proteomic attributes related to the functional genetic attributes? Fourth, are there situations in which the analysis of multiple data types proves beneficial? In brief, our results indicate that utilizing multiple data types is beneficial when the disease model is complex and the outcomeassociated data type is unknown. Importantly, using RF, we do not observe any significant disadvantage to an analysis strategy integrating both data types.
123
Methods
Random Forests A Random Forest is a collection of decision tree classifiers, where each tree in the forest has been trained using a bootstrap sample of individuals from the data, and each split attribute in the tree is chosen from among a random subset of attributes. Classification of individuals is based upon aggregate voting over all trees in the forest. Each tree in the forest is constructed as follows from data having N individuals and M explanatory attributes: 1. Choose a training sample by selecting N individuals, with replacement, from the entire dataset. 2. At each node in the tree, randomly select m attributes from the entire set of M attributes in the data. The absolute magnitude of m is a function of the number of attributes in the dataset (m =
M ) and
remains constant throughout the forest building process. 3. Choose the best split at the current node from among the subset of m attributes selected above. 4. Iterate the second and third steps until the tree is fully grown (no pruning of lower branches with lesser predictive value). Repetition of this algorithm yields a forest of trees, each of which have been trained on bootstrap samples of individuals (see Figure 1). Thus, for a given
124
tree, certain individuals will have been left out during training. Prediction error and attribute importance is estimated from these “out-of-bag” individuals. The out-of-bag (unseen) individuals are used to estimate the importance of particular attributes according to the following logic: If randomly permuting values of a particular attribute does not affect the predictive ability of trees on out-of-bag samples, that attribute is assigned a low importance score.
If,
however, randomly permuting the values of a particular attribute drastically impairs the ability of trees to correctly predict the class of out-of-bag samples, then the importance score of that attribute will be high. By running out-of-bag samples down entire trees during the permutation procedure, attribute interactions are taken into account when calculating importance scores, since class is assigned in the context of other attribute nodes in the tree.
125
M attributes
M attributes
Entire dataset
Bootstrap sample
m attributes
Out-of-bag individuals Step-1
Step-3
Step-2 Step-4 m16 m5
m94
AE nonAE
m812 AE nonAE
m423 AE nonAE
Figure 1. Construction of individual trees using the Random Forest method from a full dataset of N individuals and M attributes. The steps correspond to those described in the Methods section. The recursive partitioning trees comprising a RF provide an explicit representation of attribute interaction that is readily applicable to the study of interactions among multiple data types [17;18].
These models may uncover
interactions among genes, proteins, and/or environmental factors that do not exhibit strong marginal effects. Additionally, tree methods are suited to dealing with certain types of genetic heterogeneity, since splits near the root node define 126
separate model subsets in the data. Random Forests capitalize on the solid benefits of decision trees and have demonstrated excellent predictive performance when the forest is diverse (i.e. trees are not highly correlated with each other) and composed of individually strong classifier trees [12;19]. Diversity is achieved by finding an optimal m (the number of attributes tried at each node) that is considerably less than M (the total number of attributes in the data), which introduces variation into the forest building process; the optimal m will also build strong classifier trees by providing a sufficiently complete search through attributes in the data. The RF method is a natural approach for studying genegene, gene-protein, or protein-protein interactions because importance scores for particular attributes take interactions into account without demanding a prespecified model [20].
Data simulation Simulation studies were designed to assess whether a Random Forests classifier is able to select the appropriate (outcome-associated) attributes from datasets consisting of categorical genetic (SNP) attributes, continuous proteomic (cytokine) attributes, or both. The results of this study will be used to develop an analysis strategy that effectively combines information gathered on diverse biological data types for the vaccine trial described below. As mentioned previously, the simulations are based on data collected from recent clinical trials of the Aventis-Pasteur Smallpox Vaccine (APSV), where a high proportion of vaccinees suffered systemic adverse events (AEs). These
127
AEs included fever, lymphadenopathy, and generalized rash. The data collected include genotypes at 1442 SNPs (selected from genomic regions within or near candidate genes) and circulating levels of 108 immunological proteins (cytokines). For the APSV data, some proteomic attributes are also represented by genetic data in the corresponding gene. Thus, there is biological overlap between the two data types.
Following the protocol described below, the
simulated datasets mirrored the actual (APSV) trial data in terms of allele frequencies, SNP distribution across proteins, case (AE)/control (non-AE) ratio, potential patterns of linkage disequilibrium between SNPs, covariance structure across protein levels, etc. To create simulated data reflecting the complex properties of that collected for the APSV study, those data were used as the basis for the simulations. First, the AE status was stripped from the APSV data. Next, a new AE status was assigned according to genetic attributes in the data consistent with our simulated genetic models and maintaining the overall case/control (AE/nonAE) ratio.
Then, to represent the biological transfer of information
between genes and proteins, proteomic attributes related to the functional genetic attributes were added. The related proteomic attributes simulate a range of geneÆprotein information transfer proportions. For example, to simulate a functional (outcome-associated) genetic attribute that is represented by the corresponding protein in the proteomic data, a related proteomic attribute is added to the proteomic data.
However, to account for biological variation
between genotype and protein level, the functional genetic attribute is only
128
responsible for a portion of the variation in protein level for the related attribute (see Figure 2). Thus, information is not transferred between related attributes with perfect fidelity.
Genetic Data ( SNPs)
Information Loss
Information Transfer (%) Proteomic Data (Cytokines)
Figure 2. Information transfer between simulated genetic and proteomic attributes. For a particular attribute, the information transfer is the proportion (%) of variation in the simulated proteomic attribute explained by the corresponding genetic attribute.
Penetrance functions are used to represent our partially epistatic genetic models. As in Table 1, penetrance defines the probability of experiencing an adverse event given a particular genotype combination. For these models, two genetic attributes (GeneticA + GeneticB) have a joint (epistatic) effect upon outcome class, and each attribute also has a very slight marginal effect (M) above the population prevalence (K). For a particular combination of genotypes at i=GeneticA and j=GeneticB, the probability of belonging to the outcome class AE = fij in Table 1. A range of heritability values was selected for our simulations, including 10%, 20%, and 40%. Roughly, heritability is the proportion of the total variation in outcome that is due to genetic effects. 129
Although the heritability
values used here translate to weak signals in the data, these values would classify as low to moderate genetic effects. Since there is scant data relating adverse events after vaccination with APSV to serum proteomic data or SNP data, heritability values in the low- to mid-range of those estimated for common complex phenotypes were used in these simulations.
For a more thorough
explanation of the heritability calculations used in this study, see [21].
An
example of the penetrance functions used for the models generated in this study is given in Table 2. Datasets with a range of geneticÆproteomic information transfer (see Figure 2) were created for each genetic model. For each combination defined in Table 3 by a genetic model heritability (10%, 20%, 40%), a proportion of geneticÆproteomic information transfer (15%, 30%, 45%, 60%, 75%, 90%), and a data type (Genetic, Proteomic, Genetic+Proteomic), 100 datasets were simulated for analysis, resulting in 5400 total datasets. strategy is summarized in Figure 3.
130
The data simulation
Genetic Data (SNPs)
Information Loss
AE Model
Status
Heritability (%) {10, 20, 40} Vs.
Information Transfer (%) {15, 30, 45, 60, 75, 90}
nonAE
AE
Proteomic Data (Cytokines) Figure 3. Summary of the data simulation strategy. First, the AE status was stripped from the APSV data. Next, a new AE status was assigned according to simulated genetic models with a range of heritability. Then, proteomic attributes related to the functional genetic attributes were added with a range of information transfer percentages, resulting in proteomic attributes that are indirectly related to AE status (represented by the dashed line).
131
Table 1. Penetrance function for a model of AE status associated with two functional genetic attributes: A and B.
Genetic Attribute A
Genetic Attribute B BB
Bb
bb
AA
f11
f12
f13
MA1
Aa
f21
f22
f23
MA2
aa
f31
f32
f33
MA3
MB1
MB2
MB3
K
Table 2. Example penetrance function for a simulated genetic AE model with 10% heritability. Allele frequencies for each attribute are equal (p = q = 0.5).
Genetic Attribute A
Genetic Attribute B BB
Bb
bb
AA
0
0
0
MA1
Aa
0
0.2
0.2
MA2
aa
0
0.2
0.2
MA3
MB1
MB2
MB3
K
Table 3. Overview of simulated datasets. For each combination of genetic heritability and geneticÆproteomic information transfer, 100 datasets were simulated, each containing one of the following data types: Genetic data alone = G; Proteomic data alone = P; Genetic + Proteomic data combined = GP.
Genetic Heritability
Genetic-Proteomic Information Transfer 15%
30%
45%
60%
75%
90%
10%
G,P,GP
G,P,GP
G,P,GP
G,P,GP
G,P,GP
G,P,GP
20%
G,P,GP
G,P,GP
G,P,GP
G,P,GP
G,P,GP
G,P,GP
40%
G,P,GP
G,P,GP
G,P,GP
G,P,GP
G,P,GP
G,P,GP
132
Data analysis The analysis was performed using the freely available R package randomForest [22;23].
This package is based on the original Fortran code
available at [24]. Given a dataset having a particular combination of genetic model heritability and geneticÆproteomic information transfer (see Table 3), RF was used to analyze datasets containing each simulated biological data type separately and in parallel. Genetic attributes were treated as categorical while proteomic attributes were treated as continuous values. For each of the 100 genetic, proteomic, or combined datasets, forests comprised of 10,000 trees were grown.
Attribute importance was calculated using the out-of-bag
permutation test. The relative importance (rank) of functional genetic attributes and related proteomic attributes was determined from the mean decrease in Gini index using the out-of-bag permutation testing procedure [17]. The Gini diversity index, i, at a tree node, t, has the form
∑ p( j | t ) p(i | t ) , where p(j|t) and p(i|t) are j ≠i
the probabilities of assigning a subject to classes j or i, respectively [17]. The relative importance determined from the mean decrease in classification accuracy produced statistically similar results.
133
Results
Figure 4 shows the relative importance rank (expressed as a percentile) of the two functional genetic attributes calculated by the RF over all datasets. Each data point on the graph represents the mean relative importance rank calculated over 100 datasets, with the bars representing 95% confidence intervals about the mean. This figure demonstrates several important trends regarding the relative importance of the functional genetic variables with the three possible combinations of data types analyzed (Genetic alone = G, Proteomic alone = P, Genetic + Proteomic combined = GP).
Analyzing the genetic data alone
consistently demonstrated the highest relative importance for the functional genetic attributes.
Analyzing the combined genetic + proteomic data
demonstrated relative importance that was very near to that of the genetic alone. This slight discrepancy may be due to the increased number of noise attributes (the combined dataset has 1550 attributes while the genetic data alone has only 1442). It is interesting to note that as the heritability of the model increases, the gap in functional attribute importance between the genetic and combined analyses narrows. Of course, regardless of heritability or geneticÆproteomic information transfer, analyzing the proteomic data alone makes it impossible to identify the correct genetic attributes since they are not present in the proteomic datasets. Also, as expected, the relative importance of the genetic attributes is not influenced by the amount of information transfer between genetic and proteomic data.
134
Additionally, it is clear from Figure 4 that as the heritability of the model increases (across the panels from 10-20-40%), the relative rank of the functional genetic attributes increases.
This is expected, since increased heritability
increases the signal strength in the data. It is also important to note that even at the lowest heritability simulated (10%), RF successfully identifies the functional variables as relatively important (above the 80th percentile for all models). The fact that the functional variables are not always ranked at the top of all importance scores means that RF is also finding chance AE associations in datasets with weak simulated genetic signals.
135
Relative Importance of Functional Genetic Attributes Percentile Rank
10% Heritability 100 80 60 40 20 0
G GP
P
G
G
G
G
20% Heritability G
GP G P GP G P GP
P
P
P
P
P
15 30 45 60 75 90
G
G
G
G
G
40% Heritability G
GP G P GP G P GP G P
P
P
P
P
P
P
15 30 45 60 75 90
G
G
G
G
G
G
G P GP G P GP G P GP
P
P
P
P
P
P
15 30 45 60 75 90
Genetic-Proteomic Information Transfer (%) Graphs by heritabilityPaperPerc
Figure 4. Relative importance of functional genetic outcome-associated attributes for each data type analyzed: Genetic data alone = G; Proteomic data alone = P; Genetic data + Proteomic data combined = GP. Each labeled point represents the mean (plus 95% confidence interval) importance over 100 datasets. Note: the functional genetic attributes are not present in datasets comprised of only proteomic data (P).
Figure 5 shows the RF relative importance rank of the proteomic variables related to the functional genetic variables (by the % information transfer given along the horizontal axis). Again, each data point represents the mean relative importance rank of the related proteomic attributes calculated over 100 datasets, with the bars representing 95% confidence intervals about the mean. The results are shown for all models, and several significant trends are clear. As expected, when just the genetic datasets are analyzed, it is impossible to identify any proteomic variables as important since they are excluded from those data. Also apparent from Figure 5 are the wider confidence intervals associated with analysis of the proteomic datasets alone. As in Figure 4, increased heritability of the underlying genetic models generally increases the relative importance of outcome-associated attributes
136
(which are the related proteomic attributes in Figure 5).
Unlike the relative
importance of genetic attributes considered in Figure 4, where the results were unaffected by the amount of information transfer between the genomic and proteomic data, when considering the related proteomic attributes in Figure 5, it is clear that the degree of relatedness between the functional genetic attributes and the related proteomic attributes (information transfer) exerts significant influence over the relative importance.
This trend is very pronounced in the
analysis of the proteomic data alone. As the information transfer increases, the relative importance of the related proteomic attributes increases. The same is true, although to a lesser degree, for the combined genetic + proteomic analyses. Since the disease models are genetic, it is intuitive that as the amount of information transfer between genetic and proteomic attributes increases, the stronger the signal in the proteomic data.
137
Relative Importance of Related Proteomic Attributes Percentile Rank
10% Heritability 100 80 60 40 20 0
GP
P G
G P GP GP G P GP
P G
P G
P G
P G
20% Heritability
40% Heritability
GP G P GP G P GP G P
GP G P GP G P GP G P
P G
15 30 45 60 75 90
P
P
P G
G
P
P G
P G
P G
P G
15 30 45 60 75 90
G
P
P
P
P G
G
G
G
G
15 30 45 60 75 90
Genetic-Proteomic Information Transfer (%) Graphs by heritabilityPaperPerc
Figure 5. Relative importance of proteomic attributes related (according to the amount of genetic-proteomic information transfer along the horizontal axis) to functional genetic attributes for each data type analyzed: Genetic alone = G, Proteomic alone = P, Genetic + Proteomic combined = GP. Each labeled point represents the mean (plus 95% confidence interval) importance over 100 datasets. Note: functional proteomic attributes are not present in datasets comprised of only genetic data (G).
The most striking trend shown in Figure 5 is the large difference between the proteomic and the combined genetic + proteomic analysis strategies. The combined genetic + proteomic analysis strategy is substantially more successful at identifying the related proteomic attributes as important than analysis of the proteomic data alone, especially for models with lower heritability and information transfer. This performance gap may arise out of the partially epistatic nature of the models and the stochastic nature of the RF methodology.
Considering
models with only slight marginal effects, for RF to assign high attribute importance scores, trees must consistently contain both of the relevant interacting attributes.
For the combined dataset (containing two functional
genetic attributes and two related proteomic attributes), there are more opportunities to choose one of the interacting relevant attributes nearer the root 138
of the tree and then choose the complementary attribute at subsequent splits than for the proteomic data alone (containing only two related proteomic attributes). The performance gap between genetic versus combined datasets in identifying relevant proteomic attributes narrows as both information transfer and heritability increase.
Discussion
The results of this study demonstrate that there is a marked advantage to an integrated analysis approach incorporating multiple data types. While the genetic analysis was appropriate for identifying the functional genetic features, the combined strategy analyzing both genetic and proteomic data performed nearly as well at identifying functional genetic attributes and provides another distinct advantage—the identification of important related proteomic variables. This property would be beneficial in situations where the functional outcomeassociated data type is unknown or not appropriately measured. For example, our simulated models are not determined by protein abundance, as is often measured experimentally. Instead, our simulations represent a situation wherein genotype codes for some unmeasured proteomic aspect (e.g. enzymatic activity) that determines phenotype.
Still, if protein abundance is also related to
genotype, even with some loss of information, the proteomic data can be analytically useful. The convergence of genetic and related proteomic attributes receiving high importance scores could serve as a strategy for limiting false
139
positive results. Also, including multiple data types has the intangible advantage of allowing for better biological interpretation of a resulting model. These results show no substantial disadvantage to the joint analysis of multiple data types. With respect to setting an appropriate cutoff for selection of relevant features using RF, our results indicate that the choice of threshold depends upon the strength of the signal in the data. From Figures 4 and 5, it appears that the importance threshold may need to be relaxed to identify relevant attributes in datasets with low signal and a low degree of information transfer between related data types. However, RF seems largely robust to the addition of noise variables in the larger datasets—so long as relevant attributes are present in the data. The results of this study also show that RF is adept at identifying relevant features in high-dimensional data containing attributes on multiple scales of measurement. RF identifies features with small marginal effects and low heritability. Relevant attributes may be selected from either data type, and there may be interactions across data types.
RF is thus well-suited to the study of phenotypes with
complex underlying etiologies, where the biological features of interest have yet to be elucidated. While the results of this study are promising, there are questions yet to be addressed. The combined RF approach needs to be applied to a real dataset (and the results tested at the lab bench) to confirm the conclusions of the simulation study. Currently, the dataset used as the template for the simulations is being analyzed using the integrated RF approach found to be successful with these simulations. Additionally, work must be continued on modifications to RF
140
that allow for the discovery of purely epistatic genetic models [19]. Because RF chooses only one attribute at each tree split during construction, strictly epistatic (i.e. absence of even miniscule main effects) attributes will not be selected. Finally, strategies for automatically translating the features selected by RF into meaningful biological hypothesis need to be developed.
141
Acknowledgments
This work was supported by NIH grants AI-064625, AI-59694, AI-057661, and GM-62758.
References
1.
J. Lazarou, B. H. Pomeranz, and P. N. Corey, "Incidence of adverse drug reactions in hospitalized patients: a meta-analysis of prospective studies," JAMA, vol. 279, no. 15, pp. 1200-1205, 1998.
2.
R. A. Wilke, D. M. Reif, and J. H. Moore, "Combinatorial pharmacogenetics," Nature Reviews Drug Discovery, vol. 4, no. 11, pp. 911-918, 2005.
3.
J. H. Moore, "The ubiquitous nature of epistasis in determining susceptibility to common human diseases," Human Heredity, vol. 56, no. 1-3, pp. 73-82, 2003.
4.
J. H. Moore and S. M. Williams, "Traversing the conceptual divide between biological and statistical epistasis: systems biology and a more modern synthesis," Bioessays, vol. 27, no. 6, pp. 637-646, 2005.
5.
C. Kooperberg and I. Ruczinski, "Identifying interacting SNPs using Monte Carlo logic regression," Genetic Epidemiology, vol. 28, no. 2, pp. 157-170, 2005.
6.
J. Marchini, P. Donnelly, and L. R. Cardon, "Genome-wide strategies for detecting multiple loci that influence complex diseases," Nature Genetics, vol. 37, no. 4, pp. 413-417, 2005.
7.
M. R. Nelson, S. L. Kardia, R. E. Ferrell, and C. F. Sing, "A combinatorial partitioning method to identify multilocus genotypic partitions that predict quantitative trait variation," Genome Res., vol. 11, no. 3, pp. 458-470, 2001.
8.
M. D. Ritchie, L. W. Hahn, N. Roodi, L. R. Bailey, W. D. Dupont, F. F. Parl, and J. H. Moore, "Multifactor-dimensionality reduction reveals high-order interactions among estrogen-metabolism genes in sporadic breast cancer," American J Human Genetics, vol. 69, no. 1, pp. 138-147, 2001. 142
9.
N. Tahri-Daizadeh, D. A. Tregouet, V. Nicaud, N. Manuel, F. Cambien, and L. Tiret, "Automated detection of informative combined effects in genetic association studies of complex traits," Genome Res., vol. 13, no. 8, pp. 1952-1960, 2003.
10.
L. Hood, "Systems biology: integrating technology, biology, and computation," Mech. Ageing Dev., vol. 124, no. 1, pp. 9-16, 2003.
11.
D. M. Reif, B. C. White, and J. H. Moore, "Integrated analysis of genetic, genomic, and proteomic data," Expert Reviews in Proteomics, vol. 1, no. 1, pp. 67-75, 2004.
12.
L. Breiman, "Random Forests," Machine Learning, vol. 45, no. 1, pp. 5-32, 2001.
13.
K. L. Lunetta, L. B. Hayward, J. Segal, and E. P. Van, "Screening largescale association study data: exploiting interactions using Random Forests," BMC Genet, vol. 5, no. 1, p. 32, 2004.
14.
M. Robnik-Sikonja, "Improving Random Forests," Machine Learning: Ecml 2004, Proceedings, vol. 3201, pp. 359-370, 2004.
15.
B. A. McKinney, D. M. Reif, M. T. Rock, K. M. Edwards, S. F. Kingsmore, J. H. Moore, and J. E. Crowe, Jr., "Cytokine expression patterns associated with systemic adverse events following smallpox immunization," J Infect. Dis., vol. 194, no. 4, pp. 444-453, 2006.
16.
M. T. Rock, S. M. Yoder, T. R. Talbot, K. M. Edwards, and J. E. Crowe, Jr., "Adverse events after smallpox immunizations are associated with alterations in systemic cytokine levels," J Infect. Dis., vol. 189, no. 8, pp. 1401-1410, 2004.
17.
L. Breiman, J. H. Friedman, R. A. Olshen, and C. J. Stone, Classification and Regression Trees. New York: Chapman & Hall, 1984.
18.
M. A. Province, W. D. Shannon, and D. C. Rao, "Classification methods for confronting heterogeneity," Adv Genetics, vol. 42, pp. 273-286, 2001.
19.
A. Bureau, J. Dupuis, K. Falls, K. L. Lunetta, B. Hayward, T. P. Keith, and E. P. Van, "Identifying SNPs predictive of phenotype using Random Forests," Genet Epidemiology, vol. 28, no. 2, pp. 171-182, 2005.
20.
B. A. McKinney, D. M. Reif, M. D. Ritchie, and J. H. Moore, "Machine Learning for Detecting Gene-Gene Interactions: A Review," Appl. Bioinformatics, vol. 5, no. 2, pp. 77-88, 2006.
143
21.
R. Culverhouse, B. K. Suarez, J. Lin, and T. Reich, "A perspective on epistasis: limits of models displaying no main effect," American J Human Genetics, vol. 70, no. 2, pp. 461-471, 2002.
22.
R. Ihaka and R. Gentleman, "R: A Language for Data Analysis and Graphics," Journal of Computational and Graphical Statistics, vol. 5, pp. 299-314, 1996.
23.
R Development Core Team, "R: A Language and Environment for Statistical Computing," R Foundation for Statistical Computing, Vienna, Austria, 2006.
24.
L. Breiman and A. Cutler, "Random www.stat.berkeley.edu/users/breiman/RandomForests, 2004.
144
Forests,"
CHAPTER VI
INTEGRATED ANALYSIS OF GENETIC AND PROTEOMIC DATA IDENTIFIES BIOMARKERS ASSOCIATED WITH ADVERSE EVENTS FOLLOWING SMALLPOX VACCINATION
Complex clinical outcomes, such as adverse reaction to vaccination, arise from the concerted interactions among the myriad components of a biological system. Therefore, comprehensive etiological models can only be developed through the integrated study of multiple types of experimental data. In this study, we apply this paradigm to high-dimensional genetic and proteomic data collected to elucidate the mechanisms underlying development of adverse events (AEs) in patients following smallpox vaccination. Since vaccination was successful in the patients under study, the AE outcomes reported likely represent interactions among immune system components that either push immune responses beyond the necessary magnitude or sustain responses longer than necessary. In the current study, we examined 1442 genetic variables (SNPs) and 108 proteomic variables (cytokine levels) to model AE risk.
To accomplish this daunting
analytical task, we employed the Random ForestsTM (RF) method to filter out the most important attributes, then used the selected attributes to build a final decision tree model.
This strategy is well-suited to integrated analysis, as
relevant attributes may be selected from categorical or continuous data. Importantly, RF is a natural approach for studying the type of gene-gene, geneprotein, and protein-protein interactions we hypothesize to be involved in AE
145
development
because
importance
scores
for
particular
attributes
take
interactions into account, and there may be interactions across data types. Combining information from previous studies on AEs related to smallpox vaccination with the genetic and proteomic attributes identified by RF, we build a comprehensive model of AE development that includes the cytokines ICAM-1 (CD54), IL-10, and CSF-3 (G-CSF), as well as a genetic polymorphism in IL-4. The biological factors included in the model support our hypothesized mechanism for the development of AEs involving prolonged stimulation of inflammatory pathways and the imbalance of normal tissue damage repair pathways. This study demonstrates the utility of the RF for such analytical tasks, and both enhances and reinforces our working model of AE development following smallpox vaccination.
146
Introduction
Live attenuated vaccinia virus (VV), delivered intradermally, is the most common type of vaccine given to immunize individuals against smallpox. While vaccination of healthy adults with VV induces a protective response in the majority of individuals immunized, VV is reactogenic in a significant number of vaccinées [1]. The most common adverse events (AEs) following vaccination include fever, lymphadenopathy (swelling and tenderness of lymph nodes), and a generalized acneiform rash. Collectively, these reactions suggest that individuals suffering AEs have innate immune responses beyond the necessary magnitude or sustain the immune response longer than necessary. To elucidate the complex pathophysiology underlying inappropriate response to vaccination, we gathered high-dimensional genetic and proteomic data in a cohort of subjects in which an unacceptably high proportion experienced an AE following primary immunization with Aventis Pasteur smallpox vaccine (APSV). Through a comprehensive examination of systemic (serum) cytokine/chemokine changes combined with characterization of polymorphisms in a panel of candidate genes, we aim to provide a thorough portrayal of the complex genetic and proteomic interplay behind the development of adverse events. Knowledge of how risk factors in a subject’s genetic background interact with dynamically changing levels of immunological proteins could shed light on important therapeutic targets or pathways to direct vaccine modification and prevaccination screening procedures.
147
Although there is considerable intuitive appeal to incorporation of multiple types of biological data, simultaneous analysis of information on different scales of measurement (i.e. continuous proteomic data as well as categorical genetic data)
creates
additional
analytical
challenges.
Therefore,
appropriate
computational analysis methods must not only traverse large numbers of input variables, but will also need to handle diverse data types. For this study, we employed a two-stage analysis strategy. The first step was to effectively filter a list of over 1500 genetic and proteomic attributes—taking interactions within and across data types into account—down to an analytically tractable subset of candidates.
The second step involved careful statistical and biological
exploration of the filtered subset of candidate attributes, resulting in a final model of AE development. For the first (filter) step, we implemented a Random ForestsTM (RF) approach [2].
RF is a machine learning technique that builds a forest of
classification trees by sampling—with replacement—from the data and selecting the attribute at each tree node from a random subset of all attributes. The RF method offers many advantages for the analysis of diverse biological data. First, it can handle a large number of input attributes—both discrete (e.g. Single Nucleotide Polymorphisms, or “SNPs”) and continuous (e.g. microarray expression levels or data from high-throughput proteomic technologies). Second, it estimates the relative importance of attributes in discriminating between classes (AE status), thus providing a metric for feature selection. Third, RF produces a highly accurate classifier with an internal unbiased estimate of
148
generalizability during the forest building process. Fourth, RF is fairly robust in the presence of etiological heterogeneity and missing data [3]. Finally, learning is fast and computation time is modest even for very large datasets [4]. In the second (modeling) step, we took advantage of the tractable number of attributes identified by the RF filter to thoroughly explore the statistical and biological relationships among the attributes and AE outcomes. Decision trees were used to derive a descriptive, biologically interpretable model of the functional interactions among the attributes associated with systemic AEs. Our final model justifies our multi-scale analysis strategy, in that it includes the cytokines ICAM-1, IL-10, and CSF-3 (G-CSF), as well as a SNP in IL-4. Evaluating our final model from an immunological perspective, we conclude that AEs in response to smallpox vaccination result from hyperactivation of innate inflammatory pathways leading to excess recruitment and stimulation of monocytes in peripheral tissues.
This model is consistent with work
demonstrating over-stimulation of inflammatory and tissue damage repair pathways developed in previous studies of AEs following smallpox vaccination [5-8].
Methods
Study subjects Vaccines, study subjects, and study design have been described in detail in [6].
Briefly, 148 (116 with recorded AE information) healthy adults were
149
enrolled at the Vanderbilt University Medical Center as part of a multi-center study of primary immunization against smallpox using the APSV at National Institutes of Health (NIH) Vaccine and Treatment Evaluation Units. NIH-DMID Protocol 02-054 was implemented.
Volunteers were eligible if they had no
smallpox vaccination scar, no history of vaccinia virus immunization, normal renal and hepatic serum chemistry values, no contraindications against immunization (pregnancy, immunosuppression, or eczema), and negative serum test results for: hepatitis B surface antigen, hepatitis C virus antibody, rapid plasma reagin, and HIV-1 ELISA.
There were a total of 61 subjects for whom both genetic and
proteomic data was gathered. Individuals were asked to self-identify race, with White (60) and Asian (1) as the only categories.
There was no statistical
difference in age, gender, or race according to AE status.
Clinical assessments For all study subjects, a team of trained physicians and nurse providers examined the medical history and clinical symptoms to insure consistent clinical assessment. Subjects were examined on 5 visits within the first month postvaccination and were assessed for occurrence of an adverse event. Collection of serum for cytokine measurements occurred at the evaluation just before vaccination (baseline) and at the evaluation between days 6-9 post-vaccination (acute phase). While all adverse events were noted, only systemic AEs were considered in this study, since we expected these to be associated more strongly with serum cytokine expression than would an AE displayed only at the site of
150
inoculation.
Systemic
lymphadenopathy.
AEs
included
fever,
generalized
rash,
and
Specifically, fever was defined as an oral temperature of
greater than 38.3°C. Generalized rash was defined as skin eruptions on noncontiguous areas in reference to the site of vaccination. Detailed descriptions of the acneiform rashes considered in this study can be found in [9]. Lymphadenopathy was defined as enlargement or tenderness of regional lymph nodes attributed to vaccination.
For subjects on which both genetic and
proteomic data was gathered, 16 subjects experienced a systemic AE and 45 subjects did not experience an AE.
Identification of genetic polymorphisms The custom SNP panel used in this study was originally developed for genetic studies of human cancers. Thus, the SNPs were chosen for genotyping based on their oncological relevance. As such, the majority of SNPs included on the panel were involved in signaling pathways, many of which had immunological components.
Genotyping for single nucleotide polymorphisms (SNPs) was
performed using DNA amplified directly from blood samples collected from each subject. National
Genotyping was performed at the Core Genotyping Facility of the Cancer
Institute
(NCI)
(http://cgf.nci.nih.gov/home.cfm) [10].
in
Gaithersburg,
Maryland
Genotypes were generated using the
IlluminaTM GoldenGate assay technology. Of the 1536 SNPs assayed, a total of 1442 genotypes passed quality control filters.
151
Quantification of serum cytokine levels Serum samples were obtained just prior to vaccination (baseline) and 6-9 days after vaccination (acute). Serum samples were collected in 5 ml Vacutainer serum separator tubes (Becton Dickinson, San Jose, CA) and were centrifuged at 700 x g for 10 minutes. The serum then was collected, aliquoted into cryovials (Sarstedt Inc., Numbrecht, Germany) and stored at –80 ºC until assayed for cytokine concentrations using Rolling circle amplification technology (RCAT). A custom dual antibody sandwich immunoassay array, as described in [11-14] was used to measure the expression levels of 108 protein analytes in 100 μL serum aliquots from the patient samples.
Briefly, glass slides held 12
replicate spots of monoclonal capture antibodies specific for each analyte. Duplicate samples of sera were incubated for 2 hours, washed, and then incubated with secondary biotinylated polyclonal antibodies. The ‘rolling circle’ method was then used to amplify signals [12]. Quality control measures were used to optimize antibody pairs, minimize array-to-array variation, and standardize procedures of chip manufacturing [12]. A Tecan LS200 unit was used to scan arrays and customized software was used to determine mean fluorescence intensities (MFIs). Additionally, 15 serial dilutions of recombinant analytes at known concentrations (studied in parallel on each slide) were used to develop best-fit equations for each analyte and the upper and lower limits of quantitation were defined. Changes in serum cytokine concentrations were calculated as percent change from baseline due to the broad individual range of systemic cytokine expression before and after immunization.
152
Random forests A Random Forest is a collection of decision tree classifiers, where each tree in the forest has been trained using a bootstrap sample of individuals from the data, and each split attribute in the tree is chosen from among a random subset of attributes. Classification of individuals is based upon aggregate voting over all trees in the forest. Each tree in the forest is constructed as follows from data having N individuals and M explanatory attributes: 1. Choose a training sample by selecting N individuals, with replacement, from the entire dataset. 2. At each node in the tree, randomly select m attributes from the entire set of M attributes in the data. The absolute magnitude of m is a function of the number of attributes in the dataset (m =
M ) and
remains constant throughout the forest building process. 3. Choose the best split at the current node from among the subset of m attributes selected above. 4. Iterate the second and third steps until the tree is fully grown (lower branches are not trimmed in the interest of generalizability). Repetition of this algorithm yields a forest of trees, each of which have been trained on bootstrap samples of individuals (see Figure-1). Thus, for a given tree, certain individuals will have been left out during training. Prediction error and attribute importance is estimated from these “out-of-bag” individuals according to the procedure described in Chapter V.
153
M attributes
M attributes
Entire dataset
Bootstrap sample
m attributes
Out-of-bag individuals Step-1
Step-3
Step-2 Step-4 m16 m5
m94
AE nonAE
m812 AE nonAE
m423 AE nonAE
Figure 1: Construction of individual trees using the random forest method from a full dataset of N individuals and M attributes. Proceeding from the root node, individual subjects are classified into terminal AE status leaves according to the value of that individual’s genetic or proteomic attribute at each node. The steps correspond to those described in the text.
The recursive partitioning trees comprising a RF provide an explicit representation of attribute interaction that is readily applicable to the study of interactions among multiple data types [15,16]. As discussed in Chapter V, RF have demonstrated excellent predictive performance when the forest is diverse 154
(i.e. trees are not highly correlated with each other) and composed of individually strong classifier trees [17,18]. The RF method is a natural approach for studying gene-gene, gene-protein, or protein-protein interactions because importance scores for particular attributes take interactions into account without a priori model specification [19].
Decision trees To represent the interactions among genetic and/or proteomic attributes associated with AEs, decision trees were chosen to build the final model because of their ready interpretability and explicit modeling of attribute interactions. The tree classifies individual subjects into AE groups by proceeding down a dichotomous tree, where the genetic or proteomic attribute at each node (or split) is selected for the gain in information it provides (Essentially:
how well
knowledge about the variation in this attribute separates subjects into appropriate AE classes). When interpreting the tree, attributes at each node are taken in the context of attributes at nodes closer to the root—thus allowing an explicit representation of attribute interactions. To augment the generalizability of our final model, we stipulated that at least five subjects must appear in each terminal (status) leaf. While cross-validation accuracy was reduced by allowing trees with less than five subjects in terminal nodes, cross-validation accuracy proved to be insensitive to changes in other tree parameters for these data. We used the implementation of the C4.5 decision-tree algorithm provided in the Weka machine learning software package to obtain our final model [20].
155
Data analysis strategy Random Forest analysis was performed using the freely available R package randomForest [21,22]. This package is based on the original Fortran code available at [23].
RF was used to analyze datasets containing each
biological data type separately and in parallel. Genetic attributes were treated as categorical while proteomic attributes were treated as continuous values. For each genetic, proteomic, or combined dataset, forests comprised of 10,000 trees were grown.
This forest size gave stable estimates of attribute importance.
Attribute importance was calculated using the out-of-bag permutation test described in Chapter V.
The relative importance (rank) of functional genetic
attributes and related proteomic attributes was determined from the mean decrease in Gini index (see Chapter V) using the out-of-bag permutation testing procedure.
The relative importance determined from the mean decrease in
classification accuracy produced nearly identical results both here and in extensive simulation studies [24]. Results from simulation studies based on these data demonstrate high confidence that AE-associated attributes having low to moderate effects will be ranked in the top 10% of attributes in RF analysis [24]. Therefore, we chose the top 10% of attributes as ranked by RF as candidates for inclusion in our final model. While this threshold may have missed attributes with very weak effects, it is unlikely that such effects would have been detectable given our sample size of 61 subjects.
To represent the interactions among genetic and/or proteomic
156
attributes associated with AEs, we built a decision tree model, as previously described. Biological interpretation of our final model was aided by the Chilibot (chip literature robot) knowledge mining software, as described in [25].
Chilibot
inferred relationship networks among the attributes in the final model based upon linguistic analysis of relevant records from public biomedical literature databases. The natural language processing approach used by Chilibot is superior to standard co-occurrence text mining approaches, because parsing text into sentences can characterize the type of relationship (e.g. inhibition or stimulation) between input terms.
157
Results
Filtering of important attributes using random forests Table-1 lists all attributes having an importance rank in the top 10% relative to all attributes in the combined dataset. Figure-2 depicts the attribute importance score landscape over the entire dataset.
This landscape proved
robust to changes in RF parameters (such as attributes importance metrics and AE class-weighting schemes), provided that a sufficiently large forest was grown. RF identified both genetic and proteomic attributes as important discriminators of AE status. Approximately one-third of the attributes identified as important were genetic, with the remaining two-thirds being proteomic. While this distribution among data types may reflect systematic patterns concerning the etiology of AE outcomes, the bias toward proteomic attributes probably arises out of the fact that the cytokine array was specifically designed to capture variation in important systemic mediators. In contrast, the genetic data include candidate SNPs in and around genes having a variety of immunological functions. Also, with multiple SNPs per gene, correlation (i.e. haplotypes) existing among polymorphisms could drive down RF importance scores for particular SNPs—as RF might select any SNP from within a haplotype at a particular node. Indeed, the IL-4 SNP in our final model was part of a group of four SNPs in IL-4 having nearly identical importance scores, and Haploview analysis showed them to be in high linkage disequilibrium (LD), providing evidence that these genetic polymorphisms are inherited as a haplotype [26].
158
Considering the attributes included in our final model, all three proteomic attributes were ranked in the top 1% relative to all attributes in the combined dataset, and the IL-4 SNP (rs#2243290) was ranked in the top 5% relative to all attributes in the combined dataset. Relative to its respective data type, the IL-4 SNP was ranked in the top 1% among all attributes in the genetic dataset.
Table 1: List of all attributes having a Random Forest importance rank in the top 10% relative to all attributes in the combined dataset. The list is organized by the attribute symbol given in the first column. (Continued on subsequent pages) Symbol [rs# for SNP] AHR [rs7796976] ALCAM ANGPT4 APAF1 [rs2288729] APOA4 [rs1042034] BDNF BLC (CXCL13) BLM [rs235768] BRCA1 [rs144848] BTC BTG2 CASR [rs1001179] CBR3 [rs881712] CCL1 CCL14 CCL16 CCR2 [rs1799865] CCR2 [rs4987053] CDKN1C [rs3731249] CSF1 (MCSF) CSF1R CSF2 (GMCSF) CSF3 (GCSF) CTACK (CCL27) CTH [rs473334] CTH [rs515064] CTH [rs663649] CX3CL1 CYP1A1 [rs2472299] EGF EOT (CCL11) EOT2 (CCL24) EOT3 (CCL26)
Data Type Genetic Proteomic Proteomic Genetic Genetic Proteomic Proteomic Genetic Genetic Proteomic Proteomic Genetic Genetic Proteomic Proteomic Proteomic Genetic Genetic Genetic Proteomic Proteomic Proteomic Proteomic Proteomic Genetic Genetic Genetic Proteomic Genetic Proteomic Proteomic Proteomic Proteomic
Attribute Name Aryl hydrocarbon receptor Activated leukocyte cell adhesion molecule Angiopoietin 4 Apoptotic peptidase activating factor Apolipoprotein A-IV Brain-derived neurotrophic factor Chemokine (C-X-C motif) ligand 13 (B-cell chemoattractant) Bloom syndrome Breast cancer 1, early onset Betacellulin BTG family, member 2 Calcium-sensing receptor (hypocalciuric hypercalcemia 1) Carbonyl reductase 3 Chemokine (C-C motif) ligand 1 Chemokine (C-C motif) ligand 14 Chemokine (C-C motif) ligand 16 Chemokine (C-C motif) receptor 2 Chemokine (C-C motif) receptor 2 Cyclin-dependent kinase inhibitor 1C (p57, Kip2) Colony stimulating factor 1 (macrophage) Colony stimulating factor 1 receptor Colony stimulating factor 2 (granulocyte-macrophage) Colony stimulating factor 3 (granulocyte) Chemokine (C-C motif) ligand 27 Cystathionase (cystathionine gamma-lyase) Cystathionase (cystathionine gamma-lyase) Cystathionase (cystathionine gamma-lyase) Chemokine (C-X3-C motif) ligand 1 Cytochrome P450, family 1, subfamily A, polypeptide 1 Epidermal growth factor (beta-urogastrone) Chemokine (C-C motif) ligand 11 Chemokine (C-C motif) ligand 24 Chemokine (C-C motif) ligand 26
159
ERCC5 [rs1047768] FAS FASLG (TNFSF6) FASLG [rs929087] FGF1 FGF2 (FGFB) FGF4 FGF7 FST GATA3 [rs10905277] GCP2 (CXCL6) GDNF GRO2 (CXCL2) GRO3 (CXCL3) HGF HSD17B4 [rs384346] HSD17B4 [rs7737181] ICAM1 ICAM3 IFNG IGF1R IGF2 IGFBP1 IGFBP2 IGFBP3 IGFBP4 IL10 IL10 [rs1800871] IL13 IL15 IL15RA [rs859] IL17 IL1A IL1B IL1RL1 IL1RN IL2 IL2 [rs2069762] IL2 [rs2069763] IL2RA IL2RB IL2RG IL3 IL4 IL4 [rs2070874] IL4 [rs2243250] IL4 [rs2243268] IL4 [rs2243290] IL5RA IL6 IL7 IL8 IL9
Excision repair cross-complementing rodent repair deficiency, Genetic complementation group 5 Proteomic Fas (TNF receptor superfamily, member 6) Proteomic Fas ligand (TNF superfamily, member 6) Genetic Fas ligand (TNF superfamily, member 6) Proteomic Fibroblast growth factor 1 (acidic) Proteomic Fibroblast growth factor 2 (basic) Proteomic Fibroblast growth factor 4 (Kaposi sarcoma oncogene) Proteomic Fibroblast growth factor 7 (keratinocyte growth factor) Proteomic Follistatin Genetic GATA binding protein 3 Proteomic Chemokine (C-X-C motif) ligand 6 (granulocyte chemotactic protein 2) Proteomic Glial cell derived neurotrophic factor Proteomic Chemokine (C-X-C motif) ligand 2 Proteomic Chemokine (C-X-C motif) ligand 3 Proteomic Hepatocyte growth factor (hepapoietin A; scatter factor) Genetic Hydroxysteroid (17-beta) dehydrogenase 4 Genetic Hydroxysteroid (17-beta) dehydrogenase 4 Proteomic Intercellular adhesion molecule 1 (CD54), human rhinovirus receptor Proteomic Intercellular adhesion molecule 3 Proteomic Interferon, gamma Proteomic Insulin-like growth factor 1 receptor Proteomic Insulin-like growth factor 2 (somatomedin A) Proteomic Insulin-like growth factor binding protein 1 Proteomic Insulin-like growth factor binding protein 2, 36kDa Proteomic Insulin-like growth factor binding protein 3 Proteomic Insulin-like growth factor binding protein 4 Proteomic Interleukin 10 Genetic Interleukin 10 Proteomic Interleukin 13 Proteomic Interleukin 15 Genetic Interleukin 15 receptor, alpha Proteomic Interleukin 17 Proteomic Interleukin 1, alpha Proteomic Interleukin 1, beta Proteomic Interleukin 1 receptor-like 1 Proteomic Interleukin 1 receptor antagonist Proteomic Interleukin 2 Genetic Interleukin 2 Genetic Interleukin 2 Proteomic Interleukin 2 receptor, alpha Proteomic Interleukin 2 receptor, beta Proteomic Interleukin 2 receptor, gamma (severe combined immunodeficiency) Proteomic Interleukin 3 (colony-stimulating factor, multiple) Proteomic Interleukin 4 Genetic Interleukin 4 Genetic Interleukin 4 Genetic Interleukin 4 Genetic Interleukin 4 Proteomic Interleukin 5 receptor, alpha Proteomic Interleukin 6 (interferon, beta 2) Proteomic Interleukin 7 Proteomic Interleukin 8 Proteomic Interleukin 9
160
ITAC (CXCL11) KDR KIT (SCFR) KITLG (SCF) LEP LMO2 [rs2273797] LTA LTN (XCL1) MBL2 [rs11003125] MBL2 [rs1838066] MBL2 [rs5030737] MCP1 (CCL2) MCP2 (CCL8) MCP3 (CCL7) MCP4 (CCL13) MEC (CCL28) MIG (CXCL9) MIP1A (CCL3) MIP1B (CCL4) MIP1D (MAPKAP1) MIP3A (CCL20) MIP3B (CCL19) MMP7
Proteomic Proteomic Proteomic Proteomic Proteomic Genetic Proteomic Proteomic Genetic Genetic Genetic Proteomic Proteomic Proteomic Proteomic Proteomic Proteomic Proteomic Proteomic Proteomic Proteomic Proteomic Proteomic
MMP9 MPDU1 [rs2333227] MPIF1 (CCL23) MSH3 [rs3136228] MSH3 [rs32950] MTHFD2 [rs1667627] MTHFR [rs1801133] MTR [rs1801394] MTRR [rs1802059] NM NTF3 NTF5 OSM PAK6 [rs1136410] PARC PECAM1 PGF PIN1 [rs4744] RANTES (CCL5) RERG [rs6488766] RERG [rs767201] SAT2 [rs3924313] SCUBE2 [rs1010324] SDF1 (CXCL12) SELL SLC39A2 [rs2234636] SLC6A3 [rs2070424] SLC6A3 [rs6347] TARC (CCL17) TEP1 [rs1760898]
Proteomic Genetic Proteomic Genetic Genetic Genetic Genetic Genetic Genetic Proteomic Proteomic Proteomic Proteomic Genetic Proteomic Proteomic Proteomic Genetic Proteomic Genetic Genetic Genetic Genetic Proteomic Proteomic Genetic Genetic Genetic Proteomic Genetic
Chemokine (C-X-C motif) ligand 11 Kinase insert domain receptor (a type III receptor tyrosine kinase) V-kit Hardy-Zuckerman 4 feline sarcoma viral oncogene homolog KIT ligand Leptin (obesity homolog, mouse) LIM domain only 2 (rhombotin-like 1) Lymphotoxin alpha (TNF superfamily, member 1) Chemokine (C motif) ligand 1 Mannose-binding lectin (protein C) 2, soluble (opsonic defect) Mannose-binding lectin (protein C) 2, soluble (opsonic defect) Mannose-binding lectin (protein C) 2, soluble (opsonic defect) Chemokine (C-C motif) ligand 2 Chemokine (C-C motif) ligand 8 Chemokine (C-C motif) ligand 7 Chemokine (C-C motif) ligand 13 Chemokine (C-C motif) ligand 28 Chemokine (C-X-C motif) ligand 9 Chemokine (C-C motif) ligand 3 Chemokine (C-C motif) ligand 4 Mitogen-activated protein kinase associated protein 1 Chemokine (C-C motif) ligand 20 Chemokine (C-C motif) ligand 19 Matrix metallopeptidase 7 (matrilysin, uterine) Matrix metallopeptidase 9 (gelatinase B, 92kDa gelatinase, 92kDa type IV collagenase) Mannose-P-dolichol utilization defect 1 Chemokine (C-C motif) ligand 23 MutS homolog 3 (E. coli) MutS homolog 3 (E. coli) Methylenetetrahydrofolate dehydrogenase (NADP+ dependent) 2 5,10-methylenetetrahydrofolate reductase (NADPH) 5-methyltetrahydrofolate-homocysteine methyltransferase 5-methyltetrahydrofolate-homocysteine methyltransferase reductase Neutrophil migration Neurotrophin 3 Neurotrophin 5 (neurotrophin 4/5) Oncostatin M P21(CDKN1A)-activated kinase 6 P53-associated parkin-like cytoplasmic protein Platelet/endothelial cell adhesion molecule (CD31 antigen) Placental growth factor, vascular endothelial growth factor-related protein Protein (peptidyl-prolyl cis/trans isomerase) NIMA-interacting 1 Chemokine (C-C motif) ligand 5 RAS-like, estrogen-regulated, growth inhibitor RAS-like, estrogen-regulated, growth inhibitor Spermidine/spermine N1-acetyltransferase 2 Signal peptide, CUB domain, EGF-like 2 Chemokine (C-X-C motif) ligand 12 (stromal cell-derived factor 1) Selectin L (lymphocyte adhesion molecule 1) Solute carrier family 39 (zinc transporter), member 2 Solute carrier family 6 (neurotransmitter transporter, dopamine), member 3 Solute carrier family 6 (neurotransmitter transporter, dopamine), member 3 Chemokine (C-C motif) ligand 17 Telomerase-associated protein 1
161
TGFA TIMP1 TIMP2 TNF TNFRSF10A TNFRSF10D TNFRSF11A
Proteomic Proteomic Proteomic Proteomic Proteomic Proteomic Proteomic
TNFRSF14 (HVEM) TNFRSF1A TNFRSF21 (DR6) TNFSF7 (CD27) TNFSF8 (CD30) TSG101 [rs2045224] TSG101 [rs2045224] TSG101 [rs2045224] VEGF
Proteomic Proteomic Proteomic Proteomic Proteomic Genetic Genetic Genetic Proteomic
Transforming growth factor, alpha TIMP metallopeptidase inhibitor 1 TIMP metallopeptidase inhibitor 2 Tumor necrosis factor (TNF superfamily, member 2) Tumor necrosis factor receptor superfamily, member 10a Tumor necrosis factor receptor superfamily, member 10d Tumor necrosis factor receptor superfamily, member 11a, NFKB activator Tumor necrosis factor receptor superfamily, member 14 (herpesvirus entry mediator) Tumor necrosis factor receptor superfamily, member 1A Tumor necrosis factor receptor superfamily, member 21 Tumor necrosis factor (ligand) superfamily, member 7 Tumor necrosis factor (ligand) superfamily, member 8 Tumor susceptibility gene 101 Tumor susceptibility gene 101 Tumor susceptibility gene 101 Vascular endothelial growth factor
162
Figure 2: Attribute importance “landscape” showing the shape of the importance curve ranking all attributes in the combined (genetic plus proteomic) dataset. Attributes above the horizontal line indicate a relative importance rank in the top 10% (90th percentile) of all attributes in the dataset. Attributes of high importance resulted in greater reduction of impurity (Gini) than attributes of low importance, as measured by the out-of-bag importance procedure.
163
Modeling the association of genetic and proteomic biomarkers with adverse events Having filtered out the noise using Random Forests, we used a decision tree representation to explore interactions among the attributes in our filtered list related to AE status. The final decision tree model is shown in Figure-3. Our final model included four variables—three proteomic attributes and one genetic attributes. Change in ICAM-1 concentration comprises the root node of the tree, with subsequent nodes composed of change in IL-10 concentration, a SNP in IL4, and change in CSF-3 concentration. Imposing our minimum of five individuals per terminal (AE status) leaf, this tree correctly classifies 89% of individuals (with 5 AE misclassifications and 2 non-AE misclassifications).
164
ICAM-1
Non-AE (28/1)
IL-10
IL-4 SNP
AE (5)
CC
AC or AA
Non-AE (15/3)
CSF-3
Non-AE (7/2)
AE (6/1)
Figure 3: Final model of genetic and proteomic factors contributing to AE development. Each node (oval) constitutes a decision point based upon the genotype of genetic attributes (IL-4 SNP) or whether the concentration change from baseline in proteomic attributes (ICAM-1, IL-10, CSF-3) is above (upwardpointing arrows) or below (downward-facing arrows) a threshold (calculated by choosing the most informative value from among a set of possible values generated for each particular split). Starting at the root node (ICAM-1), subjects are classified into AE status leaves (rectangles) by proceeding along the decision points at each attribute node. Given below each terminal leaf is the total number of subjects classified into that AE status group / the number of subjects incorrectly assigned to that AE status group.
Figure-4 characterizes the biological relationships among the attributes in the tree using Chilibot. Interactive relationships are characterized into one of three types based upon the verbs connecting pairs of attributes in the biomedical literature: 1. stimulatory relationships are connected by verbs such as “activate”, 165
“stimulate”, or “enhance”, 2. inhibitory relationships are connected by verbs such as “decrease”, “attenuate”, or “inhibit”, and relationships are characterized as neutral when the nature of the relationship cannot be contextually determined. Mining the biomedical literature suggested interactive relationships connecting all of the attribute nodes in our final model. Stimulatory, inhibitory, and neutral pairwise interactive relationships were identified between each of ICAM-1, IL-10, IL4, and CSF-3. Thorough examination of the networks inferred facilitated the biological interpretation of the final model discussed below.
166
ICAM-1
IL-10
IL-4
CSF-3 Figure 4: Biological relationships among the attributes in our final model characterized using Chilibot. Connections between each attribute node (oval) are colored according to the type of interactive relationship they represent: stimulatory (green), both stimulatory and inhibitory (orange), or neutral (gray). Arrows indicate that interactions between particular biological attributes are bidirectional. For each connection, 50 abstracts containing both terms were processed to determine the nature of interactive relationship.
167
Discussion Our final model provides an immunologically plausible and testable biological mechanism of AE occurrence after smallpox vaccination that includes both genetic and proteomic factors. The analytical strategy used is appropriate for the study of complex phenotypes, since outcomes such as AE development likely result from the interplay of multiple genetic, proteomic, and environmental factors [27,28]. The decision tree trained on the attributes passing our RF filter proposes a solid biological model of adverse event development. The attributes included in this tree point to an important role of one particular immune cell type: monocytes.
Monocytes are bone marrow-derived
circulating blood cells that are precursors of tissue macrophages. Monocytes are actively recruited to sites of inflammation, where they differentiate into macrophages in tissues. These macrophages play important roles in both innate and adaptive immune responses.
Macrophages are activated by microbial
products such as endotoxin and by T cell cytokines such as IFN-γ. Activated macrophages phagocytose and kill microorganisms, secrete pro-inflammatory cytokines, and present antigen to helper T cells. Macrophages assume different morphologic forms in different tissues, which might have an important impact in system-wide responses such as the AEs studied here. The root node of the tree is ICAM-1 (CD54), where small changes from baseline concentration (11%) point toward AE risk—depending on factors in subsequent nodes. 168
ICAM-1 is mainly
expressed on endothelial cells, T cells, B cells, and monocytes. It functions in cell-cell adhesion, which plays a crucial role in monocyte differentiation into macrophages, as entry into tissues is necessary.
Additionally, ICAM-1
expression is upregulated in mature monocytes [29], aiding in cell adhesion and the eventual differentiation into macrophages.
Circulating monocytes are in
random contact with endothelial cells, and the adhesion molecule E-selectin slows the monocyte by inducing rolling of the monocyte along the endothelial surface before firm attachment to vascular cell adhesion molecule 1 (VCAM-1) or intercellular adhesion molecule 1 (ICAM-1), which interact with integrins on the monocyte surface. Once the monocyte is tightly bound, it then migrates between endothelial cells [30,31].
High levels of
ICAM-1
might
indicate an
“overrecruitment” of monocytes into tissue, triggering an unnecessarily active innate inflammatory response. For individuals with large positive changes in ICAM-1, the next node in the tree is IL-10, where changes from baseline greater than 85% are associated with AEs.
IL-10 is produced by activated macrophages and some helper T cells
whose major function is to inhibit activated macrophages and therefore maintain homeostatic control of innate and cell-mediated immune reactions. Changes in IL-10 levels may indicate an imbalance in this delicate homeostasis leading to AEs. Since our cytokine levels are measured within one week of immunization, the high levels of IL-10 secreted into the systemic compartment (serum) might indicate an overabundance of activated macrophages during the acute phase contributing to AE development.
Eventually, sufficiently high levels of IL-10
169
should “calm” the macrophage response, so if cytokines were measured at a later time point (e.g. two weeks post-immunization), it is probable that IL-10 levels would return toward baseline. Additionally, high levels of IL-10 have been shown to inhibit the production of other cytokines by monocytes [32], implying that monocytes may not be recruiting proper T helper cell response to balance the acquired and innate reactions. For individuals with mild changes in IL-10 concentration, the next node is a SNP in the gene encoding IL-4. IL-4 is a cytokine produced mainly by the TH2 subset of CD4+ helper T cells whose functions include induction of differentiation of TH2 cells from naïve CD4+ precursors, stimulation of IgE production by B cells, and suppression of IFN-γ-dependent macrophage functions [33,34]. While direct functional significance of the SNP is unknown, it is reasonable that the different genotypes could result in functionally different versions of the IL-4 protein, or in different bioavailability levels of IL-4.
The fact that multiple SNPs in IL-4
achieved nearly identical importance scores indicates that there may be LD blocks of variation within the IL-4 gene region associated with AE development (see Chapter IV). Because of the intricate cross-talk between macrophages and the TH2 response in maintaining homeostasis, it is plausible that the major IL-4 genotype (CC) is associated with calming the activated macrophage response and directing the acquired immune system to progress in response to vaccine presentation, while the variant genotypes (AC or AA) fail to calm the innate response—presenting increased AE risk.
170
For individuals having one of the variant genotypes at IL-4, the lowest node of the tree is CSF-3 (GCSF). GCSF is a cytokine produced by activated T cells, macrophages, and endothelial cells at sites of infection that acts on bone marrow to increase production of and mobilize neutrophils to replace those consumed in inflammatory reactions. In our model, increased levels of CSF-3 after vaccination (change > 78%) indicated increased risk of suffering an AE. This implies another over-recruitment in the development of AEs, as neutrophils have been associated with host tissue damage and failure to terminate acute inflammatory responses [35]. This over-reaction is consistent with the types of AE symptoms observed in the current study and with the overall proposed biological mechanisms of AE development. The results of this study provide a viable biological mechanism of AE occurrence after smallpox vaccination that is experimentally testable. Our model includes both genetic and proteomic biomarkers. Allowing for such an integrative model is an important strength of our analytical strategy.
It is increasingly
recognized that the pathophysiology of complex clinical outcomes hinges on biological factors acting on multiple levels [36]. Therefore, the formulation of robust etiological models must take this inherent complexity into account and capitalize on the power of modern experimental data-generating techniques. Together with previous studies on immunological response to smallpox vaccination, we conclude that AEs result from hyperactivation of inflammatory signals leading to excess recruitment and stimulation of monocytes in peripheral tissues.
Our analysis identifies a set of interacting genetic and proteomic
171
candidates associated with AEs: ICAM-1, IL-10, IL-4, and CSF-3. Since the proteomic measurements occurred early in the period after vaccination—before most AEs presented themselves clinically—our model could be used as a diagnostic tool in the prediction of adverse events. Of course, the ultimate goal of such a study is the identification and characterization of biological risk factors contributing to the inappropriate immune response to vaccination. We present a mechanism of AE development that targets specific players within the systemic inflammatory pathway for further study. Future studies will test our hypothesis at the bench.
The functional
consequences of genetic variability in IL-4 related to bioavailability and overall concentration must be fully characterized.
Time-series studies with dense
measurement points are needed to shed light on the dynamic interplay between the signaling of ICAM-1, IL-10, and CSF-3. Additional data is needed on the effects of these cytokines in other physiological compartments. It is hoped that this study will convince all future work on this subject to adopt an experimental approach that rightfully takes the broader spatial and temporal physiological context of complex biological systems into account.
172
Acknowledgments
This work was supported by the National Institutes of Health (NIH)/National Institute of Allergy and Infectious Diseases (NIAID), Vaccine Trials and Evaluation Unit (contract N01-AI-25462, study DMID 02-054); NIH/NIAID (grants R21-AI-59365).
References
1.
Kemper AR, Davis MM, Freed GL: Expected adverse events in a mass smallpox vaccination campaign. Eff Clin Pract 2002, 5: 84-90.
2.
Breiman L: Random forests. Machine Learning 2001, 45: 5-32.
3.
Lunetta KL, Hayward LB, Segal J, Van EP: Screening large-scale association study data: exploiting interactions using random forests. BMC Genet 2004, 5: 32.
4.
Robnik-Sikonja M: Improving random forests. Machine Learning: Ecml 2004, Proceedings 2004, 3201: 359-370.
5.
McKinney BA, Reif DM, Rock MT, Edwards KM, Kingsmore SF, Moore JH et al.: Cytokine Expression Patterns Associated with Systemic Adverse Events following Smallpox Immunization. J Infect Dis 2006, 194: 444-453.
6.
Rock MT, Yoder SM, Talbot TR, Edwards KM, Crowe JE, Jr.: Adverse events after smallpox immunizations are associated with alterations in systemic cytokine levels. J Infect Dis 2004, 189: 1401-1410.
7.
Rock MT, Yoder SM, Talbot TR, Edwards KM, Crowe JE, Jr.: Cellular Immune Responses to Diluted and Undiluted Aventis Pasteur Smallpox Vaccine. J Infect Dis 2006, 194: 435-443.
8.
Talbot TR, Stapleton JT, Brady RC, Winokur PL, Bernstein DI, Germanson T et al.: Vaccination success rate and reaction profile with diluted and undiluted smallpox vaccine: a randomized controlled trial. JAMA 2004, 292: 1205-1212.
173
9.
Talbot TR, Bredenberg HK, Smith M, LaFleur BJ, Boyd A, Edwards KM: Focal and generalized folliculitis following smallpox vaccination among vaccinia-naive recipients. JAMA 2003, 289: 3290-3294.
10.
Chanock SJ. Core Genotyping Facility. National Cancer Institute. http://cgf.nci.nih.gov/home.cfm 2004. Gaithersburg, MD, USA.
11.
Kader HA, Tchernev VT, Satyaraj E, Lejnine S, Kotler G, Kingsmore SF et al.: Protein microarray analysis of disease activity in pediatric inflammatory bowel disease demonstrates elevated serum PLGF, IL-7, TGF-beta1, and IL-12p40 levels in Crohn's disease and ulcerative colitis patients in remission versus active disease. Am J Gastroenterol 2005, 100: 414-423.
12.
Perlee L, Christiansen J, Dondero R, Grimwade B, Lejnine S, Mullenix M et al.: Development and standardization of multiplexed antibody microarrays for use in quantitative proteomics. Proteome Sci 2004, 2: 9.
13.
Schweitzer B, Wiltshire S, Lambert J, O'Malley S, Kukanskis K, Zhu Z et al.: Inaugural article: immunoassays with rolling circle DNA amplification: a versatile platform for ultrasensitive antigen detection. Proc Natl Acad Sci U S A 2000, 97: 10113-10119.
14.
Schweitzer B, Roberts S, Grimwade B, Shao W, Wang M, Fu Q et al.: Multiplexed protein profiling on microarrays by rolling-circle amplification. Nat Biotechnol 2002, 20: 359-365.
15.
Breiman L, Friedman JH, Olshen RA, Stone CJ: Classification and Regression Trees. New York: Chapman & Hall; 1984.
16.
Province MA, Shannon WD, Rao DC: Classification methods for confronting heterogeneity. Adv Genet 2001, 42: 273-286.
17.
Breiman L: Random forests. Machine Learning 2001, 45: 5-32.
18.
Bureau A, Dupuis J, Falls K, Lunetta KL, Hayward B, Keith TP et al.: Identifying SNPs predictive of phenotype using random forests. Genet Epidemiol 2005, 28: 171-182.
19.
McKinney BA, Reif DM, Ritchie MD, Moore JH: Machine Learning for Detecting Gene-Gene Interactions: A Review. Appl Bioinformatics 2006, 5: 77-88.
20.
Witten IH, Frank E: Data Mining: Practical Machine Learning Tools and Techniques, 2nd edn. San Francisco, California: Morgan Kaufmann; 2005.
21.
Ihaka R, Gentleman R: R: A Language for Data Analysis and Graphics. Journal of Computational and Graphical Statistics 1996, 5: 299-314.
174
22.
R Development Core Team. R: A Language and Environment for Statistical Computing. R Foundation for Statistical Computing. http://www.R-project.org 2006. Vienna, Austria.
23.
Breiman L, Cutler A. Random Forests. http://www.stat.berkeley.edu/~breiman/RandomForests/cc_home.htm 2004.
24.
Reif DM, Motsinger AA, McKinney BA, Crowe JE, Jr., Moore JH: Feature Selection using a Random Forests Classifier for the Integrated Analysis of Multiple Data Types. Proceedings of the IEEE Symposium on Computational Intelligence in Bioinformatics and Computational Biology 2006, in press.
25.
Chen H, Sharp BM. Content-rich biological network constructed by mining PubMed abstracts. BMC Bioinformatics 2004, 5: 147-160.
26.
Barrett JC, Fry B, Maller J, Daly MJ: Haploview: analysis and visualization of LD and haplotype maps. Bioinformatics 2005, 21: 263-265.
27.
Moore JH: The ubiquitous nature of epistasis in determining susceptibility to common human diseases. Hum Hered 2003, 56: 73-82.
28.
Wilke RA, Reif DM, Moore JH: Combinatorial pharmacogenetics. Nat Rev Drug Discov 2005, 4: 911-918.
29.
Most J, Schwaeble W, Drach J, Sommerauer A, Dierich MP: Regulation of the expression of ICAM-1 on human monocytes and monocytic tumor cell lines. J Immunol 1992, 148: 1635-1642.
30.
Peters W, Charo IF: Involvement of chemokine receptor 2 and its ligand, monocyte chemoattractant protein-1, in the development of atherosclerosis: lessons from knockout mice. Curr Opin Lipidol 2001, 12: 175-180.
31.
Zittermann SI, Issekutz AC: Basic fibroblast growth factor (bFGF, FGF-2) potentiates leukocyte recruitment to inflammation by enhancing endothelial adhesion molecule expression. Am J Pathol 2006, 168: 835846.
32.
Eslick J, Scatizzi JC, Albee L, Bickel E, Bradley K, Perlman H: IL-4 and IL10 inhibition of spontaneous monocyte apoptosis is associated with Flip upregulation. Inflammation 2004, 28: 139-145.
33.
Mangan DF, Robertson B, Wahl SM: IL-4 enhances programmed cell death (apoptosis) in stimulated human monocytes. J Immunol 1992, 148: 1812-1816.
175
34.
Soruri A, Kiafard Z, Dettmer C, Riggert J, Kohl J, Zwirner J: IL-4 downregulates anaphylatoxin receptors in monocytes and dendritic cells and impairs anaphylatoxin-induced migration in vivo. J Immunol 2003, 170: 3306-3314.
35.
Serhan CN, Savill J: Resolution of inflammation: the beginning programs the end. Nat Immunol 2005, 6: 1191-1197.
36.
Hood L: Systems biology: integrating technology, computation. Mech Ageing Dev 2003, 124: 9-16.
176
biology,
and
CHAPTER VII
CONCLUSIONS AND FUTURE DIRECTIONS
This dissertation describes the development and implementation of a comprehensive analysis paradigm wherein experimental data of multiple types is integrated for the study of complex phenotypes. This strategy was applied to genetic and proteomic data in both simulated and real analysis situations. The successful application to combined genetic and proteomic data from smallpox vaccine studies supports the hypothesis that such integrated approaches provide a comprehensive portrayal of the mechanisms underlying complex phenotypes and lend confidence to the biological interpretation of analytical conclusions. The next steps in elucidating the development of adverse events after smallpox vaccination will involve testing the candidate biomarkers at the bench— taking into account their respective genetic or proteomic context. The functional consequences of genetic variability in IL-4, IRF-1, and MTHFR must be characterized with respect to bioavailability, activity, and overall concentration. Functional genetic studies should be carried out in experimental conditions that stimulate the inflammatory pathways highlighted by the work presented here. Focused studies should be undertaken to describe the variability in all of the AEassociated genomic regions, especially for those in which multiple SNPs were identified.
177
Dense time-series studies are needed to clarify the dynamic interplay between the signaling of ICAM-1, IL-10, CSF-3, eotaxin, MIG, TIMP-2, and SCF, as well as the protein products of IL-4, IRF-1, and MTHFR. Proteomic studies should be performed in environments wherein the relevant genetic background has been established.
Additional data is needed on the effects of these
cytokines in other physiological compartments outside the serum. The ultimate test of these results will be their assessment in large-scale, independent cohorts.
From an epidemiological perspective, the studies
discussed here involve relatively small samples and represent a very narrow slice of demographic characteristics such as race and age. Future studies will need to evaluate whether these conclusions generalize to populations at-large, or if they only apply to certain subsets. Perhaps the most important aspect of future studies would be the collection of additional types of information on study subjects. Besides the other types of data that could be collected on the genetic and proteomic levels (e.g. genomic methylation status and enzymatic activity, respectively), information on circulating mRNA concentrations, immunological effector cell morphologies, and spatial bioactivity may prove useful. Outside of biological data, information on subjects’ lifestyles, dietary intakes, and any other plausible environmental factors should be gathered. For any type of data collected, careful consideration must be given to the particular variables measured—these results are suggestive of particular immunological pathways, and variables should be selected to provide comprehensive coverage of variation in these pathways.
178
Once these additional data are available, extension and refinement of analytical methods can proceed. Simulation studies should assess alternative variable selection strategies within the RF framework, such as joint variable permutation methods.
Other promising analytical methods, such as those
employing evolutionary computation or prior domain knowledge, should also be explored as techniques for integrating multiple data types. As the number of data types increases, an important issue arises with respect to effectively integrating massive amounts of disparate information. Statistical modeling techniques aside, meaningfully interpreting the results of multifaceted models demands expertise in each of the experimental domains considered. While this will foster the evolution of interdisciplinary research, tools will be needed that allow communication in a standardized manner.
The
development of such tools depends on the adoption of consistent language so that databases can present information that is standardized across both experiments and disciplines. Considering the rapid progress in experimental technologies able to reliably generate vast quantities of data, as well as continual improvements in cost efficiency, it is expected that comprehensive datasets—including multiple types of experimental information—will become commonplace in the near future. It is hoped that the positive conclusions from this dissertation will help spur the adoption of an experimental approach that rightfully takes the broader spatial and temporal physiological context of complex biological systems into account.
179