In vivo and noninvasive measurement of a songbird head’s optical properties Stéphane Ramstein, Clémentine Vignal, Nicolas Mathevon, and Stéphane Mottin
By assessing the cerebral blood volume and the hemoglobin oxygen saturation level, near-infrared spectroscopy (NIRS) probes brain oxygenation, which reflects cerebral activity. To develop a noninvasive method monitoring the brain of a songbird, we use an original NIRS device, i.e., a white laser coupled with an ultrafast spectrotemporal detector of optical signals without wavelength scanning. We perform in vivo measurements of the absorption coefficient and the reduced scattering coefficient of the caudal nidopallium area of the head of a songbird (the zebra finch). © 2005 Optical Society of America OCIS codes: 170.3660, 170.7160, 300.6500, 170.7050, 300.1030, 170.1580.
1. Introduction
Monitoring brain activity is crucial to understanding cerebral processing of sensory stimulations. For this purpose, experimental devices have been developed for animal models, and the success of these investigations relies on the adequacy of several complementary apparatuses used with a biological model. Songbirds are the models of choice for the study of vocal communication and sound processing.1,2 The brain structures that enable the songbirds to produce and to perceive vocal sounds1,3 have been well studied. Three main approaches are employed to explore the neurophysiological mechanisms of sound perception in songbirds. First, postmortem immunocytochemical studies that follow the sound-induced expression of immediate early genes, such as zenk, contribute to the identification of anatomically welldefined activated areas3,4 but require the sacrifice of birds. Second, in vivo electrophysiological investigations allow real-time recordings of the activity of a
S. Ramstein, C. Vignal (
[email protected]), and S. Mottin are with the Laboratoire Traitement du Signal et Instrumentation, Centre National de la Recherche Scientifique, Unité Mixte de Recherche 5516, Université Jean Monnet, Saint-Etienne, France. C. Vignal and N. Mathevon are with the Equipe Communications Acoustiques, Laboratoire Neurobiologie de l’Apprentissage, de la Mémoire et de la Communication, Centre National de la Recherche Scientifique, Unité Mixte de Recherche 8620, Université Paris XI, Orsay, France, and Laboratoire Ecologie et Neuro-Ethologie Sensorielles, Université Jean Monnet, Saint-Etienne, France. Received 5 January 2005; revised manuscript received 16 May 2005; accepted 26 May 2005. 0003-6935/05/296197-08$15.00/0 © 2005 Optical Society of America
few neurons to be made but need surgically prepared birds.5,6 Third, magnetic resonance imaging (MRI) of anesthetized birds reveals functional properties of some brain vocal regions7 and provides noninvasive high-resolution images, but it remains difficult to interpret MRI results quantitatively in terms of parameters that express neuronal activity such as cerebral blood flow, cerebral blood volume (CBV), or the hemoglobin oxygen saturation level 共HbO2兲兾共HBtotal兲, StO2. Thus there is a need for a neuromethod for the quantification of direct indices of the brain activity of songbirds in a real-time and noninvasive manner. By direct measurements of endogenous chromophores such as hemoglobins,8,9 near-infrared spectroscopy (NIRS) is known potentially to permit the noninvasive monitoring of brain oxygenation that is assumed to reflect neuronal activity. For this reason, NIRS has been widely used since the pioneering work of Jöbsis10 to study brain oxygenation. Several studies have performed optical probing of small-animal brain oxygenation,9,11 and NIRS has now begun to be employed complementarily with MRI.12 The spectroscopy of cerebral tissues through intact skull and skin is possible owing to the weak absorption of biological tissues in the visible–near-infrared spectral window. During its propagation, the light’s intensity decreases according to the concentration of the absorbing chromophores. As a consequence, the information about oxygenation is likely to be deduced from the measurement of light absorption. The drawback is that tissues are highly scattering media because of the presence of a great variety of intracellular organels of different sizes, such as mitochondria and cell nuclei.13,14 Besides absorption by the chromophores, scattering is another important source of 10 October 2005 兾 Vol. 44, No. 29 兾 APPLIED OPTICS
6197
light decrease, which makes the absorption measurement rather complicated. For the quantitative measurement of absorption into scattering media, three optical analyses have been tried15: steady-state, frequency-domain, and time-domain NIRS. The optical systems for these measurements are often complex, as are the algorithms for the inverse mathematical problem of recovering the absorption and scattering coefficients of tissues. Moreover, depending on the number of chromophores to be measured, optical measurements are performed with one, two, or several wavelengths.16 –18 For 15 years, many designs and processing algorithms have been developed to measure brain oxygenation but have with difficulty succeeded in measuring the in vivo absolute concentrations of chromophores.12,19,20 The limitations are due, first, to tissues’ spatial heterogeneity, which is linked to the complex layered structure of the head, including scalp, skull, cerebrospinal fluid, and brain, and, second, to tissues’ molecular heterogeneity, explained by the presence of various chromophores such as different forms of hemoglobins, lipids, and water. Recently some authors succeeded in determining human brain optical coefficients.18 By using a two-layered model that includes scalp and skull built on MRI images of the same human head, their twowavelength approach allowed them to estimate the oxygenation of tissues. In numerous clinical works efforts were made to develop NIRS methods to permit the absolute quantification of brain optical coefficients in fetuses and neonates (reviewed by Nicklin et al.21). These studies led to technical progress mainly in steady-state NIRS and frequency-domain NIRS. To take part in the improvement of the measurement of endogenous chromophores, we have chosen to strengthen the temporal method device by using ultrafast detection of optical signals coupled with a femtosecond white laser.22 This provides a multiwavelength analysis on a broad continuous spectral window without scanning. The large number of wavelengths provided by the white laser promises better accuracy in the determination of oxygenation by fitting all the spectra of the different hemoglobins. Moreover, it should give some access to other chromophores of interest, such as cytochromes. The optical system has already been validated in a homogeneous optical phantom23 and for real-time in vivo measurements of the rat brain’s optical properties, invasively24 and noninvasively.22,23,25 According to the observed need for developing a method to permit the noninvasive quantification of direct indices of brain activity of songbirds, we have chosen to make real-time in vivo measurements of the optical properties of the brain of a songbird, the zebra finch (Taeniopygia guttata). Because it represents a model system in comparative neurobiology for the study of the neural basis of sound perception and discrimination, this bird will be of great interest for further investigations of variations in brain oxygenation in response to acoustic stimuli. In particular, the brain region of the caudal nidopallium (see Ref. 26 for the nomenclature of the avian brain and Fig. 1 for an 6198
APPLIED OPTICS 兾 Vol. 44, No. 29 兾 10 October 2005
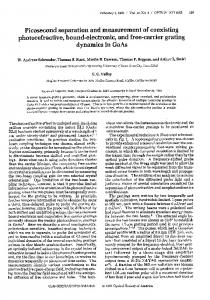
Fig. 1. (a) Stereotaxy of the zebra finch for broadband timeresolved spectroscopy. To clarify the stereotaxy, we observe the position of the head of the bird on a head previously plucked and fixed with formaldehyde. Plane 0 is the vertical plane passing through the interaural line and the external visible caudal bump corresponding to the origin point (0,0,0), also intersecting the sagittal midline. The first optical fiber (F1) guiding the effects of the white laser is placed closer to the rostrum than the second optical fiber (F2), collecting the light after propagation but on the same sagittal line. (b) Positions of the new anatomical internal references, of the caudal nidopallium and of the cerebellum according to our origin point on a sagittal section of an entire bird’s head previously fixed with formaldehyde. (c) Top view of the head of the zebra finch, showing the positions of the optic fibers according to the origin point. Axes X and Y used for the stereotaxic coordinates are shown.
approximate location in the songbird’s brain) has been implicated in the acoustic processing of vocalizations and is assumed to play a major role in the mammalian neocortexlike cognitive functions of the avian pallium.26 We describe in this paper the measurement of the optical properties of the zebra finch’s caudal nidopallium. The results of the present study constitute the basis of our next investigations about variations in brain oxygenation during sound processing by songbirds. 2. Materials and Methods A. Preparation of the Animals and Positioning of the Fiber Probes
This study is based on experiments performed on four female zebra finches (20 g body weight). These birds
were bred in our aviary (12 h light–12 h dark photoperiod with adapted wavelengths; food and water ad libitum; temperature 23 °C to 25 °C). The experimental protocols have been approved by the animal care committee of the Université Jean Monnet. Animals with the feathers previously plucked from their heads (three days before the experiments) are anesthetized in an isoflurane chamber (3%, at a flow rate of 900 mL兾min). The head of the bird is fixed in a stereotaxic frame (Stoelting Company) adapted for birds. The birds are kept anesthetized and breathing spontaneously through an isoflurane mask (2%, at a flow rate of 600 mL兾min). The body temperature is kept constant at 39 °C by a feedback-controlled heating pad. All birds have had free access to food and water before anesthesia. For head transillumination, optical fibers (core diameter, 400 m; numerical aperture, 0.4; length, 30 cm) are fixed into stereotaxic manipulators (Stoelting Company) and placed on the skin of the animal. To position the optical fibers, we need stereotaxic references. Classic avian stereotaxy suggests the use of the two ears fixed with rods and the beak fixed in the mask.27,28 To our best knowledge no stereotaxic atlas has yet been published for the zebra finch. To monitor brain activity in the caudal nidopallium we have developed a precise and reproducible procedure for placing the optical fibers appropriately on the skin. The classic stereotaxic design with the head placed horizontally29 or at 45° from the vertical axis of the stereotaxic instrument28 is not well suited. Consequently, the head of the bird is turned until the beak (rostral extremity) is perpendicular to the body plane [Fig. 1(a)]. In contrast to what is usually found in atlases, we choose a new stereotaxic origin point (0,0,0): It corresponds to the intersection of the vertical plane passing through the interaural line (plane 0) and the sagittal suture. This is a convenient point because it is delineated by a precise and well-defined external visible bump [Figs. 1(a) and 1(c)]. The stereotaxic axes are chosen in relation to this origin point [Fig. 1(c)]: X corresponds to the axis of the interaural line, Y corresponds to the axis of the sagittal suture, and Z is normal to Y and X. To localize the caudal nidopallium according to our new stereotaxic origin point we obtain a sagittal section of an entire bird’s head, previously fixed with formaldehyde, with a fine band saw. This section [Fig. 1(b)], localized at 300 m of the sagittal midline, shows that the caudal part of the head of the bird is quasi-spherical, with a diameter of 15 mm, and allows us to observe anatomical internal references [Fig. 1(b)]: the axis of the top jaw, the longitudinal axis of the cerebellum, and the ventral side of the brain. The caudal nidopallium can be related to the origin point (0,0,0). The positions of the two fibers (source and collection fibers) are chosen consequently for optimal optical probing of the caudal nidopallium of the right-hand hemisphere and minimize the absorption of light that is due to the sagittal venous sinus, the cerebellum, and the higher skull thickness in the caudal part above the cerebellum. The head volume probed by the light depends greatly
on this positioning. Numerical simulations based on a steady-state analytical closed-form Green’s function30 for a semi-infinite geometry show that the distance between the two fibers must be fixed to ⬃5 mm to facilitate wide probing of the caudal nidopallium. The first optical fiber (F1) guides the white laser on the head. It is placed closer to the rostrum than the second optical fiber (F2), which collects the light after propagation through the head [Figs. 1(a) and 1(c)]. Figure 1 shows the final positions of the source fiber and the collecting fiber. F1 is placed 2.0 mm from sagittal suture and 5.4 mm from the interaural line. F2 is placed 2.0 mm from the midline and 0.4 mm from the interaural line. Consequently, F1 and F2 are on the same sagittal line. The coordinates, in millimeters, are F1 共2.0, 5.4, ⫺2.7兲 and F2 共2.0, 0.4, ⫺0.3兲, according to the origin point (0, 0, 0) and the XYZ axes. The light beam crosses a total of 1.2 mm of head tissues (skin, skull, meningia, hippocampus) before reaching the caudal nidopallium [Fig. 1(b)]. Each of the four animals is exposed to the laser light for 30 min under anesthesia. During this time, baseline optical parameters are acquired. B. Broadband Femtosecond Time-Resolved Spectrometer Setup
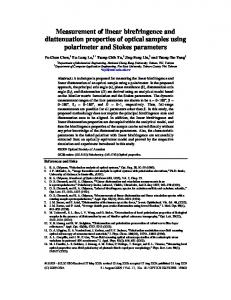
The broadband spectroscopic device31 is described in Fig. 2. It is composed of an ultrafast white laser and a time-resolved spectrometer. This spectrotemporal apparatus is designed to perform a noninvasive quantitative determination of molecular concentrations in highly turbid media. The laser source is a mode-locked Ti:sapphire oscillator (Coherent Model Vitesse XT; 820 nm, 50 fs) followed by a chirped pulse amplifier (Thales Model Alpha 1000). After the compression stage the system produces 0.5 mJ–170 fs pulses (FWHM autocorrelator pulse check–pulse scope) at a repetition rate of 1 kHz. The pump beam is focused into pure water (focal length, 21 cm), which generates a 250 mW white-light continuum32 (Coherent powermeter used for power integration on all the emitted wave-
Fig. 2. Experimental setup for bird head transillumination. After chirped pulse amplification (CPA), a white-light continuum is generated and injected into the bird’s head via an optical fiber. Another optical fiber collects the propagated light and leads it toward a broadband time-resolved spectrometer, which is composed of a polychromator and a single-shot streak camera. 10 October 2005 兾 Vol. 44, No. 29 兾 APPLIED OPTICS
6199
lengths). This broadband source extends 500 nm, from 450 to 950 nm.33 An optical-density filter attenuates the light below 1 mW at the fiber output to prevent tissue damage and detector saturation. Finally the light is injected into an optical fiber (core diameter, 400 m; numerical aperture, 0.4; length, 30 cm) for brain transillumination measurements. In this way the tissues are illuminated with a 10 J mm⫺2 pulse energy. The threshold energy leading to tissue hemorrhage was evaluated,34 and its magnitude is 100 J mm⫺2 for the same type of pulse (100 fs, 1 kHz, 800 nm). After propagation through the bird’s head, the light is collected by an identical optical fiber and led toward a time-resolved spectrometer. Its main component is a single-shot streak camera (Hamamatsu Streakscope C4334). This camera measures the time of propagation of the photons through tissues with 4 ps time resolution per pixel during 1.921 ns. A polychromator (270M, Spex JobinYvon) disperses the light before the camera to facilitate spectral analysis. We acquire the instrumental response function (IRF) before and after the experiment (Fig. 3) by measuring the white laser with the time-resolved spectrometer. This gives the characteristics of the apparatus, which are used for image processing. Figures 4 and 5 show that the detection system has a 176 nm spectral window width from 672.5 to 845.3 nm and a temporal resolution of 25 ps. This temporal resolution is the resolution of the alltime-resolved spectrometer that takes into account the time response of the camera and the triggering fluctuation of the photodiode used to synchronize the camera on laser pulses. C. Image Processing
Each frame of the streak camera integrates 33 laser pulses owing to the 33 ms CCD integration time. A
Fig. 3. Typical streak-camera image of the IRF. The X axis of the image corresponds to a spectral window from 672.5 to 845.3 nm. The Y axis is a deflection time with a full scale of 1.921 ns. The gray level of the Z axis gives the number of single photoelectron (SPE) counts for each pixel. 6200
APPLIED OPTICS 兾 Vol. 44, No. 29 兾 10 October 2005
Fig. 4. Temporal shape of the IRF from 768 to 776 nm. This is one of the 20 mean temporal point-spread functions of the spectral window. The FWHM of 25 ps gives the temporal resolution of the device.
first step in image processing identifies SPE events generated by impacts of photons on the photocathode.35 Depending on the temporal sampling, series of frames are summed and yield a stack of spectrotemporal images. The 30 min baseline measurements of each bird are split up and integrated into three successive images. They undergo image processing to extract the wavelength-dependent reduced scattering coefficient and absorption coefficient. In biophotonics, the diffusion approximation of the radiative transport equation is the common theory used. Improved analytical solutions for time-resolved reflectance have been published for semi-infinite geometry and adapted optical boundary conditions (mixed Dirichlet–Neuman conditions).30 The medium is assumed to exhibit homogeneous absorption and scattering properties. The analytical solution is convoluted with the instrumental response function. The spectrotemporal images of the brain through the skin and the skull are integrated over 8.8 nm on the spectral range from 672.5
Fig. 5. Spectrum of the IRF. It was obtained by time integration of the spectrotemporal image.
Fig. 7. Spectra of homogenized reduced scattering coefficients of a zebra finch head. Three measurements for each of the four birds in the experiment are presented as lighter curves. The darker curve gives the mean and the standard deviation calculated from these 12 measurements. Fig. 6. Typical streak-camera image of a bird’s brain. The interfiber distance is 5 mm. The X axis of the image corresponds to a spectral window from 672.5 to 845.3 nm. The Y axis is a deflection time with a full scale of 1.921 ns. The gray level of the Z axis gives the number of SPE counts for each pixel.
Optical Coefficients of the Head of the Zebra Finch
⫾ 0.120 mm⫺1 for the spectral window under study. The standard deviation is ⬃5.4% of the absorption coefficient value and ⬃2.5% of the reduced scattering coefficient value. These values fall within the usual range of brain optical properties.20,23,37– 40 The measured reduced scattering coefficient is ⬃50 times higher than the absorption coefficient, which confirms that nidopallium tissues are highly scattering media and shows how difficult it is to extract local information on their absorption properties. This high ratio is in agreement with the diffusion approximation used to simplify the radiative transport equation. Each of the 12 measurements is obtained by the processing of images built with 10 min integration time of the measurement. This integration time was chosen to produce the best temporal point-spread functions and so reduce the fitting errors that are due to experimental fluctuations. With the laser intensity
The mean optical coefficients of the head of the bird are obtained from the whole 30 min of measurements. Figure 6 presents one of the 12 time-resolved spectroscopic images acquired. From the gray scale, each vertical line of this image gives the number of SPEs integrated by the camera for a given wavelength as a function of time. A first comparison of the SPE temporal distribution with the instrumental response function (Fig. 3) shows that tissues are highly scattering media. After image processing, we get the optical coefficients of the 12 measurements of the caudal nidopallium region through skin and skull as functions of wavelength. The measured reduced scattering and absorption coefficients are shown in Figs. 7 and 8, respectively, in each case with the mean and the standard deviation over the 12 measurements. Mean absorption coefficient a and its standard deviation range from 0.063 ⫾ 0.003 to 0.118 ⫾ 0.011 mm⫺1 共具a典 ⫽ 0.083 mm⫺1兲 as function of wavelength. The mean reduced scattering coefficient, s⬘, and its standard deviation are 4.857
Fig. 8. Spectra of homogenized absorption coefficients of a zebra finch head. Three measurements for each of the four birds in the experiment are presented as lighter curves. The darker curve gives the mean and the standard deviation calculated from these 12 measurements.
to 845.3 nm. This yields 20 temporal profiles, called temporal point-spread functions, on which nonlinear fitting algorithms are applied to extract a and s⬘.36 Therefore each streak camera image gives 20 pairs of wavelength-dependent optical coefficients, which contain the information about the scatterer and absorber concentrations. With four birds and 3 min of measurement per bird, we get 12 measurements of the two optical coefficients as a function of wavelength. 3. Results and Discussion A.
10 October 2005 兾 Vol. 44, No. 29 兾 APPLIED OPTICS
6201
used and the sensitivity of the camera, we are able to extract the optical coefficients with acquisition times of a few tens of seconds. B.
Validity of the Approach
According to our optical design, we chose a head position that allowed good optical probing of the caudal part of the bird’s brain, with a minimum depth to reach the caudal nidopallium, and an orientation of the fiber–fiber axis to minimize the absorption of the venous sinus and of the cerebellum area. Because optical studies often suffer from limitations caused by poor spatial resolution and a simplified model for the propagation of light, several issues about our study have to be discussed. The first issue concerns the tissues probed by the light. Knowledge of the optical coefficients (具s⬘典 ⫽ 4.857 mm⫺1, 具a典 ⫽ 0.083 mm⫺1) allows us to make an estimation of the probed brain volume and probed brain structures. Rough computations based on simple models of propagation of light in a homogeneous medium30 show that 90% of the collected light has probed a tissue volume of 50 mm3. This volume fits in a box with XYZ dimensions of 4 mm ⫻ 6 mm ⫻ 3 mm 共⌬X ⫻ ⌬Y ⫻ ⌬Z兲 centered on the two fibers. A Monte Carlo approach with adequate boundary conditions and with the effects of the ventricle and the cerebellum taken into account will yield greater precision. This method will lead to a more-precise computation of the probed volume and to a more precise model for the choice of distance between the two fibers in the case of small animals; this computation is postponed to future research. Finally, comparison with histological unpublished data has shown that the probed tissues are mainly the hippocampus and the caudal nidopallium. The same computations show that less than 1% of the collected light has probed the venous sinus and that less than 15% has probed the cerebellum. Although this information must be used in the most careful way in the mathematical models, it shows that the chosen fiber positioning is correct for probing the caudal nidopallium of the right-hand hemisphere and avoiding the main inhomogeneous brain areas. To retrieve the optical coefficients from the measurements, we used the classic solution of the diffusion equation for a semi-infinite medium. Histological observations show that the head of the zebra finch has a spherical geometry with a 15 mm diameter, far from a simple semi-infinite geometry. The interfiber distance is ⬃1兾3 of this diameter. For data processing we chose the semi-infinite model because in spherical coordinates the time-dependent Helmholtz equation is complex and no closed-form solution of this equation is known.36 An analytical closed-form expression and numerical solutions for sphere geometry are in progress. At present, the use of the semi-infinite geometry analytical solution is still required for a fast fitting procedure, and the spectra of the optical coefficients obtained in this way are a reliable and reproducible result. For image processing we need to gauge the homo6202
APPLIED OPTICS 兾 Vol. 44, No. 29 兾 10 October 2005
geneity of tissues. The bird’s head is obviously not homogeneous, and the laser light crosses complex layered structures with different optical properties. Unpublished histological studies show that, before reaching the caudal nidopallium, the light encounters dented weak-scattering skin, an air-filled scattering skull, and absorbing meningia. The caudal nidopallium and the surrounding tissues (mainly hippocampus) can be considered optically homogeneous, except at the ventricle location separating the hippocampus and the nidopallium in terms of vascularization and tissue structure. These layered structures could alter the measured scattering coefficient and absorption coefficient of the zebra finch’s head. For example, the refractive-index changes induce Fresnel reflection at layer interfaces. Thus the amount of transmitted light at a long distance could be reduced, which would cause an increase in the apparent homogenized absorption in the simple model used. Solutions of the diffusion equation are valid only when the distances between the source and the detector are greater than several mean free paths. For the measurements presented, the mean free path is 1兾s⬘ ⫽ 0.2 mm. Thus the solutions of the diffusion equation for measurements of the head of a small bird with an interfiber distance of 5 mm are used at the limit of the mathematical model. Monte Carlo computations of the inverse problem could allow us to improve the validity of the optical coefficients extracted from measurements. Moreover, they could allow us to reach smaller distances between the source and the detector to investigate in a small animal the optical effects of scalp and skull in comparison with the effect of brain tissue, as has been done in human beings.18 A multilayer model that takes these special boundary conditions into account will be developed specifically for the songbird to yield a better estimation of the optical coefficients as well as Monte Carlo simulations. Complementary investigations of the optical properties of a bird’s brain with the skin and the skull removed are needed for the conclusion of our study of the optical effects of these layers. Experimental absorption coefficients could allow the CBV and the StO2 of the head of a zebra finch to be estimated, but complementary physiological data, for instance, on hemoglobin spectra and blood hemoglobin concentrations in the zebra finch, are needed. Indeed, birds’ hematological components, such as nucleated red blood cells, lead us to believe that particularities exist in their optical blood as they do in mammals. Moreover, a better knowledge of bird hematology will allow us to take full advantage of our broadband optical method: The large number of wavelengths provided by a white laser will give us more accuracy in the determination of StO2 and some access to other chromophores such as cytochromes. 4. Conclusions
We have reported what are to our knowledge the first measurements of optical properties of the head of a songbird, the zebra finch. It remains to be explored
whether our multiwavelength approach can permit greater precision in the measurement of endogenous chromophores and whether our broadband timeresolved NIRS method can measure variations of songbird brain oxygenation linked to local hemoglobin oxygen saturation levels and to CBV. An obligatory first step is to investigate changes in broadband time-resolved NIRS signals in a physiological challenge known to induce a standard oximetric response in the brain. For instance, a 7% CO2 hypercapnic challenge is known to induce a standard CBV and StO2 response, which should be detected by our NIRS design to confirm its potential for the monitoring of brain oxygenation in songbirds. We are working on improving the signal-to-noise ratio to reach the possibility of following real-time biological events such as hypercapnia. Preliminary results let us expect success in following biological events with more than 10 wavelengths and below a sampling rate of 1 s. Complementary studies with other methods that follow brain hemodynamic responses, such as MRI, are needed to improve our design for songbirds. Moreover, the experimental methods and the mathematical models used to retrieve optical coefficients must be tailored more to birds’ particularities. This study is the basis of optical in vivo and noninvasive measurements of cerebral action in response to focal phenomena as to well-defined sensory stimuli. The caudomedial nidopallium, one center of the caudal nidopallium implicated in auditory stimuli processing,4,41,42 is specifically activated by a significant acoustic stimulus, such as a conspecific song. We expect to find some local variations of hemoglobin oxygen saturation levels and CBVs in the caudal nidopallium that could be reflected by modifications of optical properties. These real-time optical measurements in response to sensory stimuli are the next step in our research. We thank Joël Attia, Priscille Bosc, Colette Bouchut, Pierre Laporte, Sabine Palle, Marie Rabearinaivo, Florence Rivollier, Alexander Snigura, and the Lycée Van der Meersch (Roubaix, France) for their help during this work. We are grateful to Laurence Vico and Norbert Laroche (Laboratoire de Biologie du Tissus Osseux, Institut National de la Santé et de la Recherche Médicale 366) for help with histological data. We thank Elodie Leveugle for improving the English. This research was supported by the Interdisciplinary Program Cognition and Information Processing (grant CTI 02-19) of the French Centre National de la Recherche Scientifique. C. Vignal is supported by the French Ministry of National Education.
4.
5.
6.
7.
8.
9.
10.
11.
12.
13.
14.
15. 16.
17.
18.
19.
References 1. P. Marler and A. J. Doupe, “Singing in the brain,” Proc. Natl. Acad. Sci. USA 97, 2965–2967 (2000). 2. C. Vignal, N. Mathevon, and S. Mottin, “Audience drives male songbird response to partner’s voice,” Nature 430, 448 – 451 (2004). 3. G. F. Ball and T. Q. Gentner, “They’re playing our song: gene
20.
21.
expression and birdsong perception,” Neurone 21, 271–274 (1998). C. V. Mello, “Mapping vocal communication pathways in birds with inducible gene expression,” J. Comp. Physiol. A 188, 943– 959 (2002). S. J. Chew, D. S. Vicario, and F. Nottebohm, “A large-capacity memory system that recognizes the calls and songs of individual birds,” Proc. Natl. Acad. Sci. USA 93, 1950 –1955 (1996). R. Stripling, S. Volman, and D. F. Clayton, “Response modulation in the zebra finch neostriatum: relationship to nuclear gene regulation,” J. Neurosci. 17, 3883–3893 (1997). A. Van der Linden, M. Verhoye, V. Van Meir, I. Tindemans, M. Eens, P. Aabsil, and J. Balthazart, “In vivo manganeseenhanced magnetic resonance imaging reveals connections and functional properties of the songbird vocal control system,” Neuroscience 112, 467– 474 (2002). N. Plesnila, C. Putz, M. Rinecker, J. Wiezorrek, L. Schleinkofer, A. E. Goetz, and W. M. Kuebler, “Measurement of absolute values of hemoglobin oxygenation in the brain of small rodents by near infrared reflection spectrophotometry,” J. Neurosci. Methods 114, 107–117 (2002). J. P. Culver, T. Durduran, D. Furuya, C. Cheung, J. H. Greenberg, and G. Yodh, “Diffuse optical tomography of cerebral blood flow, oxygenation, and metabolism in rat during focal ischemia,” J. Cereb. Blood Flow Metab. 23, 911–924 (2003). F. F. Jöbsis, “Noninvasive, infrared monitoring of cerebral and myocardial oxygen sufficiency and circulatory parameters,” Science 198, 1264 –1267 (1977). A. Y. Bluestone, M. Stewart, J. Lasker, G. S. Abdoulaev, and A. H. Hielscher, “Three-dimensional optical tomographic brain imaging in small animals. 1. Hypercapnia; 2. Unilateral carotid,” J. Biomed. Opt. 9, 1046 –1073 (2004). H. Obrig and A. Villringer, “Beyond the visible—imaging the human brain with light,” J. Cereb. Blood Flow Metab. 23, 1–18 (2003). B. Beauvoit, S. M. Evans, T. W. Jenkins, E. E. Miller, and B. Chance, “Correlation between the light scattering and the mitochondrial content of normal tissues and transplantable rodent tumors,” Anal. Biochem. 226, 167–174 (1995). R. Drezek, A. Dunn, and R. Richards-Kortum, “A pulsed finitedifference time-domain (FDTD) method for calculating light scattering from biological cells over broad wavelength ranges,” Opt. Express 6, 147–157 (2000). V. V. Tuchin, “Light scattering study of tissues,” Sov. Phys. Usp. 40, 495–515 (1997). S. Andersson-Engels, R. Berg, A. Persson, and S. Svanberg, “Multispectral tissue characterization with time-resolved detection of diffusely scattered white light,” Opt. Lett. 18, 1697– 1699 (1993). P. Taroni, G. Danesini, A. Torricelli, A. Pifferi, L. Spinelli, and R. Cubeddu, “Clinical trial of time-resolved scanning optical mammography at 4 wavelengths between 683 and 975 nm,” J. Biomed. Opt. 9, 464 – 473 (2004). J. H. Choi, M. Wolf, V. Y. Toronov, U. Wolf, C. Polzonetti, D. M. Hueber, L. P. Safonova, R. Gupta, A. Michalos, W. W. Mantulin, and E. Gratton, “Noninvasive determination of the optical properties of adult brain: near-infrared spectroscopy approach,” J. Biomed. Opt. 9, 221–229 (2004). D. T. Delpy, M. Cope, P. Van der Zee, S. Arridge, S. Wray, and J. Wyatt, “Estimation of optical pathlength through tissue from direct time of flight measurement,” Phys. Med. Biol. 33, 1433–1442 (1988). B. Chance, J. S. Leigh, H. Miyake, D. S. Smith, S. Nioka, R. Greenfeld, M. Finander, K. Kaufmann, W. Levy, M. Young, P. Cohen, H. Yoshioka, and R. Boretsky, “Comparison of timeresolved and -unresolved measurements of deoxyhemoglobin in brain,” Proc. Natl. Acad. Sci. USA 85, 4971– 4975 (1988). S. E. Nicklin, I. A. A. Hassan, Y. A. Wickramasinghe, and S. A.
10 October 2005 兾 Vol. 44, No. 29 兾 APPLIED OPTICS
6203
22.
23.
24.
25.
26.
27. 28.
29. 30.
31.
32.
Spencer, “The light still shines, but not that brightly? The current status of perinatal near infrared spectroscopy,” Arch. Dis. Child. 88, 263–268 (2003). S. Ramstein, S. Mottin, and P. Laporte, “In vivo spectroscopy with femtosecond white light continuum,” in Optical Biopsy IV, R. R. Alfano, ed., Proc. SPIE 4613, 188 –197 (2002). P. Laporte, S. Ramstein, and S. Mottin, “Optical systems in ultrafast biophotonics,” in Optical Design and Engineering, L. Mazuray, P. J. Rogers, and R. Wartmann, eds., Proc. SPIE 5249, 490 –500 (2004). S. Mottin, P. Laporte, and R. Cespuglio, “Inhibition of NADH oxidation by chloramphenicol in the freely moving rat measured by picosecond time-resolved emission spectroscopy,” J. Neurochem. 84, 633– 642 (2003). S. Ramstein and S. Mottin, “Spectroscopie résolue en temps par continuum femtoseconde. Applications en neurobiologie,” J. Phys. IV 108, 127–130 (2003). A. Reiner, D. J. Perkel, L. L. Bruce, A. B. Butler, A. Csillag, W. Kuenzel, L. Medina, G. Paxinos, T. Shimizu, J. M. Wild, G. F. Ball, S. Durand, O. Gunturkun, D. W. Lee, C. V. Mello, A. Powers, S. A. White, G. E. Hough, L. Kubikova, T. V. Smulders, K. Wada, J. Dugas-Ford, S. Husband, K. Yamamoto, J. Yu, C. Siang, and E. D. Jarvis, “Revised nomenclature for avian telencephalon and some related brainstem nuclei,” J. Comp. Neurol. 473, 377– 414 (2004). H. J. Karten and W. Hodos, Stereotaxic Atlas of the Brain of the Pigeon (Johns Hopkins U. Press, 1967). T. M. Stokes, C. M. Leonard, and F. Nottebohm, “The telencephalon, diencephalon, and mesencephalon of the canary, Serinus canaria, in stereotaxic coordinates,” J. Comp. Neurol. 156, 337–374 (1976). G. Paxinos and C. Watson, Rat Brain in Stereotaxic Coordinates, 3rd ed. (Academic, 1997). A. Kienle and M. S. Patterson, “Improved solutions of the steady state and the time-resolved diffusion equations for reflectance from a semi-infinite turbid medium,” J. Opt. Soc. Am. A 14, 246 –254 (1997). S. Mottin, “Procédé et dispositif de spectrophotométrie impulsionnelle résolue en temps, sans balayage spectral et à large spectre, de milieux non limpides,” patent W02004013617, Centre National de la Recherche Scientifique and Université Jean Monnet, Saint-Etienne (12 February 2004). R. R. Alfano, Supercontinuum Laser Source (Springer-Verlag, 1989).
6204
APPLIED OPTICS 兾 Vol. 44, No. 29 兾 10 October 2005
33. A. Brodeur and S. L. Chin, “Ultrafast white-light continuum generation and self-focusing in transparent condensed media,” J. Opt. Soc. Am. B 16, 637– 650 (1999). 34. N. Nishimura, C. B. Schaffer, B. Friendman, P. S. Tsai, P. D. Lyden, and D. Kleinfeld, “Targeted disruption of deep-lying neocortical microvessels in rat using ultrashort laser pulses,” in Commercial and Biomedical Applications of Ultrafast Lasers IV, J. Neev, C. B. Schaffer, and A. Ostendorf, eds., Proc. SPIE 5340, 179 –187 (2004). 35. M. Watanabe, M. Koishi, M. Fujiwara, T. Takeshita, and W. Cieslik, “Development of a new fluorescence decay measurement system using two-dimensional single-photon counting,” J. Photochem. Photobiol. A 80, 429 – 432 (1994). 36. S. R. Arridge, M. Cope, and D. T. Delpy, “The theoretical basis for the determination of optical pathlengths in tissue: temporal and frequency analysis,” Phys. Med. Biol. 37, 1531–1560 (1992). 37. W. F. Cheong, S. A. Prahl, and A. J. Welch, “Review of the optical properties of biological tissues,” IEEE J. Quantum Electron. 26, 2166 –2185 (1990). 38. S. Avrillier, E. Tinet, J. M. Tualle, J. Prat, and D. Ettori, “Propagation d’impulsions ultracourtes dans les milieux diffusants. Application au diagnostic medical,” in Systèmes Femtosecondes, P. Laporte, F. Salin, and S. Mottin, eds. (Publications de l’Université de Saint-Etienne, Saint-Etienne, France, 2001), pp. 295–310. 39. E. Okada and D. T. Delpy, “Near-infrared light propagation in an adult head model. II. Effect of superficial tissue thickness on the sensitivity of the near-infrared spectroscopy signal,” Appl. Opt. 42, 2915–2922 (2003). 40. A. N. Yaroslavsky, P. C. Schulze, I. V. Yaroslavsky, R. Schober, F. Ulrich, and H.-J. Schwarzmaier, “Optical properties of selective native and coagulated human brain tissues in vitro in the visible and near infrared spectral range,” Phys. Med. Biol. 47, 2059 –2073 (2002). 41. R. Stripling, A. A. Kruse, and D. F. Clayton, “Development of song responses in the zebra finch caudomedial neostriatum: role of genomic and electrophysiological activities,” J. Neurobiol. 48, 163–180 (2001). 42. C. Vignal, A. Joël, N. Mathevon, and M. Beauchaud, “Background noise does not modify song-induced genic activation in the bird brain,” Behav. Brain. Res. 153, 241–248 (2004).