Articles in PresS. Am J Physiol Heart Circ Physiol (August 8, 2008). doi:10.1152/ajpheart.00540.2008
In Vivo Differences between Endothelial Transcriptional Profiles of Coronary and Iliac Arteries Revealed by Microarray Analysis
Ji Zhang*, Kelley A. Burridge*, Morton H. Friedman Department of Biomedical Engineering, Duke University
*: Both authors contributed equally to this work.
Corresponding Author: Morton H. Friedman Department of Biomedical Engineering, Duke University PO Box 90281 Durham, NC 27708 Phone: 919-660-5154 Fax: 919-684-4488
[email protected]
Short Title: Arterial endothelial heterogeneity in gene expression
Copyright © 2008 by the American Physiological Society.
1
Abstract Endothelial cells (ECs) from different vascular beds display a remarkable heterogeneity in both structure and function. Phenotypic heterogeneity among arterial ECs is particularly relevant to atherosclerosis since the disease occurs predominantly in major arteries, which vary in their atherosusceptibility. To explore EC heterogeneity between typical atheroprone and atheroresistant arteries, we used DNA microarrays to compare gene expression profiles of freshly harvested porcine coronary and iliac artery ECs (CECs, IECs). Statistical analysis revealed 51 genes that were differentially expressed in CECs relative to IECs at a false discovery rate of 5%. Seventeen of these genes are known to be involved in atherogenesis. Consistent with coronary arteries being more atherosusceptible, almost all putative atherogenic genes were overexpressed in CECs, while all atheroprotective genes were downregulated, relative to IECs. A subset of the identified genes was validated by quantitative polymerase chain reaction (PCR). PCR results suggest that the differences in expression levels between CECs and IECs for the HOXA10 and HOXA9 genes were greater than 100-fold. Gene ontology (GO) and biological pathway analysis revealed a global expression difference between CECs and IECs. Genes in twelve GO categories, including complement immune activation, immunoglobulin-mediated response, and system development, were significantly upregulated in CECs. CECs also overexpressed genes involved in several inflammatory pathways, including the classical pathway of complement activation and the IGF1 mediated pathway. The in vivo transcriptional differences between CECs and IECs found in this study may provide new insights into the factors responsible for coronary artery atherosusceptibility.
Key Words: vascular endothelium, atherosclerosis, pathophysiology, genomics
2
Introduction Coronary heart disease (CHD), primarily caused by atherosclerosis, is the single leading cause of death in the United States and other developed countries (29, 42). The relative clinical importance of systemic cardiovascular risk factors differs among arterial beds; e.g., coronary heart disease is mostly affected by cholesterol level, while stroke is more associated with hypertension (19). A recent human biopsy study suggested that the initiation, development, and composition of atherosclerotic plaques differ among artery types (9). The coronary arteries had a higher prevalence of atherosclerotic plaques compared to the carotid and femoral arteries. An understanding of the origin of arterial differences in disease development may yield insight into factors that affect atherosusceptibility as well as disease progression. The endothelium that forms the inner lining of the vascular system plays an essential role in the development of atherosclerosis (30); thus, in this context, interarterial differences in endothelial cell (EC) biology are of considerable interest.
ECs from different anatomical locations demonstrate a remarkable heterogeneity in both structure and function under normal and pathological conditions (2, 3). The notion of phenotypic diversity of ECs arises from both in vivo (34), (35) and cell culture (8), (37), (6) studies that suggest there are substantial differences in gene expression between ECs from different vascular beds. For example, microarray studies demonstrate that significant transcriptional differences exist between cultured arterial and venous ECs (8), which have also been shown to respond differently to atherogenic stimuli and shear stress (11, 22).
3 Phenotypic heterogeneity among arterial ECs is of particular interest in relation to atherosclerosis since the disease occurs predominantly in the major arteries, which vary in their atherosusceptibility (2, 30). Dancu and Tarbell (10) demonstrated differential expression of two genes in cells scraped from the aorta and coronary arteries of rabbits. The relative importance of, and interplay among, environmental and biological factors in determining arterial EC phenotype is unclear. Here, we seek to determine whether transcriptional differences exist between known atheroprone and atheroresistant arteries in vivo. In this study, we used young and healthy swine as the source of ECs because swine vasculature is one of the best models of the human circulation with respect to normal and pathological physiology (4, 33). We demonstrate that in vivo the endothelial transcriptional profile of a coronary artery (the right coronary artery) is different from that of a major conduit vessel (the external iliac artery), and that this difference is consistent with the former vessel being more prone to atherosclerosis.
Materials and Methods Animal surgery Animal experiments were performed in accordance with a protocol approved by the Duke University Institutional Animal Care and Use Committee. Four commercial juvenile female swine (60-70 kg) were maintained under anesthesia with inhaled isoflurane. Basic physiological parameters, including heart rate and blood pressure, were recorded for at least 20 to 25 minutes. The animal was then euthanized, and the arterial system was flushed with Dulbecco’s Modified Eagle’s Medium (DMEM, Sigma-Aldrich, St. Louis, MO) to clear the blood from the vessels. The left and right external iliac arteries and right coronary arteries were dissected out. After the adventitial tissue was removed, the arteries were cut open and pinned out flat. A metal spatula
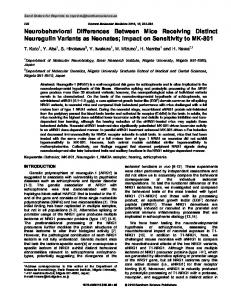
4 was used to scrape ECs from the arterial wall as described previously (20). As shown in Fig. 1, iliac artery endothelial cells (IECs) were scraped from the straight portion of the vessel between the circumflex iliac and deep femoral branches. Right coronary artery endothelial cells (CECs) were scraped from the proximal portion, approximately five to eight centimeters from the ostium. The cells were transferred directly to cell lysis solution, and total RNA was isolated using the RNeasy Micro Kit (Qiagen, Valencia, CA).
Flow cytometry and quantitative polymerase chain reaction (PCR) for calponin were performed earlier (20) to confirm that no smooth muscle cells (SMCs) were scraped from the artery wall using this technique. The purity of the scraped ECs was further confirmed in this study by the microarray results; indeed, the expression of the SMC-specific genes, calponin, and myosin heavy chain, was less in all samples than in a reference sample of cultured ECs.
Microarray experiments The microarray experiments were performed as described earlier (14). Briefly, RNA samples were amplified and labeled with Cy5 dyes. A reference RNA sample (Cy3 labeled) was derived from cultured porcine aortic ECs (passage 3). Samples were hybridized to Sus Scrofa DNA microarrays (Version 1.0, Operon Biotechnologies, Huntsville, AL). The arrays were scanned and the fluorescence intensity for each spot was quantified using GenePix (Molecular Devices, Sunnyvale,
CA).
Microarray
data
is
available
http://www.ncbi.nlm.nih.gov/geo/query/acc.cgi?token=dbmvrguiqmkuwha&acc=GSE10938.
Statistical analysis and bioinformatics for microarray
at
5 Lowess normalization was performed on each array using GeneSpring GX (Agilent, Santa Clara, CA, version 7.2). Subsequent statistical tests were performed using Significance Analysis of Microarrays (SAM 40), and the false discovery rates (FDR) were estimated based on permutation methods in SAM. The first statistical test was to identify the genes differentially expressed between CECs and IECs. The expression level of each gene in each CEC was normalized by the mean of the expression levels of the gene in the corresponding left and right IECs, and a paired test (n=4) was performed. In the second test, the expression levels were not normalized within each animal; i.e., the set of 4 CEC samples was compared with the set of 8 IEC samples. As formulated, this unpaired test treats the left and right IECs as independent replicates.
The gene ontology (GO) study was performed using GoMiner (44). The annotation of genes was obtained from both Operon and GeneSpring. For each GO category, a Fisher’s exact p-value and a q-value (local FDR estimate) were calculated.
Gene set enrichment analysis (GSEA, version 2.0, (36) was used to explore the global gene expression pattern. The a priori defined gene sets were obtained from the Molecular Signatures Database (36) where the c2 curated gene sets were used.
Quantitative real-time PCR Quantitative real-time PCR (QRT-PCR) was performed with the MyiQ Single-Color Real-Time PCR Detection System (Bio-Rad, Hercules, CA), using iQ™ SYBR® Green (Bio-Rad, Hercules, CA) to detect double-stranded DNA. The 2-ΔΔCT method (21) was used to quantify the fold
6 difference in expression levels, using ribosomal 18S as the internal control gene. Three replicate amplifications were used for each sample and melting curves verified the quality of DNA product in each well. The RNA samples used for PCR were isolated at the same time and from the same animals as those used in the microarray measurements. For the iliac samples, equal amounts of RNA from the left and right arteries were pooled to maximize the amount of RNA available for PCR, except for one animal for which no right iliac RNA remained after the microarray sample was obtained. cDNA was synthesized from 50 ng of total RNA using the Quantitect Reverse Transcription Kit (Qiagen, Valencia, CA), which includes a DNase treatment step. To verify that the DNase treatment removed genomic DNA, controls were performed on the same plate for each primer pair by substituting diethyl pyrocarbonate-treated water (EMD, San Diego, CA) for reverse transcriptase. For the control sample using water, with the exception of 18S, no gene product was observed even after 50 PCR cycles or was detected much later than normal (>12 cycles) with different melting temperatures. The 18S gene was detected with the same melting temperature, but much later (26 cycles), indicating that 2 or 3-fold) in CECs. Three homeobox genes, HOXA10, HOXA9, and HOXD3, were under-expressed in coronary endothelium by approximately 20, 10, and 3-fold, respectively. Homeobox genes are known to be essential mediators in vascular remodeling and angiogenesis (12, 13). A recent study showed that HOXA9 can inhibit the NFκB-dependent endothelial inflammatory response, and inhibit the induction of ICAM1, VCAM1, and E-selectin (39). Other important genes differentially expressed between the two arteries include several coding for proteins involved in inflammation (IGFBP5, IGF1R, DUSP1, and C1R), oxidation (MAOA), lipid metabolism (FABP5) and junctions (CLDN1). CECs also over-expressed two genes that are highly involved in signal transduction: FAB34 (Ras oncogene family) and RICS (Rho GTPaseactivating protein). Recognizing that pathways are more complex than a simple list of genes, it is nonetheless striking that, among the genes that are differentially expressed, all putative atherogenic (including pro-inflammatory and oxidative) genes are over-expressed in CECs, while all putative atheroprotective genes are downregulated in CECs (Fig. 2).
To further explore connections to atherosclerosis, we next examined an a priori-selected set of genes that are known to participate in early atherogenesis (Table S3). Inflammatory adhesion molecules, including ICAM1, ALCAM, PECAM1, and E-selectin, were over-expressed in CECs, compared to IECs. The pro-inflammatory transcription factors, NFκB and AP1, were expressed at higher levels in CECs. In addition, the inflammatory regulation transcription factors KLF2 and KLF4, and the cytoprotective genes GADD45B and MnSOD were under-expressed in CECs. Although the significance levels of some of the a priori genes are not high, the pattern of CECs
9 over-expressing putative atherogenic genes and under-expressing putative atheroprotective genes is consistent with the SAM results.
QRT-PCR Confirmation of Microarray Results.
To confirm the differences in gene
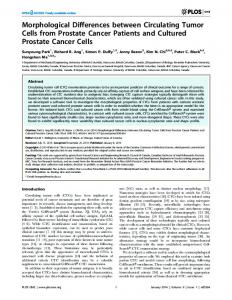
expression observed in the microarray experiments, quantitative real-time PCR was performed on the following seven genes: FABP5, KLF2, IGFR1, MAOA, EGR1, HOXA10, and HOXA9. In the microarray experiments, these genes were either over- or under-expressed in CECs over a 3-fold range. A strong linear correlation (R2 = 0.9987) was observed between the expression levels of the first five of the genes measured using the two independent techniques (Fig. 3). Although consistently detected for IECs, HOXA10 and HOXA9 expression was not detected for CECs within 50 PCR cycles run on the same plates, with one exception [HOXA9 was detected in one of 12 wells with a log2(fold difference) of -16]. Increasing the amount of starting RNA from 50 to 150 ng did not improve PCR detection of either HOX gene in CEC cDNA. As primer efficiencies for both HOXA10 and HOXA9 were determined using a 100-fold dilution of IEC cDNA, the results suggest that the differences in expression levels between CECs and IECs for these two HOX genes are greater than 100-fold.
GO Analysis Using GoMiner. GoMiner was used as a data mining tool to compare CECs and IECs in the context of gene functions and biological processes. It is beneficial to include more genes than the 51 in Table S2 so that the transcriptional difference can be seen in a broader context. The FDR restriction was therefore relaxed to 10%, and 171 genes were found to be differentially expressed between CECs and IECs. This list of genes was analyzed by GoMiner, using an FDR of 5%. As shown in Fig. 4 and Table S4, twelve GO categories or pathways were
10 identified with significant numbers of genes differentially expressed between CECs and IECs. The p-values of all the categories were