0021-972X/07/$15.00/0 Printed in U.S.A.
The Journal of Clinical Endocrinology & Metabolism 92(4):1372–1378 Copyright © 2007 by The Endocrine Society doi: 10.1210/jc.2006-1344
Increased Oxidative Stress in Prepubertal Children Born Small for Gestational Age Angelika Mohn, Valentina Chiavaroli, Marina Cerruto, Annalisa Blasetti, Cosimo Giannini, Tonino Bucciarelli, and Francesco Chiarelli Departments of Pediatrics (A.M., V.C., M.C., A.B., C.G., F.C.) and Biochemistry (T.B.), University of Chieti, 66100 Chieti, Italy Context: Low birth weight is associated with an increased risk of metabolic and cardiovascular diseases in adulthood. The development of insulin resistance (IR) seems to play a pivotal role; no data on the oxidant-antioxidant status are available in this risk group. Objective: This study is an assessment of oxidant-antioxidant status in prepubertal children born small for gestational age (SGA) in comparison to healthy controls and the relationship to IR. Design: This cross-sectional study compares indexes of IR and oxidant-antioxidant status in three different groups (SGA⫹, SGA⫺, controls), with analysis by post hoc and Pearson correlation. Setting: The study was conducted in the Academic Department of Pediatrics. Participants: A total of 19 SGA⫹ and 16 SGA⫺ children were compared with 13 controls. Intervention: No intervention was used. Main Outcome Measures: Indexes of IR (glucose to insulin ratio, homeostasis model assessment of IR) were evaluated, and
I
NFANTS BORN SMALL for gestational age (SGA) are known to be at increased risk of adult degenerative disease, such as cardiovascular dysfunction and the metabolic syndrome, a combination of type 2 diabetes mellitus, hypertension, dyslipidemia, and obesity (1– 8). Insulin resistance (IR) is a common feature of these pathogenic conditions and represents an early and constant alteration found in SGA children, suggesting that this metabolic abnormality plays, with compensatory hyperinsulinemia, a pivotal role in linking low birth weight (BW) to long-term consequences (9 –12). Most of these dysfunctions are related to rapid postnatal catch-up growth (13–16). This phenomenon, described in nearly 90% of subjects born SGA, determines changes in body proportions due to enhanced central
First Published Online January 30, 2007 Abbreviations: AGA, Appropriate for gestational age; BMI, body mass index; BW, birth weight; G/I, glucose to insulin ratio; HOMA-IR, homeostasis model assessment of IR; IGFBP-3, IGF binding protein 3; IR, insulin resistance; MDA, malonildialdehyde; LDL, low-density lipoprotein; LDL-C, LDL cholesterol; SDS, sd score; SGA, small for gestational age; WHR, waist-to-hip ratio. JCEM is published monthly by The Endocrine Society (http://www. endo-society.org), the foremost professional society serving the endocrine community.
markers of oxidative stress (lag phase, malonildialdehyde, vitamin E) were measured. Results: Homeostasis model assessment of IR was significantly higher in SGA⫹ than SGA⫺ children (1.32 ⫾ 0.9 vs. 0.69 ⫾ 0.47; P ⫽ 0.03) and controls (0.71 ⫾ 0.37; P ⫽ 0.04). Glucose to insulin ratio was significantly lower in SGA⫹ than SGA⫺ children (12.41 ⫾ 5.01 vs. 26.54 ⫾ 17.18; P ⫽ 0.02) and controls (26.96 ⫾ 20.70; P ⫽ 0.04). Lag phase was significantly shorter in SGA⫹ than SGA⫺ children (24.3 ⫾ 4.38 vs. 35.59 ⫾ 11.29 min; P ⫽ 0.003) and controls (45.28 ⫾ 7.69 min; P ⫽ 0.0001) and in SGA⫺ than controls (P ⫽ 0.01). Malonildialdehyde was significantly higher in SGA⫹ than SGA⫺ children (0.79 ⫾ 0.3 vs. 0.6 ⫾ 0.1 nmol/mg; P ⫽ 0.03) and controls (0.36 ⫾ 0.04 nmol/mg; P ⫽ 0.0001) and in SGA⫺ children than controls (P ⫽ 0.02). Vitamin E was significantly reduced in SGA⫹ children than controls (27.54 ⫾ 7.9 vs. 43.23 ⫾ 11.32 mol/liter; P ⫽ 0.002). Conclusion: Oxidative stress is present in both SGA⫹ and SGA⫺ children, with a continuous alteration in relation to IR. Therefore, catch-up growth might exert the greatest influence in the development of future diseases. (J Clin Endocrinol Metab 92: 1372–1378, 2007)
fat deposition (15) and leading thereby to a relevant increase of the body mass index (BMI) (17–20). This determines changes in insulin sensitivity and is associated with a higher predisposition to develop IR (2, 21–23). Oxidative stress, occurring as a consequence of imbalance between the formation of oxygen free radicals and inactivation of these species by antioxidant defense system (24), seems to be tightly linked to significantly decreased insulin sensitivity. In fact, it has been suggested that IR per se or via an increased plasma concentration of free fatty acids seems to increase reactive oxygen species production through nicotinamide adenine dinucleotide phosphate oxidase activation (25). Furthermore, the major source of oxygen free radical production is adipose tissue, which seems to play also a key role for the development of IR and even the metabolic syndrome (26, 27). Despite the well-described IR status in SGA children, the oxidant-antioxidant status has not been completely explored as up to now only data on antioxidant vitamin levels are available (28). We have chosen malonildialdehyde (MDA) and lag phase as oxidative markers because recent data clearly demonstrate that these indexes are a valid tool for estimating oxidant-antioxidant status in humans (29). Therefore, the aim of this study was to evaluate possible alterations in the oxidant-antioxidant status in SGA children compared with children born appropriate for
1372
Mohn et al. • Oxidative Stress in SGA Children
gestational age (AGA) and to determine whether significantly reduced insulin sensitivity might be associated. Subjects and Methods Study population Short SGA children (SGA⫺). We recruited 16 Caucasian prepubertal SGA children, defined as neonates whose BW or birth crown-heel length is at least 2 sd below the mean (ⱕ⫺2 sd) for the infant’s gestational age (five boys and 11 girls; mean age, 4.1 ⫾ 2.59 yr; mean BW, 2368.4 ⫾ 442.09 g), who had been referred to the Department of Pediatrics of the University of Chieti, Italy, and had been admitted for short stature, between June 2004 and October 2006. All children included in this study were born full term (ⱖ37 wk complete of gestation). SGA children were assigned into this group according to the absence of catch-up growth, defined on the clinical basis of a current length less than 10th percentile. None of the children presented congenital anomalies (including SilverRussel Syndrome), psychomotor delay, other chronic disorders, and/or autoimmune disease. Subjects born from multiple gestation were excluded. Normal-stature SGA children (SGA⫹). Nineteen Caucasian prepubertal SGA children, defined as neonates whose BW or birth crown-heel length is at least 2 sd below the mean (ⱕ⫺2 sd) for the infant’s gestational age (eight boys and 11 girls; mean age, 4.33 ⫾ 1.88 yr; mean BW, 2496.31 ⫾ 135.65 g), were recruited. SGA children were assigned into this group according to the presence of catch-up growth, defined on the clinical basis of a current length greater than 10th percentile. All children were recruited to the study after having been admitted to the Department of Pediatrics for minor diseases. Controls. As control group, 13 healthy Caucasian prepubertal AGA children, defined as BW and length at or above 10th percentile for gestational age, comparable for sex, age (seven boys and six girls; mean age, 3.43 ⫾ 1.34 yr; mean BW, 3.387 ⫾ 373.56 g), were recruited to the study after having been admitted to the Department of Pediatrics for minor diseases. After complete recovery of the disease, all children underwent a medical visit to assess general health status, including anthropometric parameters [height, sd score (SDS) height, weight, BMI (the weight in kilograms divided by the square of the height in meters), SDS BMI, waist-to-hip ratio (WHR)], bio-impedentiometry to determine fat mass, and staging of puberty on the basis of breast development in girls and genital development in boys according to the criteria of Tanner (all patients had preadolescent characteristics corresponding to stage 1). Blood samples were taken to evaluate lipid profile (total cholesterol and triglyceride), hormonal pattern [fasting insulin and glucose, C-peptide, IGF-I, IGF binding protein 3 (IGFBP-3)], as well as of markers of oxidantantioxidant status (lag phase, MDA, vitamin E). The study was approved by the Ethical Committee of the University of Chieti. Written informed consent was obtained from all parents, and oral consent was obtained from all children.
Anthropometric measurements Body weight was determined to the nearest 0.1 kg, and height was measured with Harpenden stadiometer to the nearest 0.1 cm. As fatness indexes, we used WHR and BMI. To calculate WHR, the waist circumference was measured at its smallest point between iliac crest and rib cage, and the hip circumference was measured at its largest width over the greater trochanters. As further fatness index, we used fat mass (percent), estimated from four skin-fold thicknesses (made over the triceps and biceps, at the tip of the scapula, and over the iliac crest, of the left side of the body) with Holtain plicometer according to Brook’s equation (30).
Bioelectrical impedance analysis The impedance signal (Z, in ohms) into resistance (R, in ohms) and reactance (Xc, in ohms) was estimated to calculate fat mass. Measurements were conducted in all subjects with the same single frequency phase-sensitive impedance analyzer [STA (Soft Tissue Analyzer)/BIA; Akern Sistem Srl, Florence, Italy]. The instrument applied a 50-kHz
J Clin Endocrinol Metab, April 2007, 92(4):1372–1378
1373
alternative current of 800 A and was connected to surface electrodes (5400 Q-Trace Kendall); two electrodes were placed on the dorsal surface of the right hand and foot, next to the metacarpal-phalangeal, and metatarsal-phalangeal joints; two other electrodes were placed proximally on the right forearm and leg, leaving 5.5 cm of free skin around the outer electrodes (standard to tetrapolar placement). Before each testing session, the external calibration of the instrument was checked with a calibration circuit of a known impedance value (R ⫽ 380 ⍀ and Xc ⫽ 47 ⍀, 1% error). The subjects lay recumbent on a nonconductive surface. Clothing was removed except for dry underwear. No direct contact was made with the infant’s skin during the measurement, which was done before feeding and when the child was quiet. Measurements obtained were analyzed by Bodygram system (qualitative and quantitative body composition analysis) (31) to calculate fat mass.
Laboratory procedures Biochemical analysis. Plasma glucose level was determined by using the glucose oxidase method, and plasma insulin was measured with twosite immunoenzymometric assay (AIA-PACK IRI; Tosoh, Tokyo, Japan). The limit of detection was 0.5 U/ml with intraassay and interassay coefficients of variation less than 7% for quality control. Total cholesterol and triglyceride concentrations have been performed by using calorimetric method (at 540 nm), and test sensibility was 50 and 10 mg/dl, respectively. Low-density lipoprotein (LDL) isolation. Plasma LDL fraction was isolated by single-vertical-spin ultracentrifugation using a discontinuous NaCl/ KBr density gradient. Then it was dialyzed for 22 h in the dark against three changes of PBS containing EDTA (2.7 mmol/liter) (pH 7.4) at 4 C. LDL cholesterol (LDL-C) was measured by an enzymatic reagent (CHOD-PAP, MPR1; Boehringer Mannheim, Mannheim, Germany), and protein contents of LDL were quantified by the method of Lowry et al. (32). LDL oxidation. Oxidation of LDL (fresh preparations at a concentration of 0.05 LDL-C/ml) was obtained by the addition of 2.5 mol/liter CuSO4 in PBS (pH 7.4) at 37 C and was continuously controlled spectrophotometrically at 234 nm to evaluate the formation of conjugated dienes. Oxidation of LDL was calculated as the measurement of the duration of the phase before the maximum oxidation (lag phase). As previously reported (33), the oxidation curve is characterized by three phases: lag phase, propagation phase, and decomposition phase. In particular, lag phase is the time required by the reaction to gain the maximum velocity (V max) during the propagation phase (34). Peroxidation of LDL. The lipid peroxide content of LDL was evaluated spectrophotometrically by the measurement of MDA using the thiobarbituric acid-reacting substance assay (35). LDL (200 g of proteins) was mixed with 1.5 ml of 0.67% thiobarbituric acid and with 1.5 ml of 10% trichloroacetic acid, containing 1 mg/ml EDTA. After heating at 100 C for 30 min, fluorescent reaction products were assayed on a PerkinElmer LS 45 spectrophotometer (PerkinElmer, Norwalk, CT) with an excitation wavelength of 513 nm and an emission wavelength of 553 nm. Fresh diluted tetramethoxypropane, which yields MDA, was used as a standard, and results were expressed as nanomoles of MDA per milligram of LDL-C (36). Vitamin E determination. Plasma and LDL vitamin E, expressed in micromoles per liter and micromoles per milligram of LDL-C, respectively, were measured with high performance liquid chromatography using a Kontrol System 450 (Milan, Italy) equipped with a UV-visible spectrophotometer (Kontrol Detector 430) at different wavelengths. Procedures were performed as previously reported (37). Calculation. We used the following indexes for determination of IR (38): baseline glucose to insulin ratio (G/I) (IR was defined as G/I ⬍ 6) (39) and homeostasis model assessment of IR (HOMA-IR) calculated with the formula: [fasting insulin (microunits per milliliter) ⫻ fasting glucose (millimoles per liter)]/22.5.
1374
J Clin Endocrinol Metab, April 2007, 92(4):1372–1378
Statistical analysis All values were expressed as means and sd. We analyzed differences in variables between the three groups by one-way ANOVA with Tukey’s test for post hoc comparison of means between each pair of groups. Pearson correlation coefficient was used for testing variables of interest. Statistical significance level was P ⬍ 0.05. Differences in sex variable were analyzed by Fisher’s exact test. All calculations were made with the computer program SPSS (Statistical Package for the Social Science) version 10.
Results Baseline characteristics
Baseline clinical characteristics, anthropometric measurements, and laboratory investigation of all subjects are reported in Table 1. The three groups (SGA⫹, SGA⫺, controls) were similar for age, sex, WHR. BW was significantly lower in SGA⫹ and SGA⫺ children when compared with the control group (P ⫽ 0.0001 and P ⫽ 0.0001, respectively). A significant difference was found in terms of BMI and SDS BMI between the three groups: both parameters were significantly higher in SGA⫹ children when compared with the SGA⫺ group (P ⫽ 0.04 and P ⫽ 0.04, respectively), whereas no difference was found between SGA⫹ children and controls (P ⫽ 0.99 and P ⫽ 0.98). Furthermore, a significant difference was found in terms of fat mass; this parameter was significantly lower in the SGA⫺ group when compared with SGA⫹ and control children (P ⫽ 0.004 and P ⫽ 0.006, respectively), whereas no significant difference was found between the SGA⫹ and the control group (P ⫽ 0.99). No significant difference was found between the three groups in terms of fasting glucose, total cholesterol, and triglyceride concentrations, as well as IGF-I and IGFBP-3 levels. IR indexes
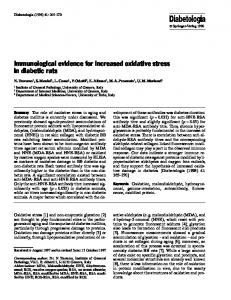
IR indexes of the study population are reported in Fig. 1. Insulin was significantly higher in the SGA⫹ group when compared with controls (P ⫽ 0.04), whereas no difference was observed between the SGA⫹ and the SGA⫺ groups (P ⫽ 0.06), and between SGA⫺ children and the control group
Mohn et al. • Oxidative Stress in SGA Children
(P ⫽ 0.92). C-peptide was significantly higher in the SGA⫹ group in comparison to controls (P ⫽ 0.03), and between the SGA⫹ and the SGA⫺ groups (P ⫽ 0.03); no difference was observed between SGA⫺ children and controls (P ⫽ 0.98). HOMA-IR was significantly higher in SGA⫹ children when compared with controls (P ⫽ 0.04), and a significant difference was also detected between SGA⫹ and SGA⫺ children (P ⫽ 0.03); no difference was observed between the SGA⫺ and the control group (P ⫽ 0.99). Furthermore, G/I was significantly lower in SGA⫹ children when compared with the control group (P ⫽ 0.04), and a significant difference was also found between SGA⫹ and SGA⫺ children (P ⫽ 0.02); no significant difference was detected when SGA⫺ children when compared with the control group (P ⫽ 0.99). Oxidant-antioxidant status
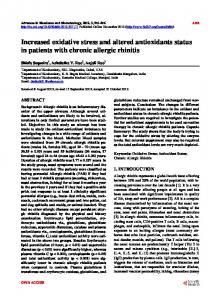
Oxidant-antioxidant status of the study population is reported in Fig. 2. Lag phase was significantly shorter in SGA⫹ children when compared with the control group and to the SGA⫺ children (24.3 ⫾ 4.38 vs. 45.28 ⫾ 7.69, and vs. 35.59 ⫾ 11.29 min; P ⫽ 0.0001 and P ⫽ 0.003, respectively); a significant difference was also found between the SGA⫺ and the control group (P ⫽ 0.01). MDA was significantly higher in SGA⫹ when compared with controls and to SGA⫺ children (0.79 ⫾ 0.3 vs. 0.36 ⫾ 0.04, and vs. 0.6 ⫾ 0.1 nmol/mg; P ⫽ 0.0001 and P ⫽ 0.03, respectively); a significant difference was also observed between the SGA⫺ and the control groups (P ⫽ 0.02). Vitamin E was significantly lower in the SGA⫹ group when compared with controls (27.54 ⫾ 7.9 vs. 43.23 ⫾ 11.32 mol/liter; P ⫽ 0.002), and in the SGA⫺ group when compared with control children (31.34 ⫾ 8.84 vs. 43.23 ⫾ 11.32 mol/liter; P ⫽ 0.02), whereas no significant difference was observed between SGA⫹ and SGA⫺ children (P ⫽ 0.57). No difference was found in terms of LDL vitamin E. In the SGA group, the following correlations were found between IR indexes and markers of oxidative stress. A direct correlation was found between HOMA-IR and MDA (r ⫽ 0.39; P ⫽ 0.01), whereas an inverse correlation was detected between
TABLE 1. Clinical characteristics and biochemical evaluation of the study population SGA⫹
Controls
Pa
4.1 ⫾ 2.59 5 M/11 F 2368.4 ⫾ 442.09 ⫺1.83 ⫾ 0.79 12.27 ⫾ 4.32 15.03 ⫾ 1.46 ⫺0.99 ⫾ 1.32 12.75 ⫾ 8.4 0.89 ⫾ 0.04
4.33 ⫾ 1.88 8 M/11 F 2496.31 ⫾ 135.65 0.12 ⫾ 1.26 16.97 ⫾ 4.64 16.52 ⫾ 2.12 0.45 ⫾ 1.93 21.01 ⫾ 3.44 0.91 ⫾ 0.03
3.43 ⫾ 1.34 7 M/6 F 3387.69 ⫾ 373.56 0.51 ⫾ 0.94 16.36 ⫾ 4.08 16.47 ⫾ 1.57 0.34 ⫾ 1.43 21.16 ⫾ 9.31 0.90 ⫾ 0.06
NS 0.3b 0.0001c 0.0001c 0.005c 0.03c 0.03c 0.002c NS
72.87 ⫾ 9.66 144.58 ⫾ 20.29 74.55 ⫾ 23.19 100.83 ⫾ 45.83 2056.07 ⫾ 353.72
75.15 ⫾ 8.6 152.7 ⫾ 32.62 73.88 ⫾ 25.36 116.55 ⫾ 93.26 2244.57 ⫾ 387.83
74.92 ⫾ 10.82 142.53 ⫾ 20.97 84.84 ⫾ 47 87.18 ⫾ 57.89 2100.45 ⫾ 238
NS NS NS NS NS
SGA⫺
Clinical characteristics Age (yr) Sex Birth weight (g) SDS height Weight (kg) BMI (kg/m2) SDS BMI Fat mass (%) WHR Biochemical evaluation Glycemia (mg/dl) Cholesterol (mg/dl) Triglyceride (mg/dl) IGF-I (ng/ml) IGFBP-3 (ng/ml)
Values are means (⫾SD). NS, No significant difference (P ⬎ 0.05); M, male; F, female. a One-way ANOVA. b Fisher’s exact test. c Significant differences by post hoc analysis.
Mohn et al. • Oxidative Stress in SGA Children
12
*
J Clin Endocrinol Metab, April 2007, 92(4):1372–1378
C-peptide
INSULIN
1,6 1,4
10
*
1,2
8
ng/mL
μ U/mL
1375
6 4
†
1 0,8 0,6 0,4
2
0,2 0
0
SGA +
SGA -
SGA +
Controls
HOMA-IR 2,5
*
2
45 40
1,5
35 30
†
1
25 20
0,5
15 10
0
5 0
SGA -
Controls
G/I 50
SGA +
SGA -
Controls
†
*
SGA +
SGA -
Controls
FIG. 1. IR indices of the study population. Significant values by post hoc analysis: *, SGA⫹ vs. controls; †, SGA⫹ vs. SGA⫺; ‡, SGA⫺ vs. controls. P by one-way ANOVA: insulin, P ⫽ 0.02; C-peptide, P ⫽ 0.01; HOMA-IR, P ⫽ 0.01; G/I, P ⫽ 0.01.
HOMA-IR and lag phase (r ⫽ ⫺0.33; P ⫽ 0.04). A direct correlation was found between G/I and lag phase (r ⫽ 0.36; P ⫽ 0.02); an inverse correlation was detected between G/I and MDA (r ⫽ ⫺0.38; P ⫽ 0.02). No significant correlations were found between markers of oxidative stress and fatness indexes (Table 2). Discussion
It is well known that low BW is tightly linked to an increased rate in adulthood of hypertension (40), artery disease, abnormalities in lipid metabolism and blood coagulation (6, 7), all predictive of a greater risk of ischemic heart disease (41, 42). This increased risk of adult-onset cardiovascular and metabolic dysfunctions has been attributed to a reduced insulin sensitivity, already evident during the prepubertal period (2, 5). This study is, to the best of our knowledge, the first evaluating insulin sensitivity, oxidant-antioxidant status, and their mutual correlations in prepubertal children born SGA in comparison to AGA. Our data clearly show that SGA⫹ children have significantly lower insulin sensitivity than SGA⫺ children and controls: in fact, HOMA-IR values were significantly higher in the SGA⫹ group when compared with the SGA⫺ group and to controls, whereas G/I values were significantly lower in SGA⫹ children when compared with SGA⫺ and control children. These findings are in agreement with previous data reported by Veening et al. (22) who demonstrated, in a small sample of SGA children, a significant rate of IR that was strongly associated with postnatal catch-up growth: SGA⫹ children, especially those with a BMI greater than 17 kg/m2, were more insulin resistant than SGA⫺ children and controls. The clamp technique, used by these authors, is recognized as the gold standard (38) to
measure IR, whereas indexes derived from fasting blood glucose and insulin levels such as HOMA-IR and G/I used in the present study are considered surrogate measures. However, recent data clearly demonstrate that these indexes are a valid tool for estimating IR in children (43, 44). The significantly decreased insulin sensitivity in our SGA⫹ children points out the critical role of catch-up growth which is normally associated with substantial change in body distribution: in fact, a large epidemiological study showed that children who experience significant catch-up for weight in the first 2 yr of life are taller, heavier, and fatter at 5 yr and have a lower birth weigh than those who do not. In fact, SGA children who showed an efficient catch-up growth during infancy display a dramatic adiposity increase (15, 18) with increased percentage of body fat, reflected by a greater BMI (15) and increased fat mass as also seen in our SGA⫹ children. However, SGA⫹ children not only demonstrated a significantly decreased insulin sensitivity but also substantially altered oxidant-antioxidant status. Oxidative stress plays a fundamental role in the pathophysiology of endothelial dysfunction, inflammation, and atherosclerotic cardiovascular disease. In the present study, we used lag phase, MDA, and vitamin E to explore the oxidant system; all these compounds are recognized as being reliable markers of this system in humans (29). Our data clearly show that lag phase, an index inversely related to oxidative stress, is significantly shorter in SGA⫹ children when compared with control children. Likewise, a significant difference was found in MDA, an index directly related to oxidative stress, which was on average 2-fold greater in the SGA⫹ group the values found in the control group. This altered oxidant status was associated with decreased plasma vitamin E levels in SGA⫹ than in
1376
J Clin Endocrinol Metab, April 2007, 92(4):1372–1378
Mohn et al. • Oxidative Stress in SGA Children
MDA
Lag phase 60
1
nmol/mg
min
40 30
1,2
‡
†
50
*
20 10
‡
0,4
SGA +
Controls
SGA -
Vit. E
60
20 10
Controls
6
μmol/mg LDL-C
*
SGA -
Vit. E LDL
‡
50
μmol/liter
0,6
0
SGA +
30
†
0,8
0,2
0
40
*
5 4 3 2 1 0
0
SGA +
Controls
SGA -
SGA +
SGA -
Controls
FIG. 2. Oxidant-antioxidant status of the study population. Significant values by post hoc analysis: *, SGA⫹ vs. controls; †, SGA⫹ vs. SGA⫺; ‡, SGA⫺ vs. controls. P by one-way ANOVA: lag phase, P ⫽ 0.0001; MDA, P ⫽ 0.0001; vitamin E, P ⫽ 0.003.
control children. The reason underlying this alteration of the oxidant-antioxidant status remains speculative. However, it might be the result of the reduced insulin sensitivity observed in this risk group supported by the suggestive correlations found between IR and oxidative stress. In fact, a recent study has shown that one major mechanism of vascular dysfunction with IR involves the increased generation, availability, and/or actions of reactive oxygen species (45). Furthermore, many studies report a strong relationship beTABLE 2. Multivariate correlates of lag phase, MDA, and vitamin E
Lag phase (min) HOMA-IR G/I MDA Vitamin E BMI WHR Fat mass MDA (nmol/mg) HOMA-IR G/I Vitamin E BMI WHR Fat mass Vitamin E (mol/liter) HOMA-IR G/I BMI WHR Fat mass
r
P
⫺0.33 0.36 ⫺0.23 0.34 ⫺0.12 ⫺0.14 ⫺0.34
0.04 0.02 0.23 0.12 0.52 0.52 0.09
0.39 ⫺0.38 ⫺0.05 0.21 0.11 0.18
0.01 0.02 0.81 0.25 0.6 0.35
⫺0.29 0.32 ⫺0.06 ⫺0.09 ⫺0.04
0.16 0.11 0.76 0.7 0.83
tween increased IR and different risk factors for cardiovascular disease in prepubertal SGA children, such as an increase systolic blood pressure (46). This is plausible because hydrogen peroxide generation seems to be linked to action of insulin itself which might also induce the production of cytokines. The subsequent increased oxidative stress is responsible of cell membranes damage and oxidation of lowdensity lipoproteins, which represents a key step in the generation of foam cells and fatty streak leading to the development and progression of atherosclerosis (47). Recently a further hypothesis has emerged to explain the fetal origin of later diseases of SGA children. This “oxidative stress hypothesis” (48) postulates that impaired redox balance during the intrauterine life might modulate gene expression (49, 50), function and proliferation of pancreatic -cells (51, 52), and blood pressure (53, 54). In fact, Gupta et al. (55) recently demonstrated that neonates born SGA present increased oxidative stress, suggesting that the intrauterine period is, as a matter of fact, critical for its development, most likely due to intrauterine malnutrition (55, 56). This observation is supported by our results. In fact, SGA⫺ children presented values for lag phase and MDA in between SGA⫹ and control children, being significantly different from both. These results suggest a background oxidative derangement in SGA population, which is exacerbated in SGA⫹ children by the reduced insulin sensitivity burden induced by the effective catch-up growth. Without any doubt, the major limitation of the present study is the relatively small sample size because this might implicate that the results are not easily applicable to the whole population of prepubertal SGA children. However,
Mohn et al. • Oxidative Stress in SGA Children
the presence of two different SGA populations compared with normal controls explores widely a possible alteration of the oxidative system. Furthermore, it needs to be acknowledged that these results might be adaptive and facilitated by improved growth. In summary, our data show that oxidative stress is already present during the prepubertal age in both SGA⫹ and SGA⫺ children, with a continuous alteration in oxidant-antioxidant status in relation to IR. These findings confirm the important role of postnatal catch-up growth, which seems to exercise the greatest influence. Because metabolic abnormalities are already evident during the prepubertal age, oxidant-antioxidant status might be a potential marker for the early identification and intervention in the development of future metabolic and cardiovascular dysfunctions.
J Clin Endocrinol Metab, April 2007, 92(4):1372–1378
18.
19.
20. 21.
22.
23. 24. 25.
Acknowledgments Received June 22, 2006. Accepted January 23, 2007. Address all correspondence and requests for reprints to: Angelika Mohn, Department of Pediatrics, University of Chieti, Via Dei Vestini 15, 66100 Chieti, Italy. E-mail:
[email protected]. Conflict of Interest: None. The authors have nothing to disclose.
References 1. Barker DJ, Winter PD, Osmond C, Margetts B, Simmonds SJ 1989 Weight in infancy and death from ischaemic heart disease. Lancet 2:577–580 2. Levy-Marchal C, Jaquet D 2004 Long-term metabolic consequences of being born small for gestational age. Pediatr Diabetes 5:147–153 3. Barker DJ, Hales CN, Fall CH, Osmond C, Phipps K, Clark PM 1993 Type 2 (non-insulin-dependent) diabetes mellitus, hypertension and hyperlipidaemia (syndrome X): relation to reduced fetal growth. Diabetologia 36:62– 67 4. Valdez R, Athens MA, Thompson GH, Bradshaw BS, Stern MP 1994 Birthweight and adult health outcomes in a biethnic population in the USA. Diabetologia 37:624 – 631 5. Eriksson JG, Forsen T, Tuomilehto J, Jaddoe VW, Osmond C, Barker DJ 2002 Effects of size at birth and childhood growth on the insulin resistance syndrome in elderly individuals. Diabetologia 45:342–348 6. Hales CN, Barker DJ, Clark PM, Cox LJ, Fall C, Osmond C, Winter PD 1991 Fetal and infant growth and impaired glucose tolerance at age 64. BMJ 303: 1019 –1022 7. Barker DJ 1995 Fetal origins of coronary heart disease. BMJ 311:171–174 8. Chatelain P 2000 Children born with intra-uterine growth retardation (IUGR) or small for gestational age (SGA): long term growth and metabolic consequences. Endocr Regul 34:33–36 9. Reaven GM 1988 Banting lecture 1988: role of insulin resistance in human disease. Diabetes 37:1595–1607 10. Jaquet D, Deghmoun S, Chevenne D, Collin D, Czernichow P, Levy-Marchal C 2005 Dynamic change in adiposity from fetal to postnatal life is involved in the metabolic syndrome associated with reduced fetal growth. Diabetologia 48:849 – 855 11. Ferrannini E, Haffner SM, Mitchell BD, Stern MP 1991 Hyperinsulinaemia: the key feature of a cardiovascular and metabolic syndrome. Diabetologia 34:416 – 422 12. Modan M, Halkin H, Almog S, Lusky A, Eshkol A, Shefi M, Shitrit A, Fuchs Z 1985 Hyperinsulinemia. A link between hypertension obesity and glucose intolerance. J Clin Invest 75:809 – 817 13. Eriksson JG, Forsen T, Tuomilehto J, Winter PD, Osmond C, Barker DJ 1999 Catch-up growth in childhood and death from coronary heart disease: longitudinal study. BMJ 318:427– 431 14. Mericq V, Ong KK, Bazaes R, Pena V, Avila A, Salazar T, Soto N, Iniguez G, Dunger DB 2005 Longitudinal changes in insulin sensitivity and secretion from birth to age three years in small- and appropriate-for-gestational-age children. Diabetologia 48:2609 –2614 15. Ong KK, Ahmed ML, Emmett PM, Preece MA, Dunger DB 2000 Association between postnatal catch-up growth and obesity in childhood: prospective cohort study. BMJ 320:967–971 16. Cianfarani S, Germani D, Branca F 1999 Low birthweight and adult insulin resistance: the “catch-up growth” hypothesis. Arch Dis Child Fetal Neonatal Ed 81:F71–F73 17. Ezzahir N, Alberti C, Deghmoun S, Zaccaria I, Czernichow P, Levy-Marchal C, Jaquet D 2005 Time course of catch-up in adiposity influences adult an-
26.
27.
28. 29.
30. 31.
32. 33.
34.
35.
36.
37.
38.
39. 40.
41. 42. 43.
44.
1377
thropometry in individuals who were born small for gestational age. Pediatr Res 58:243–247 Jaquet D, Leger J, Tabone MD, Czernichow P, Levy-Marchal C 1999 High serum leptin concentrations during catch-up growth of children born with intrauterine growth retardation. J Clin Endocrinol Metab 84:1949 –1953 Eriksson J, Forsen T, Tuomilehto J, Osmond C, Barker D 2001 Size at birth, childhood growth and obesity in adult life. Int J Obes Relat Metab Disord 25:735–740 Eriksson J, Forsen T, Tuomilehto J, Osmond C, Barker D 2002 Size at birth, fat-free mass and resting metabolic rate in adult life. Horm Metab Res 34:72–76 Bavdekar A, Yajnik CS, Fall CH, Bapat S, Pandit AN, Deshpande V, Bhave S, Kellingray SD, Joglekar C 1999 Insulin resistance syndrome in 8-year-old Indian children: small at birth, big at 8 years, or both? Diabetes 48:2422–2429 Veening MA, Van Weissenbruch MM, Delemarre-Van De Waal HA 2002 Glucose tolerance, insulin sensitivity, and insulin secretion in children born small for gestational age. J Clin Endocrinol Metab 87:4657– 4661 Ong KK, Dunger DB 2004 Birth weight, infant growth and insulin resistance. Eur J Endocrinol 151(Suppl 3):U131–U139 Rice-Evans C, Burdon R 1993 Free radical-lipid interactions and their pathological consequences. Prog Lipid Res 32:71–110 Inoguchi T, Li P, Umeda F, Yu HY, Kakimoto M, Imamura M, Aoki T, Etoh T, Hashimoto T, Naruse M, Sano H, Utsumi H, Nawata H 2000 High glucose level and free fatty acid stimulate reactive oxygen species production through protein kinase C-dependent activation of NAD(P)H oxidase in cultured vascular cells. Diabetes 49:1939 –1945 Furukawa S, Fujita T, Shimabukuro M, Iwaki M, Yamada Y, Nakajima Y, Nakayama O, Makishima M, Matsuda M, Shimomura I 2004 Increased oxidative stress in obesity and its impact on metabolic syndrome. J Clin Invest 114:1752–1761 Weinbrenner T, Schroder H, Escurriol V, Fito M, Elosua R, Vila J, Marrugat J, Covas MI 2006 Circulating oxidized LDL is associated with increased waist circumference independent of body mass index in men and women. Am J Clin Nutr 83:30 –35 Lee YS, Chou YH 2005 Antioxidant profiles in full term and preterm neonates. Chang Gung Med J 28:846 – 851 Del Rio D, Stewart AJ, Pellegrini N 2005 A review of recent studies on malondialdehyde as toxic molecule and biological marker of oxidative stress. Nutr Metab Cardiovasc Dis 15:316 –328 Brook CG 1971 Determination of body composition of children from skinfold measurements. Arch Dis Child 46:182–184 Kotler DP, Burastero S, Wang J, Pierson Jr RN 1996 Prediction of body cell mass, fat-free mass, and total body water with bioelectrical impedance analysis: effects of race, sex, and disease. Am J Clin Nutr 64(3 Suppl):489S– 497S Lowry OH, Rosebrough NJ, Farr AL, Randall RJ 1951 Protein measurement with the Folin phenol reagent. J Biol Chem 193:265–275 Belcher JD, Balla J, Balla G, Jacobs Jr DR, Gross M, Jacob HS, Vercellotti GM 1993 Vitamin E, LDL, and endothelium. Brief oral vitamin supplementation prevents oxidized LDL-mediated vascular injury in vitro. Arterioscler Thromb 13:1779 –1789 Esterbauer H, Striegl G, Puhl H, Rotheneder M 1989 Continuous monitoring of in vitro oxidation of human low density lipoprotein. Free Radic Res Commun 6:67–75 Simon BC, Cunningham LD, Cohen RA 1990 Oxidized low density lipoproteins cause contraction and inhibit endothelium-dependent relaxation in the pig coronary artery. J Clin Invest 86:75–79 Mezzetti A, Guglielmi MD, Pierdomenico SD, Costantini F, Cipollone F, De Cesare D, Bucciarelli T, Ucchino S, Chiarelli F, Cuccurullo F, Romano F 1999 Increased systemic oxidative stress after elective endarterectomy: relation to vascular healing and remodeling. Arterioscler Thromb Vasc Biol 19:2659 –2665 Lee BL, Chua SC, Ong HY, Ong CN 1992 High-performance liquid chromatographic method for routine determination of vitamins A and E and -carotene in plasma. J Chromatogr 581:41– 47 Heinze E, Holl RW 2003 Tests of -cell function in childhood and adolescence. In: Ranke MB, ed. Diagnostics of endocrine function in children and adolescents. Basel: Karger; 318 –338 Caro JF 1991 Clinical review 26: insulin resistance in obese and nonobese man. J Clin Endocrinol Metab 73:691– 695 Barker DJ, Godfrey KM, Osmond C, Bull A 1992 The relation of fetal length, ponderal index and head circumference to blood pressure and the risk of hypertension in adult life. Paediatr Perinat Epidemiol 6:35– 44 Eriksson JG, Forsen T, Tuomilehto J, Osmond C, Barker DJ 2000 Early growth, adult income, and risk of stroke. Stroke 31:869 – 874 Eriksson JG, Forsen T, Tuomilehto J, Osmond C, Barker DJ 2001 Early growth and coronary heart disease in later life: longitudinal study. BMJ 322:949 –953 Gungor N, Saad R, Janosky J, Arslanian S 2004 Validation of surrogate estimates of insulin sensitivity and insulin secretion in children and adolescents. J Pediatr 144:47–55 Hoffman RP, Vicini P, Cobelli C 2004 Pubertal changes in HOMA and QUICKI: relationship to hepatic and peripheral insulin sensitivity. Pediatr Diabetes 5:122–125
1378
J Clin Endocrinol Metab, April 2007, 92(4):1372–1378
45. Busija DW, Miller AW, Katakam P, Erdos B 2006 Adverse effects of reactive oxygen species on vascular reactivity in insulin resistance. Antioxid Redox Signal 8:1131–1140 46. Arends NJ, Boonstra VH, Duivenvoorden HJ, Hofman PL, Cutfield WS, Hokken-Koelega AC 2005 Reduced insulin sensitivity and the presence of cardiovascular risk factors in short prepubertal children born small for gestational age (SGA). Clin Endocrinol (Oxf) 62:44 –50 47. Ceconi C, Boraso A, Cargnoni A, Ferrari R 2003 Oxidative stress in cardiovascular disease: myth or fact? Arch Biochem Biophys 420:217–221 48. Luo ZC, Fraser WD, Julien P, Deal CL, Audibert F, Smith GN, Xiong X, Walker M 2006 Tracing the origins of “fetal origins” of adult diseases: programming by oxidative stress? Med Hypotheses 66:38 – 44 49. Turpaev KT 2002 Reactive oxygen species and regulation of gene expression. Biochemistry (Mosc) 67:281–292 50. Hancock JT, Desikan R, Neill SJ 2001 Role of reactive oxygen species in cell signalling pathways. Biochem Soc Trans 29(Pt 2):345–350 51. Linning KD, Tai MH, Madhukar BV, Chang CC, Reed Jr DN, Ferber S, Trosko JE, Olson LK 2004 Redox-mediated enrichment of self-renewing adult
Mohn et al. • Oxidative Stress in SGA Children
52.
53.
54.
55. 56.
human pancreatic cells that posses endocrine differentiation potential. Pancreas 29:e64 – e76 Wang X, Li H, De Leo D, Guo W, Koshkin V, Fantus IG, Giacca A, Chan CB, Der S, Wheeler MB 2004 Gene and protein kinase expression profiling of reactive oxygen species-associated lipotoxicity in the pancreatic -cell line MIN6. Diabetes 53:129 –140 Franco Mdo C, Dantas AP, Akamine EH, Kawamoto EM, Fortes ZB, Scavone C, Tostes RC, Carvalho MH, Nigro D 2002 Enhanced oxidative stress as a potential mechanism underlying the programming of hypertension in utero. J Cardiovasc Pharmacol 40:501–509 Racasan S, Braam B, van der Giezen DM, Goldschmeding R, Boer P, Koomans HA, Joles JA 2004 Perinatal l-arginine and antioxidant supplements reduce adult blood pressure in spontaneously hypertensive rats. Hypertension 44:83– 88 Gupta P, Narang M, Banerjee BD, Basu S 2004 Oxidative stress in term small for gestational age neonates born to undernourished mothers: a case control study. BMC Pediatr 4:14 Fowden AL, Forhead AJ 2004 Endocrine mechanism of intrauterine programming. Reproduction 127:515–526
JCEM is published monthly by The Endocrine Society (http://www.endo-society.org), the foremost professional society serving the endocrine community.