INDICES OF THE COSMIC RAY ACTIVITY AS REFLECTION OF SITUATION IN INTERPLANETARY MEDIUM A. V. Belov, E. A. Eroshenko, V. G. Yanke Institute of Terrestrial Magnetism, Ionosphere and Radio Wave Propagation (IZMIRAN), 142092, Troitsk, Moscow region, Russia e-mail:
[email protected]
ABSTRACT Till now there were not quantitative estimations of the cosmic ray (CR) disturbance, as, for example, it is made for the geomagnetic activity. In present work we try to give the special indices on the level of CR activity, which can characterise some peculiarities of the space weather. These indices are calculated for every hour and every day within the period 1990-1995 on the base of CR density and anisotropy, obtained from the world neutron monitor network. As examples of these indices behavior several events during this period are considered. The possibility to obtain indices from a single station data is discussed. INTRODUCTION Various indices, as a simplified quantitative characteristic of complicated versatile phenomena, are extensively used in solar-terrestrial physics. The indices of the solar activity (Wolf numbers, for example) and geomagnetic disturbances (Kp, Ap, Dst, AA and others) (Bartels 1957, Mayaud 1972) allow to select and compare the different phenomena, to distinguish the quiet and disturbed periods. Cosmic rays (CR), being a component of the interplanetary medium, naturally respond to its changing, and not less sensitively, than the Earth magnetosphere. The analogue of the magnetic storms in cosmic rays are Forbush-effects (FEs), associated with the solar ejecta (CME) and with propagating solar wind disturbances. In fact, these are the storms in cosmic rays, when a density and anisotropy of CR are changing significantly and sometimes catastrophically (for examples, Belov et al. 1997b). All the more strong disturbances may occur with the solar CR incoming at Earth, when CR flux may grow more than in order, and an anisotropy increases practically to 100% (Shea and Smart 1993). Surely, such events are rare enough to occur, but the variations of CR are evident forever, and the level of their disturbance changes permanently, reflecting the conditions of the interplanetary medium. However, no quantitative characteristic of such a disturbance exists till now. The aim of the present work is to propose a method for calculation the indices of CR activity (CRA-indices), to study the behaviour of
these indices and their relation with solar activity, with interplanetary and geomagnetic disturbances. METHODS AND DATA Data from the world wide neutron monitor (NM) network have been used as the basis to obtain of CRA indices. This multichannel detector has a long (>40 years) homogenous set of data, containing an information about variations as density, so anisotropy of cosmic rays. These variations reflect all great disturbances of the interplanetary space and most important (in terms of the radiation danger) solar cosmic ray enhancements. Hourly data of density and first harmonic of CR anisotropy (for CR 10 GV rigidity) through 1990-1995, found by the global survey method (Belov at al. 1997a), have been used for calculations of the indices. Intuition suggests, what a distinct is between quiet and disturbed state of the cosmic rays. In the quiet conditions the density and anisotropy of CR are almost constant and amplitude and direction of the anisotropy are close to the normal for a given period. In contrast to this, the big changes of density and anisotropy and significant deflections from normal anisotropy are inherent for disturbed period. Let we know the density variation Ao and three component of the anisotropy vector Ax, Ay, Az in the ecliptic reference system for two consecutive hours t-1 and t. To compare observed and normal anisotropy it is better to use the Earth’s reference system and only two components of the anisotropy ax and ay because of the difficulties on definition of the absolute value of the north-south anisotropy (Belov et al. 1990) and of its strong IMF polarity dependence. We can present a disturbance of CR as following: 2
∆ ∆ ∆ D = 0 + 1 + xy , s0 s1 sxy 2
where
2
(1)
∆20 = (A 0 (t)− A 0 (t− 1)) , 2
(
)
∆21 = (A x () t − A x (t− 1)) + A y () t − A y (t− 1) + (A z() t − A z(t− 1)) 2
2
(
2
)
t − ay0 , ∆2xy = (ax (t)− ax0 ) + ay () 2
2
and s0, s 1, sxy – are the normalizing coefficients.
,
Using variations of CR we can’t forget of their statistical nature. A typical statistical error of the density of 10 GV CR obtained by global survey method is about 0.05%, and for the components of the anisotropy it is a little more – about 0.1%. These statistical errors may be taken to obtain the normalizing coefficients. Another possible approach is to investigate the behavior and distribution of the CR disturbance components (the items in (1)) during the selected quiet period. For our data it was 1995 year, when rms deviations for ∆0, ∆1, ∆xy are 0.07%, 0.14% and 0.21% respectively. These values have been used as the normalizing coefficients S0, S1, Sxy. All three items in (1) give an approximately equal contribution under this approach. Vector of CR anisotropy has a significant longterm variation, especially within the solar magnetic cycle Thus, it turned in 1990-1995 from~85º to ~59º, that associated with the solar polarity reverse (Belov at al., 1997a). To avoid such long-term effect, as the components of the normal anisotropy ax0 и ay0 we used running averaged ax and ay for one solar rotation, directly preceded to the current hour. Therewith, if only one difference ax-ax0 or ay-ay0 exceeded by absolute value 2sxy, this hour was excluded from the averaging. To go from D to CRA- indices the following has been done: 1) since the anisotropy appears in two items of (1), but density is only in one, the first item was doubled; 2) to reduce the contribution of stochastic fluctuations, D was exchanged on D-1, and when (D-1)8 appeared once per day, >15- once a week, and >27 - once per month. The distribution of CRA indices in different periods could strongly differ from the average. Thus, in the quiet 1995 CRA indices exceeded 7 only once per week and never was >13. The most disturbed hours were recorded during the increasing of solar cosmic rays (GLE) 24.05.90 and 15.06.91. We have to point here, that used global
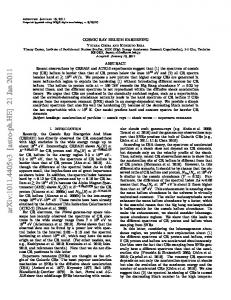
Figure 1. Variations of CR density and CR activity indices in disturbed periods of 1991. survey method is not dedicated for GLE analysis, so, found for GLE hours characteristics density and anisotropy are not precise and not associated with 10 GV particles, sooner, with 3 GV. However, they reflect adequately enough the level of CR disturbance, and we can expend on these hours the common method of CRA-indices calculation. The periods with significant contribution of solar cosmic rays are very seldom. Practically all along the changing of CRA-indices is conditioned by the galactic cosmic ray variations and disturbances of the interplanetary space. The behavior of CRA indices in two disturbed periods of 1991 is presented in Fig. 1 a, b. The biggest increasing of the activity we see during the great FEs 24.03 , 28.10 and 8.11.1991. In the first of these events CRA indices reached the value 84, and in two last-127. It is the greatest modulation effects over the whole 6 years. FEs of 24.03 and 28.10 are in the list of the biggest FEs for the history of observations, and FE of 08.11 despite of the lower amplitude of decrease, was followed by the extremely large magnetic storm, when
Figure 2 Variations of CR density and CR activity indices in quiet period of 1991.
with solar activity is seen well: near the maximum, on 1991, annual CRA-indices was 4.9, whereas close to minimum on 1995 it decreased to 2.6. The frequency histogram of hourly mean (CRA) and daily mean (CRAd ) indices is given in Fig.4.
Figure 3. CR density variations and CRAd indices through 1990-1995. Dst-variation fall down to -345. The disturbance increased also during another FEs in this periods (910.03,13-14.03, 1.11 and other). As a rule, the big CRA-indices correspond to the large FEs, but not always. For example, on 01.11.98 CRA-index increased to 48, that not strongly differs from the maximal indices in the giant FE on 24.03. On the period under consideration CRA-indices very often exceeded 10, and small indices (0-4) appeared rarely. For a comparison the quiet period (practically any time of 1995) was considered. The variations of CR density and CRA- indices in April-May 1995 are presented in Fig.2. Of course, CR variations don’t disappear completely near the solar activity minimum (Belov et al. 1997a ), but the big effects are absent at this time. Indeed, no one FE during two considered months exceeded 2%, and total change of CR density was less 4%. CRA-index reaches 10 only once for this period. From other side, there were several long intervals, when CRA indices was 15, or, better, >18. If we want to obtain a reliable information about smaller disturbances, we have to analyse hourly mean indices for several last hours and use the averaged indices (CRAmosc24 and so on). Moscow neutron monitor is a large-square detector with 24 counters, but it is suited close to sea level and is exceeded in a number of recorded particles by some high mountain
stations. Using data from such stations (for example, Alma-Ata, 3340m) for calculation of CRA- indices can reduce a statistical error of indices more than once. But the most prospectively is to combine in real time data from several NMs. So far we realized and presented here the only possibility to obtain CRA indices in real time. We may look online the behavior of such induces via INTERNET on the experimental page: http://helios.izmiran.rssi.ru/cosray/main.htm, where CRAmosc and CRAmosc24 plot is updated every hour. CONCLUSION The variations of CR density and anisotropy, calculated by the global survey method, give the reliable base for the retrospective analysis of CR disturbance and calculation of the global CRA-indices. Data from a single NM allow to follow of CR disturbance in real time. However, the prompt (in an hour) and reliable information about disturbance onset from such data one can pick up until only for a great disturbance. The involving on INTERNET the complementary data from other stations (especially from high mountain) in real time, is bound to take off this problem. ACKNOWLEDGEMENTS This work is supported by the Russian Federal Program “Astronomy” and RFFR grant 980217315. REFERENCES Bartels J. (1957), The technique of scaling indices K and Q of geomagnetic activity., Ann. Intern. Geophys. Year v. 4, part I, pp. 215-236 Belov A.V., Dorman L.I., Eroshenko E.A., Oleneva V.A. (1990) Determination of the absolute value of north-south cosmic ray anisotropy from ground-based data. Proc. 21-th ICRC. Adelaide, v.6, pp. 357-381 Belov A.V., Eroshenko E.A., Yanke V.G. (1997a) Modulation effects in 1991-1992 years. Proc. 25 ICRC, v.1, pp.437-440 Belov A.V., Eroshenko E.A., Yanke V.G. (1997b) Modulation effects in 1991-1994 years. Correlated phenomena at the Sun, in the Heliosphere and in Geospace, SP-415, ESA, ESTEC, pp. 463-469 Mayaud P.N., (1972) The aa-indices: a 100-year series characterizing the magnetic activity. Journal of Geophysical Research , v.77, No.34, pp. 68706874 Shea M.A. and Smart D.F. (1993) History of solar proton event observations. Nucl. Phys. B (Proc. suppl.), 39A, pp. 16-25 Shea M.A., Smart D.F., Humble J.E., Fluckiger E.O., Gentile L.C. and M.R. Nichol (1987). A revised Standard Format for Ground Level Event Data, Proc.20th ICRC, v.3, pp.171-174