Berardi, Robert Stickgold, Stephen M. Kosslyn, and. Eve Van Cauter. Individual differences in subjective and objective alertness during sleep deprivation are ...
Am J Physiol Regul Integr Comp Physiol 284: R280–R290, 2003; 10.1152/ajpregu.00197.2002.
Individual differences in subjective and objective alertness during sleep deprivation are stable and unrelated RACHEL LEPROULT,1 EGIDIO F. COLECCHIA,1 ANNA MARIA BERARDI,2 ROBERT STICKGOLD,3 STEPHEN M. KOSSLYN,4 AND EVE VAN CAUTER1 1 Department of Medicine, University of Chicago, Chicago, Illinois 60637; 2 Department of Psychology, University of Metz, Metz, 57045 France; 3 Massachusetts Medical Health Center, Harvard Medical School, Boston 02115; and 4 Department of Psychology, Harvard University, Cambridge, Massachusetts 02138 Submitted 8 April 2002; accepted in final form 18 October 2002
Leproult, Rachel, Egidio F. Colecchia, Anna Maria Berardi, Robert Stickgold, Stephen M. Kosslyn, and Eve Van Cauter. Individual differences in subjective and objective alertness during sleep deprivation are stable and unrelated. Am J Physiol Regul Integr Comp Physiol 284: R280–R290, 2003; 10.1152/ajpregu.00197.2002.—This study examines the individual reproducibility of alterations of subjective, objective, and EEG measures of alertness during 27 h of continuous wakefulness and analyzes their interrelationships. Eight subjects were studied twice under similar constant-routine conditions. Scales and performance tasks were administered at hourly intervals to define temporal changes in subjective and objective alertness. The wake EEG was recorded every 2 h, 2 min with eyes open and 2 min with eyes closed. Plasma glucose and melatonin levels were measured to estimate brain glucose utilization and individual circadian phase, respectively. Decrements of subjective alertness and performance deficits were found to be highly reproducible for a given individual. Remarkably, there was no relationship between the impairments of subjective and objective alertness. With increased duration of wakefulness, EEG activity with eyes closed increased in the delta range and decreased in the alpha range, but the magnitudes of these changes were also unrelated. These findings indicate that sleep deprivation has highly reproducible, but independent, effects on brain mechanisms controlling subjective and objective alertness.
THE DEMANDS of 24-h operations in modern society imply that many adults need to sustain wakefulness throughout the night. Extended wakefulness across the night is consistently associated with decreases in subjective alertness (or increases in its antonym, subjective sleepiness) and with measurable decrements of performance (i.e., objective alertness or vigilance) on a wide variety of cognitive tasks. Sleep loss involves major individual and societal safety risks (25, 31, 37, 44). Despite the high prevalence of extended wakefulness in modern society, it is not known whether individual differences in measures of subjective and objec-
tive impairments during sleep loss are reproducible from one night to the other. The relationship between subjective and objective impairments across individuals is also poorly documented. In other words, is an individual who reports high levels of sleepiness during a given sleepless night likely to again feel very tired on another similar occasion? And, are high levels of sleepiness in a given individual consistently associated with large decrements of performance on vigilance tasks? These two questions are the main focus of the present study. Temporal variations of subjective and objective alertness across a night of sleep deprivation have been described in numerous studies using standardized scales and a wide variety of performance tests, ranging from simple psychomotor tasks to arithmetic and short-term memory tasks (3, 7, 20, 22, 27, 45). The results have been remarkably consistent and have indicated that subjective and objective alertness varies in parallel, with detectable decreases starting around the usual bedtime, when the circulating levels of melatonin, a hormone with sedative properties (5, 36), are increasing. The decreases in subjective and objective alertness continue until a minimum is attained in the early morning hours, 1 to 2 h after the minimum of body temperature, i.e., between 0600 and 0800 in most young adults (13, 19, 22, 27). Both subjective and objective alertness then improves, despite continued wakefulness, suggesting that activating mechanisms become operative in the morning. Well-documented studies have demonstrated that the temporal variations of both subjective and objective alertness during extended wakefulness are under the dual control of a homeostatic process, relating the decrease in alertness to the duration of prior wakefulness, and of a circadian rhythm promoting alertness across the usual waking period (11–14, 28, 29). For EEG activity during extended waking, the relative importance of the homeostatic and circadian processes was found to depend on the frequency range (1, 2, 4, 17). The similarity of the temporal pattern of alterations in subjective and objective alertness during extended
Address for reprint requests and other correspondence: E. Van Cauter, Dept. of Medicine, MC 1027, Univ. of Chicago, 5841 South Maryland Ave., Chicago, IL 60637 (E-mail: evcauter@medicine. bsd.uchicago.edu).
The costs of publication of this article were defrayed in part by the payment of page charges. The article must therefore be hereby marked ‘‘advertisement’’ in accordance with 18 U.S.C. Section 1734 solely to indicate this fact.
subjective alertness; attention; trait dependence; circadian rhythm
R280
0363-6119/03 $5.00 Copyright © 2003 the American Physiological Society
http://www.ajpregu.org
DISSOCIATION OF SUBJECTIVE AND OBJECTIVE ALERTNESS
wakefulness has led to the implicit assumption that their respective degrees of impairment are quantitatively correlated and that individuals who feel subjectively more sleepy are also more cognitively impaired. Yet, the reproducibility for a given subject of decrements of subjective and objective alertness across a night of sleep deprivation has never been evaluated. Furthermore, the relationship across individuals between the magnitude of increases in subjective sleepiness and the magnitude of decreases in performance on vigilance tasks has not been examined. The present work therefore analyzes subjective and objective alertness, as well as EEG measures across 27 h of continuous wakefulness in healthy young adults who were each studied on two occasions, separated by at least 2 wk, under the same experimental conditions involving constant bed rest, light intensity, and caloric intake under the form of an intravenous glucose infusion. Because exogenous glucose infusion suppresses hepatic glucose production (10, 43) and physical activity is minimal and relatively constant, variations in plasma glucose levels under such experimental conditions provide an indirect measure of changes in brain glucose utilization (39, 41). Temporal variations of melatonin were also simultaneously assessed to obtain an estimation of individual circadian phase (23) and evaluate possible correlations between increases in melatonin levels and decrements of subjective and objective alertness. MATERIALS AND METHODS
Subjects The study included eight healthy men, aged 24 ⫾ 1 yr (means ⫾ SE) with a body mass index of 24.2 ⫾ 1.4 kg/m2. Subjects with a history of psychiatric illness, endocrine illness, or sleep disorders, shift and/or night workers, subjects having crossed time zones during the 6 wk preceding the beginning of the study, and subjects taking any drugs were not included in the study. Positive criteria for selection included regular lifestyles with habitual bedtimes between 2300 and 2400 and wake-up times between 0700 and 0800. The protocol was approved by the Institutional Review Board of the University of Chicago. Written informed consent was obtained from all participants. Experimental Protocol Each subject participated in two studies performed at 2- to 6-wk intervals. The two studies (referred to as study 1 and study 2 with study 2 always following study 1) involved identical experimental conditions for 27 consecutive h (from 1000 on the first day until 1300 on the next day). All subjects also participated in a third study involving early-morning exposure to bright light that was separated from study 1 and study 2 by at least 2 wk and has been described in detail in a recent publication (21). During the week preceding each study, the participants were asked to comply with a standardized schedule of bedtimes (between 2300 and 2400) and wake-up times (between 0700 and 0800). Compliance was verified by examination of continuous recordings of wrist activity (Gaehwiler Electronics, Hobrechtikon, Switzerland). AJP-Regul Integr Comp Physiol • VOL
R281
For each study, the volunteers were admitted to the University of Chicago Clinical Research Center around 0830, received breakfast, and were instructed on the use of computerized performance tests and paper-and-pencil scales. Two sterile heparin-lock catheters were inserted, one in each arm, one for intravenous glucose infusion and one for blood sampling. Electrodes for EEG, electromyogram (EMG), and electrooculogram (EOG) recordings were attached. Starting at 1000, the subjects had to remain awake at bed rest with the head of the bed tilted at a 45° angle and indoor light intensity was maintained in the range 50–150 lx throughout the entire study. They were allowed to watch television, read, play board games, and have conversations with staff and visitors and had access to external time cues (wristwatch, radio, television programs). Objective and subjective measures of alertness were obtained every hour, and the wake EEG was recorded every 2 h from 1100 until the end of the study. At 1200, the subjects received lunch, which constituted their last meal until the end of the study. Starting at 1400, caloric intake was exclusively under the form of an intravenous glucose infusion at a constant rate of 5 g 䡠 kg⫺1 䡠 24 h⫺1. This procedure eliminated behavioral and metabolic effects of meal anticipation, presentation, and ingestion during the remainder of the study. Only water (ad libitum) or diet-decaffeinated sodas (maximum 3 12-oz cans/ day) were allowed. Blood sampling at 15-min interval for the measurement of plasma melatonin and glucose levels was initiated at 1800 and continued until the end of the study. Measures of Objective and Subjective Alertness Starting at 1000, two computerized performance tests were administered at hourly intervals using a portable Macintosh computer to obtain an objective measure of alertness. Both tests are designed to be sensitive to decrements of attention. For both tests, saturation on the learning curve is attained after one to three trials. The two tests were always administered in the same order (selective attention task followed by sustained attention task) and in rapid succession, without an intervening rest period. The selective attention task measures the subject’s ability to allocate attention to a specific location and the ease with which that attention can be shifted. This task was an adaptation of the classic “Posner perceptual cueing task” (33). This task relies on the posterior parietal lobe (9, 34). The volunteer is required to stare at a “⫹” displayed in the center of the computer screen, with one box located laterally to the left of the fixation point and another located laterally to the right of the fixation point. One of the boxes, both boxes, or none of the boxes become(s) highlighted (“cued”) before an asterisk appears in one of the two boxes. The delay between the cue and the appearance of the asterisk may be 50, 150, or 300 ms. The subject has to press the space bar as quickly as possible every time the asterisk appears on the screen. Each test includes 40 trials and lasts ⬃2 min. The sustained attention task measures how well the participant can sustain attention in the absence of salient signals, a function that relies in large part on the right frontal cortex (30, 32). Blurry digits (ranging from 0 to 9) are flashed in the middle of the computer screen in a pseudo-random sequence. The subjects are instructed to press the target key (“H”) when 0 is displayed and the nontarget key (“space bar”) for all other digits. Each test includes 48 trials that are equally divided so that each time interval between digits (500; 1,000; 2,000; and 3,000 ms) receives nine nontarget and three target digits. Four different versions (scripts) of the attention tasks were used to avoid memorization. Lapses were defined as response times 284 • FEBRUARY 2003 •
www.ajpregu.org
R282
DISSOCIATION OF SUBJECTIVE AND OBJECTIVE ALERTNESS
that exceeded the 99th percentile of the distribution of response times measured in each study during the normal waking period, i.e., during the time interval 1000–2300. Mean response times and number of lapses across all trials of both tests were used as objective measures of alertness. The two computerized attention tasks were immediately followed by a paper-and-pencil measure of subjective alertness using the Visual Analog Scale for Global Vigor (26), which combines the scores on four continuous 10-cm scales (alert, sleepy, weary, and effort) to obtain a Global Vigor score between 0 and 40 cm. In total, hourly assessments of objective and subjective alertness needed between 5 and 10 min to be completed.
Glucose and Melatonin Assays
Recordings of the Wake EEG
Time domain analysis. The individual profiles of plasma melatonin were quantified by a best-fit curve obtained using a robust locally weighted regression procedure (8) with a regression window of 3 h. Individual profiles of plasma glucose, hourly Global Vigor scores, response times, and number of lapses on the performance tasks were smoothed using a three-point moving average of the raw data. The timing and value of maximal melatonin levels were quantified using the best-fit curve, whereas the timing and value of minimum and maximum values for glucose, Global Vigor scores, response times, and number of lapses were defined for each subject from the smoothed curve. The onset of nocturnal melatonin secretion was defined as the time of the first concentration exceeding 5 pg/ml not followed by a decrease below 5 pg/ml. For one subject for whom the daytime levels were above 5 pg/ml, the threshold to determine the onset of nocturnal melatonin secretion was estimated as the mean concentration from 1800 until 2000. For each of the 13 EEG recording times in the 27-h study period, mean spectral power was calculated in each of the six frequency ranges. Values were calculated separately for recordings with eyes open and with eyes closed and for both frontal and central derivations. For each frequency range and recording condition, the 13 measures of EEG power over the 27-h period of continuous wakefulness were submitted to a two-way ANOVA with time of recording as repeated measure and derivation (frontal vs. central) as factor. Maxima and minima in profiles of EEG power were estimated from the raw data. Homeostatic and circadian components. All variables sampled at frequent intervals not exceeding 1 h were submitted to an ANOVA with time as repeated measures, including both linear and quadratic orthogonal polynomial contrasts to detect significant homeostatic (linear) and circadian (quadratic) trends. Quadratic trends indicate the existence of a “turning point” in the profile and were therefore interpreted as evidence of circadian effects. Estimation of temporal concordance and quantitative correlations. For each variable, temporal concordance between the profiles observed in the two studies was analyzed by examining cross correlations (rcross) using all temporal determinations (Global Vigor, response time, and number of lapses: 27 data; plasma melatonin and glucose levels: 73 data; EEG: 13 data). Cross correlation analysis was also used to examine temporal concordance between variables. For melatonin, only hourly concentrations during the nocturnal increase (from 1800 to 0500; 12 data) were considered in this analysis. Mean coefficients of cross correlation were calculated using the raw values as well as using Fisher z-transformation. In the latter case, the individual coefficients of cross correlations were first converted using Fisher z-transformation. These values were averaged across the group, and
Starting at 1100, EEG (central derivation Cz and frontal derivation Fz), EMG, and EOG (left and right eyes) recordings were obtained every 2 h for 4 min, 2 min with eyes open and 2 min with eyes closed. The derivations were referred to A1 or A2. The subjects were instructed to fixate on a point on the wall for 2 min and then to close their eyes for 2 min and relax without falling asleep. During the recording, the subjects were under constant supervision via a closed-circuit TV system. EEG signals were low-pass filtered (in addition to a lowpass fourth-order Chebyshev analog filter with a cut-off frequency of 24 Hz, an antialiasing filter was added), high-pass filtered (0.5 Hz), and digitized with a sampling frequency of 50 Hz. The setup was tested with various sampling frequencies, up to 200 Hz on EEG channels. Aliasing effects were nonexistent for the frequency range of interest, i.e., from 0.5 to 25 Hz. Recordings of EEGs were then analyzed by ERA/ PROFILER (Phitools, Grenoble, France), a software package designed to facilitate the detection of artifacts and to perform spectral analyses. For each session of EEG recording and each recording condition (eyes open, eyes closed), the first 20 s after the beginning of recording were eliminated to avoid effects of adaptation. The following 1-min period was analyzed, after artifacts were removed. The ERA software uses the EOG recordings to automatically eliminate 1-s epochs with artifacts due to eye movements (including eye blinks during eyes open recordings). We visually checked the results of this automatic procedure and additionally removed artifacts due to muscular activity based on examination of EMG recordings. In addition, sections of recordings containing any element consistent with stage II sleep (i.e., K-complex and spindles), based on the standard criteria of Rechtschaffen and Kales (35), were eliminated from the analysis. After artifacts were removed, a spectral analysis, using a Fast Fourier Transform, was computed for 2-s epochs for the two EEG derivations with a resolution of 0.5 Hz. The number of artifact-free 2-s epochs averaged 19.5 ⫾ 0.4 across derivations, studies, eye conditions (open or closed), and individuals, indicating that on average, almost two-thirds (almost 40 s of the 1 min analyzed) of the available recordings were submitted to a spectral analysis. Examination of the resulting 24 (from 0.5 to 12 Hz by 0.5 Hz) temporal profiles revealed that qualitative changes in EEG activity across the 27-h period of extended wakefulness could be accurately summarized by averaging, for each 1-min period, the spectral power in six different frequency ranges, i.e., low delta (0.5 to ⬍2.5 Hz), high delta (2.5 to ⬍4.5 Hz), low theta (4.5 to ⬍6.5 Hz), high theta (6.5 to ⬍8.5 Hz), low alpha (8.5 to ⬍10.5 Hz), and high alpha (10.5 to ⬍12.5 Hz). AJP-Regul Integr Comp Physiol • VOL
Glucose levels were measured at the bedside using an automatic analyzer (Yellow Springs Instruments, Yellow Springs, OH) with a coefficient of variation of ⬍2%. Plasma melatonin levels were measured with a doubleantibody RIA using commercially available reagents (Stockgrand, Guilford, Surrey, UK) as previously described (42). The lower limit of sensitivity of the assay was 2.5 pg/ml. The intra-assay coefficient of variation averaged 17.5% for values ⬍10 pg/ml and 8.6% for values ⬎10 pg/ml. All samples from the same subject were measured in the same assay. Data Analysis
284 • FEBRUARY 2003 •
www.ajpregu.org
DISSOCIATION OF SUBJECTIVE AND OBJECTIVE ALERTNESS
the group average was then converted back to obtain the mean coefficient of correlation. Possible quantitative relationships between the changes in melatonin, glucose, subjective and objective alertness, and EEG measures across the 27-h period were explored by examining correlations between relative magnitude of increases or decreases. Relative magnitudes were calculated as the maxima minus the minima, expressed in percent of the maxima for Global Vigor and high alpha data, expressed in percent of the minima for response times and high delta data, expressed in percent of the overall mean across the study period for plasma glucose and melatonin. Statistical Tests All statistical calculations were performed using the StatviewSE⫹ and SuperANOVA softwares (Abacus Concepts, Berkeley, CA). Group results are reported as means ⫾ SE. For correlations, both the parametric Pearson coefficient (rP)
R283
and the nonparametric Spearman coefficient (rSp) were calculated for each pair of variables. When significant (P ⬍ 0.05) correlations were detected by parametric analysis but not confirmed by a similar trend by nonparametric analysis (P ⱕ 0.10), the correlation was considered nonsignificant. RESULTS
Temporal Profiles and Reproducibility of Melatonin, Glucose, and Subjective and Objective Alertness Figure 1 shows the mean profiles of plasma melatonin, plasma glucose, Global Vigor scores, response times, and number of lapses on the attention tasks for study 1 (left) and study 2 (middle). The scatter plots in Fig. 1, right, show the reproducibility of each variable across the two studies for each subject.
Fig. 1. Mean (⫾SE) profiles of plasma melatonin, plasma glucose, subjective alertness (Global Vigor scores), and objective alertness (response times and lapses) for study 1 (left) and study 2 (middle). Right: reproducibility across the 2 studies of the individual values for the measures quantifying the changes in melatonin, glucose, subjective and objective alertness over the 27-h period of continuous wakefulness. Diagonals represent the identity lines.
AJP-Regul Integr Comp Physiol • VOL
284 • FEBRUARY 2003 •
www.ajpregu.org
R284
DISSOCIATION OF SUBJECTIVE AND OBJECTIVE ALERTNESS
Melatonin profiles were remarkably similar in both studies. The amplitude of the nocturnal elevation varied more than fourfold across subjects but was highly reproducible for a given subject (rP ⫽ 0.87, P ⫽ 0.005; rSp ⫽ 0.79, P ⬍ 0.04). The onset of melatonin secretion, generally considered as the most accurate marker of circadian phase, was delayed by an average of 41 min in study 2 compared with study 1 (study 1: 2300 ⫾ 31 min; study 2: 2341 ⫾ 36 min, P ⫽ 0.05). Consistent with the reproducibility of the amplitude and the existence of a small phase delay between the two studies, the maximum cross correlation between the two profiles was very high (rcross ⫽ 0.95 ⫾ 0.01, P ⬍ 0.001; using Fisher z-transformations: rcross ⫽ 0.96) but was observed for a negative lag of 46 ⫾ 12 min. In Fig. 1 and subsequent analyses, all profiles were therefore referenced to the timing of the melatonin onset. As previously reported (41), despite the fact that glucose was infused at a constant rate, plasma glucose concentrations varied markedly and consistently across the night of sleep deprivation in both studies. Glucose levels increased rapidly in the evening to reach an acrophase around the middle of the usual sleep period (study 1: 0152 ⫾ 27 min; study 2: 0302 ⫾ 31 min). The second half of the night was associated with a steady decrease in glucose concentrations. Subjects who experienced small/large glucose excursions across the night of sleep deprivation in the first study tended to have similarly small/large increases in glucose levels in the repeat study (rP ⫽ 0.77, P ⫽ 0.03; rSp ⫽ 0.64, P ⫽ 0.09). Cross correlation of glucose profiles across the two studies averaged 0.64 ⫾ 0.01 (P ⬍ 0.01) and 0.67 using Fisher z-transformations. In both studies, Global Vigor was relatively stable during the usual daytime period, before the melatonin onset, and then decreased markedly to reach a minimum that occurred, on both studies averaged, at 0752 ⫾ 35 min. Cross-correlation analysis indicated that the decrease in subjective alertness followed the melatonin elevation by an average of 94 ⫾ 26 min (rcross ⫽ ⫺0.88 ⫾ 0.04 for study 1 and rcross ⫽ ⫺0.89 ⫾ 0.03 for study 2; using Fisher z-transformations, rcross ⫽ ⫺0.92 for both studies). Consistent with previous studies (14, 15, 30), subjective alertness showed a relative improvement in the late morning, reflecting the influence of the circadian waking signal. Both the linear (i.e., homeostatic) and quadratic (i.e., circadian) components were highly significant by ANOVA (homeostatic: P ⬍ 0.0001; circadian: P ⬍ 0.0001). As illustrated in Fig. 1, the minimal Global Vigor score reported during nocturnal sleep deprivation ranged widely from one subject to another (from scores under 5 cm reflecting a severe subjective impairment of alertness to scores above 20 cm, i.e., the middle point of the Global Vigor scale) but was highly reproducible for a given individual (rP ⫽ 0.95, P ⫽ 0.0002; rSp ⫽ 0.9, P ⬍ 0.02). The reproducibility of the pattern of change in subjective alertness over the extended period of wakefulness across the two studies was also excellent, with a maximum cross correlation averaging 0.83 ⫾ 0.04 (P ⬍ 0.01) and 0.86 using Fisher z-transformations. AJP-Regul Integr Comp Physiol • VOL
Despite very similar decreases of subjective alertness in both studies, the deterioration of objective alertness, as assessed by the response times and the number of lapses on the two attention tasks, was more severe in study 2 than in study 1 (Fig. 1, bottom). The temporal patterns of changes in response times across the night of sleep deprivation and the following morning were largely similar in both studies [as assessed by a maximum coefficient of cross correlation averaging 0.74 ⫾ 0.03 (0.75 using Fisher z-transformations) for the response times and by a maximum coefficient of cross correlation averaging 0.71 ⫾ 0.06 for the number of lapses (0.75 using Fisher z-transformations)]. Subjects tended to have longer response times on the highly repetitive tasks during study 2 (P ⫽ 0.08) and had more lapses (P ⫽ 0.04). In both studies, the decrease in objective alertness tended to occur later than the decrease in subjective alertness. Indeed, by crosscorrelation analysis, the average lag between the increase in response times and the increase in melatonin levels was 156 ⫾ 30 min (rcross ⫽ 0.78 ⫾ 0.05 for study 1 and 0.77 ⫾ 0.04 for study 2; using Fisher z-transformations, rcross ⫽ 0.81 for study 1 and 0.79 for study 2) compared with 94 ⫾ 26 min for subjective alertness (P ⫽ 0.09). Similar to subjective alertness, objective alertness then partly recovered in the morning hours. Both the homeostatic and circadian components were significant by ANOVA (P ⬍ 0.0001 and P ⬍ 0.0004, respectively). Response times both during normal waking hours and extended nighttime wakefulness appeared to be reproducible individual characteristics, with some subjects performing consistently slower than others (rP ⫽ 0.83, P ⫽ 0.01 and rSp ⫽ 0.74, P ⫽ 0.05 for the minimum response time; rP ⫽ 0.93, P ⫽ 0.0008 and rSp ⫽ 0.88, P ⬍ 0.02 for the maximum response time). The maximum number of lapses was also highly reproducible (rP ⫽ 0.79, P ⫽ 0.02 and rSp ⫽ 0.93, P ⫽ 0.01). The relative increase in response time during sleep deprivation varied from ⬍50% in some subjects to ⬎200% in others. Maximum response times during sleep deprivation were correlated with minimum daytime response times during study 1 (rp ⫽ 0.83, P ⫽ 0.01; rSp ⫽ 0.74, P ⫽ 0.05) but not during study 2 (rp ⫽ 0.36, P ⫽ 0.38; rSp ⫽ 0.64, P ⫽ 0.09). Temporal Variations in EEG Measures For each recording condition (eyes open and eyes closed), we compared the mean power at the frontal and central derivations in each frequency range for each study. The expected decrease in absolute power from low-to-high frequency was observed in both studies and in both recording conditions. However, recordings with eyes closed provided consistently higher spectral power in all the frequency bands (P ⬍ 0.02). Except for the low delta range, spectral power was consistently higher at the central leads than at the frontal derivation. For each study and each recording condition, EEG measures were submitted to a two-way ANOVA with 284 • FEBRUARY 2003 •
www.ajpregu.org
DISSOCIATION OF SUBJECTIVE AND OBJECTIVE ALERTNESS
R285
derivation (frontal vs. central) as factor and time as repeated measure. In both studies, the temporal variations over the study period were similar at both derivations as indicated by a nonsignificant derivation ⫻ time interaction (P ⬎ 0.75 for all frequency ranges and recording conditions). Therefore, the arithmetic mean of the spectral power from the frontal and central derivations was used in further calculations. Figure 2 shows the mean profiles of EEG power for each frequency range with both eyes open and eyes closed. For illustration purposes, the profiles from study 1 and study 2, each referenced to time of the melatonin onset, were averaged across all subjects for each measure. However, subsequent analyses were performed separately for study 1 and study 2. Data shown in Fig. 2 are expressed as percent of the mean level to allow for relative comparisons. This presentation clearly shows that the effects of sleep deprivation on EEG measures were generally more pronounced when the subjects closed their eyes (even though the total duration of recording was only 2 min). The magnitude of the effect (as quantified by the percentage of the variance accounted for by time in an ANOVA for repeated measures) was largest for the high delta band and the two alpha bands and lowest for the high theta band. The profiles obtained with eyes open are largely consistent with those reported in previous studies under similar conditions, particularly in the low- and intermediate-frequency ranges. The analyses below focus on EEG measures obtained with eyes closed, the recording condition that most clearly revealed the impact of prolonged wakefulness. Power in the low-frequency ranges of the EEG (i.e., delta and low theta ranges) increased across the night of sleep deprivation, whereas power in the high-frequency (alpha) ranges decreased. The magnitude of these changes was quite variable and the only reproducible EEG measure between study 1 and study 2 was the relative magnitude of the decrease in high alpha power (rP ⫽ 0.74, P ⬍ 0.06; rSp ⫽ 0.82, P ⬍ 0.05). Correlations Between the Magnitudes of Changes in Melatonin, Glucose, Subjective and Objective Alertness, and EEG Measures Melatonin vs. subjective and objective alertness. We tested the hypothesis that the nocturnal increase in melatonin, a hormone that facilitates sleep when administered during normal waking hours (16), contributes to decrements in alertness. To do so, we compared the relative magnitudes of changes in these variables. The decrease in subjective alertness across the period of sleep deprivation was not correlated with the nocturnal melatonin elevation (study 1: rp ⫽ 0.192, P ⫽ 0.65 and rSp ⫽ 0.43, P ⫽ 0.26; study 2: rp ⫽ ⫺0.41, P ⫽ 0.31 and rSp ⫽ ⫺0.05, P ⫽ 0.90). Similar results were obtained whether absolute or relative changes were considered. The decrease in objective alertness was also not correlated with the melatonin elevation (response times in study 1: rp ⫽ ⫺0.07, P ⫽ 0.89 and rSp ⫽ 0.14, AJP-Regul Integr Comp Physiol • VOL
Fig. 2. Mean (⫾SE) profiles (across 8 subjects, 2 studies, and 2 derivations) of EEG power density in 6 frequency ranges for recordings with eyes open (left) and eyes closed (right). The profiles are referenced to individual circadian phase, as estimated by the timing of the melatonin onset, shown by the vertical line. In each frequency range and for each derivation, EEG power was expressed as a percentage of the mean power across the study period before calculating the mean profiles. Bottom: corresponding clock times. 284 • FEBRUARY 2003 •
www.ajpregu.org
R286
DISSOCIATION OF SUBJECTIVE AND OBJECTIVE ALERTNESS
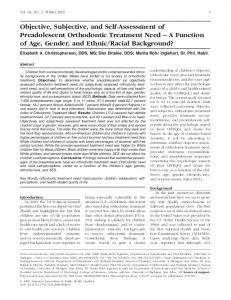
P ⫽ 0.71; response times in study 2: rp ⫽ ⫺0.22, P ⫽ 0.6 and rSp ⫽ ⫺0.14, P ⫽ 0.71). Similar results were obtained when absolute changes were compared, even when the numbers of lapses were used. Thus, the decreases in subjective and objective alertness across the night of sleep deprivation appeared unrelated to the amplitude of the nocturnal melatonin elevation. Glucose vs. subjective and objective alertness. We also tested the hypothesis that the nocturnal increase in plasma glucose [an indirect measure of decreased brain glucose utilization under our experimental conditions (39)] was quantitatively related to the decrease in subjective and/or objective alertness. In both studies, the decrease in Global Vigor was correlated with the nocturnal glucose elevation (Fig. 3, top left; study 1: rp ⫽ 0.79, P ⫽ 0.02 and rSp ⫽ 0.90, P ⫽ 0.02; study 2: rp ⫽ 0.62, P ⫽ 0.10 and rSp ⫽ 0.74, P ⫽ 0.05), suggesting that the subjects who experienced the largest decreases in brain glucose utilization felt the
least alert across the night of sleep deprivation. These correlations were apparent only when relative, rather than absolute, changes in glucose levels and Global Vigor were considered. In contrast, there were no significant correlations between increases in response time and plasma glucose levels (study 1: rp ⫽ 0.34, P ⫽ 0.42 and rSp ⫽ 0.05, P ⫽ 0.90; study 2: rp ⫽ ⫺0.13, P ⫽ 0.76 and rSp ⫽ ⫺0.24, P ⫽ 0.53). Thus, objective alertness did not appear to vary consistently with changes in plasma glucose. Similar results were obtained when absolute changes were analyzed and when the numbers of lapses were used. Subjective vs. objective alertness. Surprisingly, there were no significant correlations between the changes observed in subjective and objective alertness (Fig. 3, top right; study 1: rp ⫽ 0.26, P ⫽ 0.54 and rSp ⫽ 0.10, P ⫽ 0.80; study 2: rp ⫽ 0.29, P ⫽ 0.49 and rSp ⫽ 0.29, P ⫽ 0.45). Similar results were obtained when the absolute, rather than relative, changes were considered and when the number of lapses was used. Thus,
Fig. 3. Data from study 1 are shown as F and data from study 2 are shown as E. For illustration purposes, the regression lines combine the data from both study 1 and study 2 and are only shown when a significant correlation was found in each study. Coefficients of correlation calculated for each study separately are given in the text. Top left: decrease in subjective alertness correlated significantly with the increase in plasma glucose levels, suggesting that individuals who experienced the greatest decrease in subjective alertness had greater decreases in glucose utilization. Top right: no significant correlations between the relative decrease in subjective alertness and the relative decrease in objective alertness (as measured by the increase in response time on the performance tasks). Middle left: relationship between the relative decrease in subjective alertness (Global Vigor scores) and the relative decrease in EEG power in the high alpha range. Bottom left: relationship between the relative amplitude of the nocturnal glucose elevation and the relative decrease in EEG power in the high alpha range. Bottom right: lack of relationship between the relative decrease in EEG power in the high alpha range and the relative increase in EEG power in the high delta range.
AJP-Regul Integr Comp Physiol • VOL
284 • FEBRUARY 2003 •
www.ajpregu.org
DISSOCIATION OF SUBJECTIVE AND OBJECTIVE ALERTNESS
subjects who reported the largest decrease in Global Vigor were not necessarily those who had the slowest response times (or the biggest number of lapses) and vice versa. In view of this unexpected result, we examined the relationship between subjective and objective alertness in a separate group of 13 normal young men (aged 24 ⫾ 1 yr; body mass index: 24.1 ⫾ 0.6 kg/m2) who were studied in our laboratory during 40 h of continuous wakefulness under experimental conditions identical to those in the present study (bed rest, dim light, and constant glucose infusion conditions) and using the same measures of subjective and objective alertness. The temporal profiles of Global Vigor scores and response times were similar to those obtained in the present study, and there were again no significant correlations between decrements of subjective and objective alertness (rp ⫽ 0.28, P ⫽ 0.35; rSp ⫽ 0.43, P ⫽ 0.14). These additional data are combined with the data from the present study in Fig. 4. Examination of the total data set from 29 individual nights of sleep deprivation revealed that the absence of significant correlation between the decrease in subjective alertness and the increase in response times was due primarily to the fact that more than one-third (10 of 29) of the subjects reported a major deterioration of alertness but nevertheless suffered only modest performance decrements. The opposite dissociation, low subjective sleepiness with high cognitive impairment, was far less frequent (3 of 29). Subjective alertness and EEG measures. There was a positive relationship between the decreases in Global Vigor and high alpha EEG power (Fig. 3, middle left; study 1: rP ⫽ 0.62, P ⫽ 0.10 and rSp ⫽ 0.83, P ⫽ 0.03; study 2: rP ⫽ 0.80, P ⫽ 0.03 and rSp ⫽ 0.93, P ⫽ 0.02). Thus, individuals who had the largest decrease in subjective alertness had also the largest decrease in high alpha power. Consistent with the relationship between nocturnal glucose elevation and subjective alertness, the decrease in high alpha power also correlated with the increase in glucose levels (Fig. 3, bottom left; study 1: rP ⫽ 0.78, P ⫽ 0.02 and rSp ⫽ 0.81, P ⫽
Fig. 4. Relationship between decreases in subjective and objective alertness observed in study 1 (F) and study 2 (E) as well as in an additional study (Œ) performed under the same experimental conditions in 13 young men. Mean relative decrease in Global Vigor score for the entire data set of 29 nights of sleep deprivation is indicated by a vertical dashed line. Similarly, the mean relative increase in response time is indicated by a horizontal dashed line. AJP-Regul Integr Comp Physiol • VOL
R287
0.03; study 2: rP ⫽ 0.41, P ⫽ 0.37 and rSp ⫽ 0.68, P ⫽ 0.10). In contrast, there was no consistent relationship between the increase in power in the high delta range and the decrease in subjective alertness (study 1: rP ⫽ ⫺0.76, P ⫽ 0.03 and rSp ⫽ ⫺0.31, P ⫽ 0.41; study 2: rP ⫽ 0.51, P ⫽ 0.25 and rSp ⫽ 0.29, P ⫽ 0.48). Thus, high alpha, rather than high delta, appears to predict shifts in subjective alertness. Objective alertness and EEG measures. In contrast to the findings for subjective alertness, decreases in high alpha power were not significantly correlated with decreases in objective alertness, as estimated by increased response times (study 1: rP ⫽ 0.06, P ⫽ 0.89 and rSp ⫽ 0.21, P ⫽ 0.57; study 2: rP ⫽ 0.49, P ⫽ 0.27 and rSp ⫽ 0.39, P ⫽ 0.34). There was also no consistent relationship between the relative increase in power in the high delta range and the relative decreases in objective alertness (study 1: rP ⫽ 0.11, P ⫽ 0.79 and rSp ⫽ 0.45, P ⫽ 0.23; study 2: rP ⫽ 0.45, P ⫽ 0.31 and rSp ⫽ 0.54, P ⫽ 0.19). Correlations among EEG measures. Finally, we looked for correlations between the changes in EEG power in the high delta frequency range and in the high alpha frequency range (Fig. 3, bottom right). Surprisingly, there was no significant correlation in either study 1 (rp ⫽ ⫺0.21, P ⫽ 0.62 and rSp ⫽ ⫺0.29, P ⫽ 0.45) or study 2 (rp ⫽ 0.37, P ⫽ 0.41 and rSp ⫽ 0.29, P ⫽ 0.48), suggesting that mechanisms generating alpha and delta wave power are differently affected by sleep deprivation. DISCUSSION
In industrialized societies, most adults are familiar with the feeling of sleepiness and suboptimal function that occurs when wakefulness is extended across the night. Yet, the components of “fatigue” during sleep deprivation remain poorly defined and little is known about their variability within and across individuals. Multiple studies have shown that decreases in subjective alertness and in performance on a wide variety of cognitive tasks follow the same time course across a night of sleep deprivation (3, 7, 13, 27), and therefore it is often assumed that sleep loss has a uniform adverse effect on the brain mechanisms controlling subjective and objective alertness. The present study demonstrates that decrements of subjective alertness and deficits of cognitive performance on simple short-attention tasks across a night of sleep deprivation are highly reproducible for a given individual but, in contrast to current assumptions, are not quantitatively correlated. Furthermore, while EEG alterations occur consistently in both the delta and alpha frequency ranges with increased duration of wakefulness, their magnitudes are also unrelated. Although further work is needed to determine whether our findings can be generalized to longer or more complex attention tasks, the present findings, summarized in Fig. 5, suggest that sleep deprivation may have differential impacts on the brain 284 • FEBRUARY 2003 •
www.ajpregu.org
R288
DISSOCIATION OF SUBJECTIVE AND OBJECTIVE ALERTNESS
Fig. 5. Summary of the major findings of the present study. For illustrative purposes, the Pearson coefficients of correlation for the relative magnitude of the changes across the 27-h period of sustained wakefulness are shown for the data from study 1 and study 2 combined. Left: magnitude of the elevation of plasma glucose (an indirect measure of brain glucose utilization under the present experimental conditions; top) was correlated with the decrease in subjective alertness (middle) and with the decrease in EEG activity in the high alpha frequency range (bottom). The initiation of the elevation in plasma glucose, the decrease in subjective alertness, and the decrease in high alpha EEG activity occurred concomitantly. Right: decrease in objective alertness (as assessed by increased response times; top) occurred in parallel with an increase in EEG activity in the high delta range (bottom), but the magnitudes of their respective alterations appeared unrelated. There was no relationship between the magnitude of the decreases in subjective and objective alertness. Similarly, the magnitude of the decrease in alpha activity was not correlated with the magnitude of the increase in delta activity.
mechanisms subserving waking, sleeping, and attention. Our research subjects were studied twice during 27 h of continuous wakefulness under the same laboratory conditions, allowing us to examine the trait dependence of decrements in subjective and objective alertness. Remarkably, the deterioration of subjective alertness was found to be a highly reproducible individual characteristic. The minimum score of alertness on the first night of sleep loss predicted with more than 90% accuracy the subjective level of impairment reported on a second night of sleep deprivation several weeks later. As evident in Fig. 5, the majority of the decrease in subjective alertness occurred during the time interval from 1 h before to 4 h after the onset of nocturnal melatonin secretion, in concomitance with a robust increase in plasma glucose levels. Furthermore, the magnitude of the decrease in subjective alertness was correlated with the magnitude of this glucose elevation. This increase in glucose levels during the early part of the night has been previously reported in sleepdeprived subjects in whom dietary caloric intake was replaced by an intravenous glucose at a constant rate (39). Under such experimental conditions, hepatic glucose production is suppressed (10, 43) and elevations of plasma glucose levels therefore represent decreases in glucose utilization. Because the subjects are at bed rest and fasting throughout the study and have therefore low and relatively constant levels of muscular and AJP-Regul Integr Comp Physiol • VOL
visceral activity, variations in glucose utilization are likely to primarily reflect variations in cerebral glucose utilization, which represents ⬃30% of total glucose uptake under these conditions (18). Positron emission tomography studies of sleep-deprived subjects have indeed demonstrated a decrease in regional glucose utilization in several cortical and subcortical structures (40). The temporal association of decreases in subjective alertness and of increases in plasma glucose levels and the fact that the magnitudes of both effects are quantitatively correlated suggest that subjective fatigue during sleep deprivation is partly related to decreased glucose metabolism in certain brain areas. There was also good within-subject reproducibility in the magnitude of attention deficits on vigilance tasks requiring sustained attention. Again, the deficit observed during the first night of sleep deprivation reliably predicted the amount of impairment in a second study a few weeks later. But we found no relationship between the performance deficit and the increase in glucose levels. Consistent with previous studies, the decreases in subjective and objective alertness followed the onset of the nocturnal elevation of melatonin, a pineal hormone that has both sedative and hypothermic effects (5, 36). Maximum nocturnal levels of melatonin varied more than fourfold across individuals but were highly reproducible for a given subject. However, there were no significant correlations or even trends toward a rela284 • FEBRUARY 2003 •
www.ajpregu.org
DISSOCIATION OF SUBJECTIVE AND OBJECTIVE ALERTNESS
tionship between the maximum melatonin level and the decrements in either subjective or objective alertness. Remarkably, we found no relationship between the magnitudes of the subjective and objective alertness impairments. There was also a temporal dissociation between the profiles of subjective and objective alertness, with performance deficits lagging subjective reports of fatigue by more than 1 h. Although welldocumented studies have indicated that sleep-deprived individuals tend to underestimate their level of cognitive impairment (15), the finding that subjects can report extreme levels of subjective sleepiness yet be only minimally impaired on attention-demanding tasks through a full night of sleep deprivation was totally unexpected. It is possible that the repetitive and unchallenging nature of the scales and tasks that had to be completed at hourly intervals in a neutral environment minimized factors modulating motivation, thereby facilitating the dissociation between measures of subjective and objective alertness. It is also possible that if the duration of the performance tasks (which totalled ⬃4 min in the present study) had been longer, a correlation between decrements of subjective and objective sleepiness would have emerged. A task involving 4 min of fully focused attention on the center of a computer screen is, however, already quite demanding and not inconsistent with attentional demands of real-life operations. The nature and time course of changes in low- and intermediate-frequency EEG activity across the 27-h study periods were largely consistent with findings from previous studies that recorded the EEG only with eyes open (2, 4, 17). However, we did not observe the increase in alpha activity with eyes open that was reported in a previous study with very dim (⬍15 lx) lighting conditions (4). It is possible that this discrepancy is related to the difference in light intensity (50– 150 lx in the present study) as suggested by a recent study showing a reduction in EEG alpha activity with increased light intensity (6). A comparison of the profiles of EEG activity with eyes open and eyes closed clearly shows that the eyes closed condition is more sensitive to the effects of sleep loss. The largest changes were increases in power in the high delta range and, consistent with earlier findings that were, however, limited to a single time point (24, 38), decreases in both low and high alpha power. The profiles of alpha and delta power were roughly mirror images of each other, with minimal activity in the high-frequency range coinciding with maximal activity in the lowfrequency range toward the end of the usual bedtime period. However, there was no relationship between the magnitudes of these two EEG alterations, with some subjects having large increases in delta activity and only minimal decreases in alpha activity and vice versa. These findings thus indicate that prolonged wakefulness affects the mechanisms generating alpha activity differently from those subserving delta activity. The lack of correlation between decrements in high alpha activity and increments in low delta activity AJP-Regul Integr Comp Physiol • VOL
R289
likely reflects variable contributions of the intermediate-frequency ranges. There was a robust correlation between the decreases in subjective alertness and in EEG power in the high alpha range. Subjective sleepiness therefore appears primarily related to the weakening of wakemaintenance systems, and the concomitant decrease in brain glucose utilization, rather than to an increased activity in sleep-promoting mechanisms. We failed to detect significant correlations between the overall decrease in objective alertness and any of the EEG alterations. However, as shown in Fig. 5, the temporal pattern of decreases in objective alertness was more closely related to that of the increase of delta activity than that of the decrease in alpha activity. In summary, these findings indicate that fatigue during a night of total sleep deprivation is a phenomenon involving multiple components that are regulated differently. One component is a feeling of decreased alertness or increased sleepiness, related to decreased brain glucose utilization and decreased EEG activity in the high alpha range (Fig. 5, left). A second and apparently independent component of fatigue is the deterioration of objective alertness or vigilance, as measured by response times on simple attention-demanding tasks (Fig. 5, top right). This decrease in objective alertness is temporally associated with an increase in EEG delta activity, although the magnitudes of these two effects were not significantly related (Fig. 5, bottom right). These observations reveal the complexity of the mechanisms underlying neurobehavioral deficits caused by sleep loss. Additional studies will be needed to further characterize the neurobiology of fatigue resulting from sleep loss and to exploit individual differences in subjective and objective vulnerability to minimize safety risks and maximize performance in 24-h operations. We thank the volunteers for participation in these demanding studies and the staff of the General Clinical Research Center of the University of Chicago for expert assistance. This study was supported by National Institutes of Health Grant DK-41814, Air Force Office of Scientific Research Grant F4620–94– 1-0203, and funds from the Mind-Body Network of the MacArthur Foundation. The General Clinical Research Center of the University of Chicago is supported by Grant RR-00055. REFERENCES 1. Aeschbach D, Matthews JR, Postolache TT, Jackson MA, Giesen HA, and Wehr TA. Dynamics of the human EEG during prolonged wakefulness: evidence for frequency-specific circadian and homeostatic influences. Neurosci Lett 239: 121–124, 1997. 2. Aeschbach D, Matthews JR, Postolache TT, Jackson MA, Giesen HA, and Wehr TA. Two circadian rhythms in the human electroencephalogram during wakefulness. Am J Physiol Regul Integr Comp Physiol 277: R1771–R1779, 1999. 3. Babkoff H, Caspy T, and Mikulincer M. Subjective sleepiness ratings: the effects of sleep deprivation, circadian rhythmicity and cognitive performance. Sleep 14: 534–539, 1991. 4. Cajochen C, Khalsa SB, Wyatt JK, Czeisler CA, and Dijk DJ. EEG and ocular correlates of circadian melatonin phase and human performance decrements during sleep loss. Am J Physiol Regul Integr Comp Physiol 277: R640–R649, 1999. 5. Cajochen C, Krauchi K, and Wirz-Justice A. The acute soporific action of daytime melatonin administration: effects on 284 • FEBRUARY 2003 •
www.ajpregu.org
R290
6.
7. 8. 9. 10. 11.
12. 13. 14.
15.
16.
17. 18. 19. 20.
21.
22.
23. 24. 25. 26.
DISSOCIATION OF SUBJECTIVE AND OBJECTIVE ALERTNESS
the EEG during wakefulness and subjective alertness. J Biol Rhythms 12: 636–643, 1997. Cajochen C, Zeitzer JM, Czeisler CA, and Dijk DJ. Doseresponse relationship for light intensity and ocular and electroencephalographic correlates of human alertness. Behav Brain Res 115: 75–83, 2000. Carrier J and Monk TH. Circadian rhythms of performance: new trends. Chronobiol Int 17: 719–732, 2000. Cleveland WS. Robust locally weighted regression and smoothing scatterplots. J Am Stat Assoc 74: 829–836, 1979. Corbetta M, Miezin FM, Shulman GL, and Petersen SE. A PET study of visuospatial attention. J Neurosci 13: 1202–1226, 1993. DeFronzo RA and Ferrannini E. Regulation of hepatic glucose metabolism in humans. Diabetes Metab Rev 3: 415–459, 1987. Dijk DJ and Czeisler CA. Contribution of the circadian pacemaker and the sleep homeostat to sleep propensity, sleep structure, electroencephalographic slow waves, and sleep spindle activity in humans. J Neurosci 15: 3526–3538, 1995. Dijk DJ and Czeisler CA. Paradoxical timing of the circadian rhythm of sleep propensity serves to consolidate sleep and wakefulness in humans. Neurosci Lett 166: 63–68, 1994. Dijk DJ, Duffy JF, and Czeisler CA. Circadian and sleep/ wake dependent aspects of subjective alertness and cognitive performance. J Sleep Res 1: 112–117, 1992. Dijk DJ and Edgar DM. Circadian and homeostatic control of wakefulness and sleep. In: Regulation of Sleep and Circadian Rhythms, edited by Turek FW and Zee PC. New York: Dekker, 1999, p. 111–147. Dinges D, Pack F, Williams K, Gillen K, Powell J, Ott G, Aptowicz C, and Pack A. Cumulative sleepiness, mood disturbance, and psychomotor vigilance performance decrements during a week of sleep restricted to 4–5 hours per night. Sleep 20: 267–277, 1997. Dollins AB, Zhdanova IV, Wurtman RJ, Lynch HJ, and Deng MH. Effect of inducing nocturnal serum melatonin concentrations in daytime on sleep, mood, body temperature, and performance. Proc Natl Acad Sci USA 91: 1824–1828, 1994. Dumont M, Macchi MM, Carrier J, Lafrance C, and Hebert M. Time course of narrow frequency bands in the waking EEG during sleep deprivation. Neuroreport 10: 403–407, 1999. Gerich JE. Control of glycaemia. Baillieres Clin Endocrinol Metab 7: 551–586, 1993. Gillberg M, Kecklund G, and Akerstedt T. Relations between performance and subjective ratings of sleepiness during a night awake. Sleep 17: 236–241, 1994. Johnson MP, Duffy JF, Dijk DJ, Ronda JM, Dyal CM, and Czeisler CA. Short-term memory, alertness and performance: a reappraisal of their relationship to body temperature. J Sleep Res 1: 24–29, 1992. Leproult R, Colecchia EF, L’Hermite-Baleriaux M, and Van Cauter E. Transition from dim to bright light in the morning induces an immediate elevation of cortisol levels. J Clin Endocrinol Metab 86: 151–157, 2001. Leproult R, Van Reeth O, Byrne MM, Sturis J, and Van Cauter E. Sleepiness, performance, and neuroendocrine function during sleep deprivation: effects of exposure to bright light or exercise. J Biol Rhythms 12: 245–258, 1997. Lewy AJ. Melatonin as a marker and phase-resetter of circadian rhythms in humans. Adv Exp Med Biol 460: 425–434, 1999. Lorenzo I, Ramos J, Arce C, Guevara MA, and CorsiCabrera M. Effect of total sleep deprivation on reaction time and waking EEG activity in man. Sleep 18: 346–354, 1995. Mitler MM, Carskadon MA, Czeisler CA, Dement WC, Dinges DF, and Graeber RC. Catastrophes, sleep, and public policy: consensus report. Sleep 11: 100–109, 1988. Monk TH. Subjective ratings of sleepiness–the underlying circadian mechanisms. Sleep 10: 343–353, 1987.
AJP-Regul Integr Comp Physiol • VOL
27. Monk TH, Buysse DJ, Reynolds CF III, Berga SL, Jarrett DB, Begley AE, and Kupfer DJ. Circadian rhythms in human performance and mood under constant conditions. J Sleep Res 6: 9–18, 1997. 28. Monk TH, Buysse DJ, Reynolds CF III, Jarrett DB, and Kupfer DJ. Rhythmic vs. homeostatic influences on mood, activation, and performance in young and old men. J Gerontol 47: 221–227, 1992. 29. Monk TH, Moline ML, Fookson JE, and Peetz SM. Circadian determinants of subjective alertness. J Biol Rhythms 4: 393–404, 1989. 30. Pardo JV, Fox PT, and Raichle ME. Localization of a human system for sustained attention by positron emission tomography. Nature 349: 61–64, 1991. 31. Philip P, Vervialle F, Le Breton P, Taillard J, and Horne JA. Fatigue, alcohol, and serious road crashes in France: factorial study of national data. BMJ 322: 829–830, 2001. 32. Posner MI, Inhoff A, Friedrich FJ, and Cohen A. Isolating attentional systems: a cognitive-anatomical analysis. Psychophysiology 15: 107–121, 1987. 33. Posner MI, Snyder CR, and Davidson BJ. Attention and the detection of signals. J Exp Psychol 109: 160–174, 1980. 34. Posner MI, Walker JA, Friedrich FJ, and Rafal RD. Effects of parietal injury on covert orienting of attention. J Neurosci 4: 1863–1874, 1984. 35. Rechtschaffen A and Kales A. A Manual of Standardized Terminology, Techniques and Scoring System for Sleep Stages of Human Subjects. Los Angeles, CA: UCLA Brain Information Service/Brain Research Institute, 1968. 36. Sack RL, Hughes RJ, Edgar DM, and Lewy AJ. Sleeppromoting effects of melatonin: at what dose, in whom, under what conditions, and by what mechanisms? Sleep 20: 908–915, 1997. 37. Samkoff JS and Jacques CH. A review of studies concerning effects of sleep deprivation and fatigue on residents’ performance. Acad Med 66: 687–693, 1991. 38. Santamaria J and Chiappa KH. The EEG of drowsiness in normal adults. J Clin Neurophysiol 4: 327–382, 1987. 39. Scheen AJ, Byrne MM, Plat L, Leproult R, and Van Cauter E. Relationships between sleep quality and glucose regulation in normal humans. Am J Physiol Endocrinol Metab 271: E261– E270, 1996. 40. Thomas M, Sing H, Belenky G, Holcomb H, Mayberg H, Dannals R, Wagner H, Thorne D, Popp K, Rowland L, Welsh A, Balwinski S, and Redmond D. Neural basis of alertness and cognitive performance impairments during sleepiness. I. Effects of 24 h of sleep deprivation on waking human regional brain activity. J Sleep Res 9: 335–352, 2000. 41. Van Cauter E, Polonsky KS, and Scheen AJ. Roles of circadian rhythmicity and sleep in human glucose regulation. Endocr Rev 18: 716–738, 1997. 42. Van Reeth O, Sturis J, Byrne MM, Blackman JD, L’Hermite-Baleriaux M, Leproult R, Oliner C, Refetoff S, Turek FW, and Van Cauter E. Nocturnal exercise phase delays circadian rhythms of melatonin and thyrotropin secretion in normal men. Am J Physiol Endocrinol Metab 266: E964– E974, 1994. 43. Wolfe RR, O’Donnell TF Jr, Stone MD, Richmand DA, and Burke JF. Investigation of factors determining the optimal glucose infusion rate in total parenteral nutrition. Metabolism 29: 892–900, 1980. 44. Wolfson AR and Carskadon MA. Sleep schedules and daytime functioning in adolescents. Child Dev 69: 875–887, 1998. 45. Wright KP Jr, Badia P, Myers BL, and Plenzler SC. Combination of bright light and caffeine as a countermeasure for impaired alertness and performance during extended sleep deprivation. J Sleep Res 6: 26–35, 1997.
284 • FEBRUARY 2003 •
www.ajpregu.org