By Brent Smith, Vikki Bristow, School of Textiles, N.C.S.U. ... research, and to identify technical research ...... Meeting in Denver CO, June 13-18. 1993. 46.
Indoor Air Quality And Textiles: An Emerging Issue By Brent Smith, Vikki Bristow, School of Textiles, N.C.S.U. Raleigh, NC
introduction Press reports recently have highlighted the emerging issue of textile impact on indoor air quality (IAQ).1 In light of this, published statements have ranked air quality, and indoor air quality in particular. among the top four health risks currently facing the general public.’ Consumers and manufacturers alike have become sensitized to the role of textiles in IAQ. CPSC, NIOSH and other agencies have studied IAQ issues and identified indoor air pollutants which pose health risks, notably radon, asbestos, and second hand cigarette smoke. Indoor air has been shown to be more polluted in most cases than outdoor air, especially in “tight’: buildings designed to conserve energy.1,3
January 1994 c American Dyestuff Reporter
To address these concerns, major research funding has been targeted for IAQ studies. Research universities, including N.C.S.U., have initiated investigations in several areas which have been identified as important to IAQ. A two-day workshop held early last year brought together a large group of experts to prioritize potential research opportunities. Several presentations gave the participants some background information on IAQ. This was followed by industry specific group meetings in the following areas: adhesives and sealants; building materials; consumer products; furniture; office equipment; and textiles.30 Workshop attendees comprised ap proximately equal numbers of repre-
sentatives with expertise in IAQ, industrial manufacturing, and pollution prevention. Trade associations were well represented also, including the Upholstered Furniture Action Council; Cosmetic, Toiletry and Fragrance Association; American Furniture Manufacturer’s Association; Kitchen Cabinet Manufacturers Association; and National Particle Board Association. The groups were asked to identify products and materials which were candidates for IAQ/pollution prevention research, and to identify technical research strategies in each area. After deliberations, one presenter for each Workgroup stated the groups conclusions to the combined attendees. The conclusions of the textile Workgroup,
indicating textile research opportunities are indicated in Table 1. Workshop proseedings are available.30 Within this context, Table I summarizes what are considered at this time by the workgroups to be important IAQ/pollution reduction issues for textiles. An equal amount of detail was elucidated for other listed industries (Table II).30 Textile Concerns There are several generally recognized areas of concern with respect to IAQ, materials which emit pollutants ‘primary emitters and secondary source/sink reemitters), indoor combustion, outdoor sources, biological sources and occupant activities. sources are generally grouped into three broad classes: construction materials, interior fixtures and furnishings, and consumer products. Several conclusions, as listed in Table I, were identified as being important to textiles. General assessment of problem emissions, and determination If acute and chronic health risks, were recommended. Simply identifying emission or latent emissions by fabric testing is not enough. Use patterns, maintenence, ageing, consumer exposure and other circumstances are important. because the general and specific issues ‘or textiles are so numerous, priorities must be set based on the health risk involved. Latent air emissions from textiles often result from volatile process residues, but perhaps an even more important factor is what happens to the fabric after it leaves the finisher. The design of a textile containing product (TCP), as well as fabrication, storage, installation, consumer use patterns, ventilation and ambient conditions, aftercare solvents and soaps, uses, and the like are critical factors in the IAQ effect of textiles. In this regard, test methods, working relationships and, especially, good technical communications between manufacturer, fabricator, retailer, installer and consumer are essential to improving IAQ. Primary Emissions One very important priority is to characterize primary emissions from textile materials. Of course, there are standard AATCC test methods for formaldehyde, but textile mills generally do have the ability for on-site testing for other latent volatile process residues, which may ultimately, evolve as primary emissions from TCPs. Some chemical components of topical finishes, shown 30
Table I: Textile IAQ research strategies reviewed by textile Workgroup General Create an Emissions Database Understand. Exposures Health Effects (Chronic and Acute Issues for Sensitive Populations Set Priorities/ldentify Targets Evaluate Process Changes Life Cycle Analysis Use Patterns and Exposures Ageing Maintenance Raw Material Selection Primary Emissions Measure Primary Emissions Related to Pure (Unfinished) Fabrics Chemical Finishes Dyeing Process Residues End Use Factors Assembly, Fabrication Modeling Ageing SorptionlReemission Provide End Use Advice Purchasing Requirements Combination Effects Sorption/Desorption from Textile Surfaces Modeling
Table II: Examples of non-textile IAQ research strategies reviewed by workgroups GeneralAgeing of products Consumer attitudes and information Development of low emitting products Emissions quantification Product design, productton. storage Standard testing methods Adhesives and SealantsAlternatives to adhesives, designs that eliminate need Chemistry and physics of adhesives and sealants Peel-and-stick. hot-melt and waterbased alternatives Recommended uses Reducing emissions from waste Solventless adhesives Source modeling (diffusion, vapor pressure. drying process) Targeting “bad actors” User and application methods Building MaterialsBetter informatlon for installers, consumers, retailers Bioclde application. uses Biocontaminants (in HVAC, duct liners) Ceiling tiles Coating effects Electrical wire jacketing HVAC systems Interior panels Oriented strand board Particle or wafer board Source/sink behavior Wall coverings (vinyl)
in Table III, may well survive the finishing process and exist as latent primary emissions. In addition, volatile chemical components of manmade polymers, fiber finishes and residues from dyeing and printing processes may Consumer ProductsCleaning products well exist in latent forms which may be Cosmetics, toiletries, personal care emitted and degrade IAQ. There are products also some potentially significant probDeodorizers. room fresheners lems in dealing with IAQ impact of unEvaluate use patterns Hobby materials disclosed proprietary products, chemiIdentify chemicals of concern cal specialties and finishes (Table IV). Pestictdes In addition to production, installation, Plastic and rubber materials use, and maintenance factors, product Polishes ageing effects and total life cycle considerations were recognized as, at pre- FurnitureAcid catalyzed finishes sent, undetermined contributors to IAQ Fabric finishes, retailer applied problems. In most cases, consumers Institutional furniture (schools) have little or no information or underKitchen and bath cabinetry Performance requirements for standing of IAQ hazards, best installaemission rates tion and use, appropriate care pracPublication of data tices, incompatibilities and the like. Wood furniture, plastic and vinyl Product structure characteristics such Work stations. partitions as fiber cross sectional shape, specific surface area, yarn structure and tight- Office EquipmentBlueprint machines ness of weave for pure textile products Copiers (toner emissions) and TCP assemblies (eg upholstered furOffice machine design niture with fiberfill, foam, and cloth Ozone emissions (copiers, printers) Solvents, correction fluids, glue, pens, cushions) are also presently unknown. markers Sink source behavior and secondary emissions Another research initiative is to identify and characterize secondary source/ sink emission characteristics of textile
materials and TCP’s, such as upholstered furniture. In many cases there are other high level primary emitters American Dyestuft Reporter
Januarv 1994
(e.g.-paints adhesives, sealants, and cleaning solvents) in storage or use areas. If sorbed and reemitted slowly from a TCP, total cumulative exposure may increase many orders of magnitude due to sorption/reemission effects. End uses, aftercare, soiling, cleaning and other consumer practices play an important role also. For example when the textile material sorbs the cleaning agent and releases it slowly over a long time.4 Ageing of products is of partitular concern, because as products become soiled, frayed, abraded, or photodegraded, they may well exhibit altered sorption/reemission characteristics, support for microbial activity, or generation/capture of dust and lint. The manner in which textile components are assembled and fabricated (e.g. joining methods, combination synergism) is also important. It is not yet known how an assembler or fabricator should formulate raw material specifications for the textile components of TCP’s, nor even what synergism should be considered. Cross media contamination during storage or use is important, for example, storage of volatile organic chemicals and textile products in prox-
January 1994
American Dyestuff Reporter
imity in a warehouse can result in sorption and later release of odiferous materials. Another example already known to be significant is the sorption of perchloroethylene dry cleaning solvent by textiles stored near recently cleaned clothing.4 Certain topical finishes, including film formers and repellent finishes which change the surface energy of fibers, may well modify the source/sink behavior of textile materials. These relationships are not known, but need to be determined by developing sorption data as well as appropriate models at the micro and macro level. This will be important to assess both the long and short term sorption/reemission kinetics. There are many unanswered questions, however there has also been some valid work in the IAQ/textiles field, as will be presented in the following. Assessment of IAQ as one of the top four health risks facing the general public today is at least in part driven by poor IAQ at EPA headquarters in Washington DC.2,5 Heating, ventilation and air conditioning (HVAC) problems were noted among employees as they were relocated to areas with insufficient air circulation rate. During initial responses
to complaints, testing showed high levels of indoor VOC’s, including low levels of 4-phenylcyclohexene. Test chamber studies on components of the work place under conditions of one air exchange per hour, 20oC, and 50% relative humidity (RH) showed an outgassing half life of 8 days. Two models were used to show that one month preconditioning (outgassing) of TCPs before installation would reduce emissions to acceptable levels. Moseley determined that many problems which occur during a move to a new or renovated building can be minimized by proper building design.3 He pointed out the importance of proper TCP evaluation as well as ventilation system design (e.g.-air flow patterns, air intake vent locations), and proper cleaning, maintenance and operation of the HVAC system, especially during the first few weeks of occupancy. It has been estimated that $60 billion per year is lost to Sick Building Syndrome (SBS) due to absenteeism, lost productivity and property damage and medical expenses. 6 Information is sketchy, but SBS seems most prevalent in energy efficient buildings constructed since the energy crisis in the 1970s. In
39
the U.S., approximately 30% of large new buildings reportedly have SBS.7 These buildings typically have low ceiligs. sealed windows, thick walls, and poor ventilation. This inhibits proper pollutant removal, resulting in volatile organic chemical (VOC) build up as the air is recirculated. VOC levels in indoor air can be up to 10 to 100 times as great as in outdoor air.1 IAQ issues are very important because many people spend in excess of 90% of their time indoors. Proper maintenance and product use reportedly can control or reduce the pollutants7 Source/sink behavior Brodmann studied chlorinated solvent retention in fabrics by simulating dry cleaning, scouring and finishing treatments using commercial grades of perchloroethylene, trichloroethylene, and trichloroethane in a small dry cleaning machine under standard conditions or synthetics at room temperature.4 When dried at the solvent boiling point here was very little retention, except for acetate fabrics. Further drying at increased temperature released most of the retained solvents from acetate. Higher temperature treatment at the solvent boiling point resulted in Significant retention, and drying well above the boiling point did not remove residues from polyester filament or staple, acetate or triacetate, nylon 66 or 6, wool or polypropylene. But drying at highly elevated temperatures removed the solvents, except from acetate and triacetate. Heat setting before treatment reduced retention. Nonionic fibers were reported to have more affinity for the solvents; amphoteric, less; and hydrophilic, none. The study showed that, for most fabrics, proper conditions of treatment and drying will result in little or no Cleaning solvent retention. Early work by Crawshaw and others used wool to improve IAQ based on its ability to sorb SO, from ambient air.8,9 At that time, SO, from the combustion of fuels,8 the production of sulfuric acid and steel9 was of concern. Studies showed that homes with wool furnishings had lower levels of SO2. It was found that cellulosic wallpapers, cotton furnishings, and especially wool sorbed SO,. A study where nylon, cotton, viscase rayon, and wool were exposed showed that nylon became saturated quickly, rayon within an hour, but cotton and wool continued to sorb for longer times. Tests also showed that wool continues to sorb even after years of exposure, but at reduced rates.
Table III: Hazardous ingredients of topical finishes as listed in MSDS. Hazardous Chemical from MSDS Acetic Acid Acetone Acrylic Copolymer Carbohydrate Citric Acid Cupric Sulfate Dimethylaminopropyl Dodecanamide Oxide Ethyl Acetate Ethylene Glycol Fatty Glyceride Based Softener Ferric Chloride Fluorochemical Polymer (4 reported) Formaldehyde Glyoxal Reactant Hydrocarbon Wax Emulsion (4 reported) Magnesium Chloride Solution Melamine-formaldehyde Resin Metal Salt (unspecified) Methanol Methylhydrogen Polysiloxane Modified Melamine Resin Nonylphenolpolyethylene Glycol Ether 2-Pentanone, 4-methylPolymeric Borated Phosphonate Polyoxyethylated Tridecyl Alcohol Poly(oxy-1,2-Ethanediyl), Alpha-Hydro-omega-OH Proprietary Anionic Surfactant Proprietary Mixture (Cationic Softener) Proprietarv Polymer (Stainblocker)
CAS Number 64-19-7 67-64-1 N/A N/A 77-92-9 7758-99-8 61792-31-2 141-78-6 107-21-1 N/A 10025-77-1 N/A 50-00-0 N/A N/A N/A 068002-20-0 N/A 67-56-1 063148572 N/A 9016-45-9 108-10-1 N/A 024938918 25322-68-3 N/A N/A N/A N/A 7631-86-9 9005-65-6 28724-32-5 000127164 000546689 000108883 000102716 000557346
Table IV: Emissions from draperies From the Drapery Material: Acetone
Decane Toluene Decenal 1,1,1-Tnchloroethane Dichlorobenzene Trimethylbenzenes 1,2-Dichloroethane m-Xylene Chloroform Tetrachloroethene plus 100 more VOC’s From the Drapery Linings: Benzene Decane 1,4-Dioxane Ethyl Acetate Hexanes Methylene Chloride Pyridinone Toluene m-Xylene Plus 80 additional VOC‘s
Crawshaw also reported that SO2 degrades nylon, but not polyester, cotton nor wool.9 In two major tests of the sorption ability of various materials, he found that porous materials such as concrete, brick and wood sorbed well while sealed (painted) wood and brick
surfaces did not. Further work shower that leather, hardwoods and wallpaper sorb while PVC wall coverings do not. In one test, the half life of SO2 was one hour due to rapid sorption by TCP’s. Sorption characteristics of TCP’s were determined by passing contaminated air American Dyestuff Reporter c January 1994
through an object and measuring pollutant concentration depletion. In some of his work, Crawshaw used labelled SO2 and exposed samples at 44% RH, 23°C and two air changes per hour. These conditions were reportedly representative of typical residential conditions. SO, was introduced at levels equivalent to polluted city air, and bubblers were used for sampling. After six hours exposure, no decline in sorption ability of wool was noted. In this study, acidic conditions retarded the sorption, but alkaline conditions do not accelerate it. Wool was found to have irreversible sorption and, when samples were tested for release of the pollutant, less than 1% of the original sorbed amount was released. Accelerated simulated long term exposures (equivalent to 27 years) showed that wool TCP’s continue to sorb SO,, but the rate of sorption is diminished by up to 60%.
Primary emissions: formaldehyde Probably, the best known textile related chemical and certainly the most often reported is formaldehyde, which is an eye, mucous membrane and skin irritant, and has been shown to be carcinogenic. It is also a very widely used industrial reactant, and is found in many products other than textiles. There are many tests for measuring formaldehyde content and release potential. Numerous formaldehyde release studies have been published with emphasis on process evaluation, product (e.g.-resin, catalyst) performance, and test development. Test methods and other literature on this subject are extensive and well known, and will not be reviewed in this article. Formaldehyde emissions from textile resin treated materials reportedly decrease about 50% during the first year of use, and about 90% during years two through five.1 Formaldehyde has been reported as a IAQ concern in mobile homes, houses with particle board subflooring and also in urea formaldehyde (UF) products such as insulating foams and pressed wood products.10 Godish studied formaldehyde in dwellings and resulting health effects among participants who had IAQ complaints.3 Using questionnaires, symptom ratings and air sampling, significant relationships between formaldehyde level and specific symptoms were elucidated. Each tested residence was closed to outside air for 12 hours before and during the test, then sampled using bubble samplers and tested by the January 1994 c American Dyeatuff Reporter
NIOSH chromotropic acid method. Participants also completed surveys rating 22 health symptoms on a scale of 0 to 4: 0, no symptoms; 1, symptoms present but not annoying; 2, annoying symptoms present; 3, symptoms limit activity; and 4, incapacitating and activity curtailment. Demographic effects, season, formaldehyde levels, frequency of the symptom, age of subject and presence of a smoker in the home were taken into account. Symptoms, grouped as lower respiratory, mucous membrane and central nervous system, included eye irritation, dry or sore throat, runny nose, cough, sinus irritation, sinus infection, headaches, fatigue, depression, difficulty sleeping, rashes, bloody nose, nausea, diarrhea, chest pain and abdominal pain. The presence of a smoker increased the symptom severity. The season and age of the participant also showed significant correlations to symptoms. Air sample test data showed that 40% of mobile homes and 67% of houses had formaldehyde levels within accepted IAQ guidelines. Sixteen symptoms showed a significant correlation to measured formaldehyde level, however correlations with the other six symptoms were low.
Schiller’s formaldehyde emissions studies focused on the test methods themselves, e.g.-chamber size, loading, humidity and air exchange rate.11 He concluded that chamber size had no effect if loading was equal, and that humidity strongly affected formaldehyde release. He recommended high humidity levels for accelerated testing, and an air exchange rate of 0.5 to 1.0 per hour for modeling homes. Higher rates result in excessive heat loss and lower rates result in excessive VOC concentrations. Schiller’s test results did not correlate well with standard test methods, due to difficulties in simulating actual end user living area conditions in the standard tests. Because formaldehyde emission varies depending on storage conditions, the entire issue is complicated by storage and handling. A test to determine the point of stability (steady state) for formaldehyde concentration in the home was also proposed.11
Primary emissions: Volatile organic compounds (VOC’s) IAQ issues related to textile VOC emissions are largely unknown, and it is realized that, before any significant waste minimization of VOC emissions from products can be made, a study of
VOC emissions from textile products is needed.12 Studies of the ultimate environmental fate of chlorinated dyeing assistants and other process residues (e.g.-dichlorobenzene,trichlorobenzene, biphenyl and perchloroethylene show that some of these tend to exhaust into synthetic fibers during the dyeing process. These are reemitted either during drying, fabric finishing, subsequent storage or consumer use as volatile organic compounds (VOC’s). A series of dye carriers for polyester were tested, and the sorption of carrier active solvent into fabric during the dyeing process was ascertained.13 Bayer tested emissions using dynamic chambers under conditions 75oF, 0.5 air changes per hour, and 55% RH. Product aging factors were tested. Multisorbant tubes and other sampling methods were used in combination with mass spectrometry, thermal desorption and GC for analysis. TCP’s tested included drapery, drapery lining, and many other products. Typical emissions from draperies and drapery linings are shown in Table IV.2 Bayer showed that emissions over time did not always have simple decay kinetics but, instead, complex irregularities called “breathing modes” were identified and determined to be independent of the chamber used. These effects were amplified for multilayered samples. Breathing modes were correlated to air exchange rate and complex sorption/desorption processes. Rapid release rate is attributed to adsorbed free VOC which is released quickly, whereas bound or internally absorbed VOC’s evolve much more slowly. Three models based on dilution, sink and vapor pressure were used by Bayer. The initial releases fit the dilution model, whereas the vapor pressure model explained low level, long-term emissions. Smith reported that IAQ complaints can be broken down as: 10% due to outside air entering building, 15% to biological contaminants, 15% to VOC emissions from chemical containing products (including TCP’s), and 50% to poor ventilation. Only 10% of the complaints in her study are not associated with a specific direct cause. Various strategies were reported to control indoor air pollution either by removing or modifying the source, or by diluting and ventilating the pollutants. 7 Good housekeeping and cleaning are also reportedly important in improving IAQ, as is proper and timely cleaning of secondary sources and sinks. Tucker used VOC emission data to 42
explain how indoor air pollution can come from the building itself or materials placed in the building.14 He concluded that most indoor air pollution a result of pollutant release from surfaces. Combustion, activity levels, and outside sources also contribute to the total indoor air pollution. The primary pollutant in this study was VOC’s, with levels varying from 10 to 1000’s of µg/m3. Emission rate and outgassing half life were shown to vary greatly. Tucker lists several factors that effect VOC emissions, including total amount of volatile source, surface vs interior distribution, sample age, loading or surface area/volume of source, temperature, air flow rate and humidity. The surface of the material and the air velocity affected the emission.
Biological factors Biological contaminants (e.g.-molds and dust mites) are found in bedrooms
and living rooms where the mites feed off of skin cells.1 Mites may be found in many TCP’s such as mattresses, bed is clothing and upholstery.15 Dust samples collected by vacuum methods usually remove about 10 % of dust mites from TCP’s. Klingenberger assessed the support potential of several TCP’s with respect to dust mites, using microscopy to determine numbers of living mites per gram of dust, or per square meter of TCP.15 When mites were found they were located most often in TCP’s, primarily bedding due to the presence of high levels skin cells there. Humidity is also a very important factor in biological growth. Typically there are thousands of mites per square meter, the level correlating strongly with climate, housekeeping and personal habits of the occupants. No correlation between mites and fabric fiber content was noted, but tightly woven material correlated with low-dust mite content. American Dyestuff Reporter c January 1994
Testing: formaldehyde There are many commercial tests for free- and bound-formaldehyde, latent formaldehyde release and airborne formaldehyde vapors. In some tests, not only formaldehyde but also other moieties (e.g.- other aldehydes, ketones, Nmethylol compounds) are detected. Formaldehyde testing methods will not be reviewed, but are well documented in the literature.l6,23 For accuracy, good sampling strategies are crucial, the two most common being bubble samplers and sorption tubes. There are also direct reading tubes for formaldehyde. There have been many reported assessments of formaldehyde emissions from textile materials.24 In addition to commercial testing, there are calorimetric and mass spectrometric methods for formaldehyde testing, sampling and detection. Individual references will not be cited because they are too numerous.24 The most commonly used forrnaldehyde test in textile commerce is the American Association of Textile Chemists and Colorists Standard Test Method 112 for Formaldehyde Release (Method 112).22 The relationship of this to chamber testing has been studied including assessment of factors which influence formaldehyde release from TCP’s. This topic has also been studied in detail, including not only processing but also use factors.28 In one study, the retesting of samples after one month of gassing resulted in a 50% decrease in emission, and this correlated with previous studies using Method 112.25 Further study on the effects of storage time is still needed. Static and dynamic chamber methods have been developed using gas flow systems and independently variable temperature and humidity control.25,26 These results were compared with Method 112 and other commercial tests in which both temperature and humidity are set. Testing of bleached cotton samples, treated with DMDHEU and with UF, indicated that adsorbed free formaldehyde is released in the first 30 minutes, after which hydrolysis becomes the main source. Results indicated that more formaldehyde was released at the lower temperatures, possibly due to temperature dependance of humidity and moisture sorption/partition between vapor and sorption. Method 112 indicated 50% higher releases for UF and for 120% higher for DMDHEU than the chamber tests, due to the higher (essentially 100%) RH and longer exposure time. A complex relationship exists between moisture sorpJanuary 1994 c
American Dyestuff Reporter
Table VI: Occupant exposure (µg/m3) Time Weighted Average for 400 Minutes -----Type of Chamber Model----Vented Sealed w/Secondary Source
Occupancy continuous 1 min per 10 inter after 115 min
88 9 71
5.0 0.5 0.5
4.0 0.4 2.0
Table VII: Predicted vs. observed IAQ in test house. indoor Air Pollutant Levels (µg/m3) Room Closet Corner bedroom Master bedroom Den
p-Dichiorobenzene Measured Predicted 74 5.1 3.9 3.7
tion, relative and absolute humidity, dew point and saturation at a given temperature.
Testing: VOC’s Subcommittee D22.05 on Indoor Air, part of D22 on Sampling and Analysis of Atmospheres, has developed ASTM standard D5116: Guide for Small-Scale Environmental Chamber Determination of Organic Emissions from Indoor Materials.27 Tichenor et al developed a small chamber test for source characterization.28 Testing objectives set forth by ASTM include test development; study of environmental variable effects; product ranking using emission data; IAQ field test development; IAQ prediction model development; and commercial product or process development. Chamber testing, where clean air is passed through and then measured for pollutants, is the most common method for VOC testing. Bayer used dynamic chambers to test indoor sources and to gain understanding of exposures to airborne contaminates, including VOC’s, particulates, vapors, polar compounds and fibers.2 Testing needs have been identified to analyze all types of contaminants both for product emissions testing and field testing. Temperature, air flow and humidity are controlled to give conditions as close to the actual environment as possible. Highly polished stainless steel is used to make the chambers. Often, field test results and product emission tests are combined to assess sources in homes. Bayer describes one case where a source was discovered by comparing the chamber results to air samples taken from a building.
74 5.7 4.0 4.0
-- Partlcuiates-Measured Predicted
252 288
235 285
Emission rates, determined in chamber tests, are important in assessing exposure and human response. Kinetic emissions data can indicate appropriate conditioning times prior to installation. For example, certain office partitions have been shown to require four months of open air outgassing prior to installation in order to achieve acceptable IAQ in their intended use. Another example of emission data usage was in recently washed sheeting, in which case the detergent, not the sheets, was the cause of complaints. This type of information is also useful for developing care and usage instructions for consumers.
Models studied IAQ modes can be very useful for design stage prediction of emissions, selection of materials for a TCP, setting research priorities, health risk assessment and the like. Models relating various factors to VOC emissions vary from extremely complex to very simple. Different types of models seem to account for slow decay rates (materials that emit for weeks or even months such as furniture) vs rapid decay materials (e.g.-wet paints with half life of days or less).14 More comprehensive models that take sink factors, humidity and temperature into account are being developed and scaled to laboratory use, resulting in useful predictions.14 There are at least four types of models which are now being used or developed for IAQ assessment. Ventilation models, adapted for IAQ use, are useful for modeling the air quality in buildings and groups of rooms. These models require room by room source input data as well as ventilation characteristics. Fairly sophisticated models of 43
this type have already been developed, validated and reported in the literature.28 These models use kinetic emission data from chamber tests as inputs, is well as other information including indoor/outdoor air exchange and sorpion/reemission effects to predict IAQ or large buildings. In the model, a set of coupled linear difference equations based on mass balance principles is written, one for each room in the building. The set is then solved by Euler’s method and the resulting pollutant concentrations are estimated by the model. these have been used successfully to predict levels of chemical pollutants and particulates in actual buildings. Results will be noted in the experimental section of this paper. In these models, secondary sink/source emitters are very significant, sometimes accounting for almost half of the total pollutant. As an example of the modeling techniques, predictions and the effects of sources and sinks, a simple model will be presented which typifies the approach used in this modeling and which demonstrates IAQ modeling principles by using empirical kinetics. Primary sources, secondary sink/sources, ventilation and other such information, are input data for this model. Both of the preceding types of models are already being used to assess IAQ impact of specific products and practices, and to suggest specific conditions for experimental work. Two other types of models are under development. One shows what happens at the fiber, yarn and fabric (fiber assembly) level, taking into account surface sorption, multi layer TCP structures, porosity, air permeability, specific surface area, sorption isotherms, and the like. The final models are behavioral, which include specific assumptions about many types of occupant activities, exposure times and use habits. Of course, these four different types of models are not independent, and output from each one is valuable as input for others. Perhaps, after adequate experimental verification, an overall unified global model will emerge.
Modeling This example, although it resembles other models, is not a presentation of any previously published model, but simply an example of how such models are developed and used, and what their inputs and output capabilities are. This type of IAQ modeling requires source characterization input data, including the emission types and rates associated
44
with specific materials. A kinetic emissions model for a particular primary emissions source would include a rate constant and kinetic order. As shown in the equation below, the primary emitter kinetics are zero order, k emission is the zero order rate constant and dmp/dt is the mass rate of pollutant emission.
To determine the concentration (c, in mass per volume dimensions) of pollutant produced in an indoor area requires knowledge of other factors such as volume of the room or chamber (V), ventilation factor (F), and sorption and desorption rate constants. These empirical values, obtained either from fiber assembly level models Or from experimental source characterization, are introduced into the model, as indicated by the following three equations, where F is the ventilation factor (chamber air turnovers per unit time), c is the airborne pollutant concentration, ksorb is the first order sorption rate constant, kdesorb is the first order desorption rate constant, csorb is the sorbed concentration in the source/sink material and mR2sorb is the effective mass of sorbent material in the chamber.
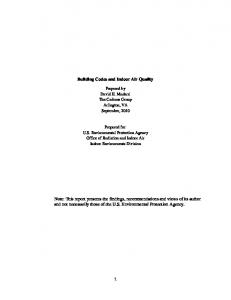
In addition to the foregoing parameters, the model includes factors such as total mass of the primary source and time increment for the computation. The specific inputs and outputs are shown in Table V and Figures 1 and 2. Complete mixing within the chamber is assumed, due to the low viscosity and density of air. There is an overall differential equation for the change in air concentration. A coupled differential equation must also be solved simultaneously for the sorbed concentration (C s o r b , the amount of pollutant sorbed per mass of
sorbent present).
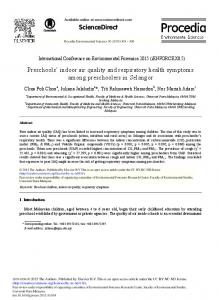
This might, for example, roughly represent the painting of a piece of furniture with a solvent based (10 grams of volatile solvent) paint in a room of dimensions 20 feet square with a curtain (800 grams of cloth) over a window. Figure 1 shows, for a sealed chamber and a vented chamber, the amount of pollutant. In the case of the sealed chamber, the pollutant increases linearly with time and then levels off at 100 µg/m3 when the primary source is expended. The concentration levels and remains at 100 µg/m3 since there is no ventilation nor sink to sorb pollutant. With ventilation, on the other hand, the primary source emits for the first 100 minutes until it is expended, during which time the concentration in the chamber increases but reaches only 20 µg/m3 due to dilution with fresh outside air. Ventilation causes the concentration to increase at a slower rate than in the sealed chamber. When the source is expended, ventilation removes the pollutant, resulting in an exponential decay of concentration with time until there is essentially no pollutant left. Figure 2 shows the effect of an added source/sink sorbant material in the vented chamber. When 800 grams of the sorbant material is added, the concentration level rises even more slowly than with ventitation alone because, as the primary source emits, some of the pollutant is sorbed by the source/sink and some is removed by ventilation resulting in a maximum concentration of only 12 µg/m3. When the primary source is expended, the concentration drops as described above (for vented chamber), however, the source/sink as a secondary source also reemits the pollutant resulting in a decrease in removal rate and therefore higher concentration in the chamber. The mass (in grams) of the pollutant sorbed by the source/sink is shown also in Figure 2, showing that the sorbed pollutant reaches a maximum when the primary source is expended. The reemission process then commences slowly over time. Initially, the source/
American Dyestuff Reporter c January 1994
Figure 1-Indoor air quality model with sealed and vented parameter readings.
Indoor Air Quality Model
sink helps reduce the amount of pollutant in the air by sorbing it as a sink, however, it later becomes a secondary source releasing the pollutant at a slow rate for an extended period of time. The amount of effect depends strongly on the input data (e.g.-rate constants for sorption, desorption, emission and ventilation). Both figures help show how indoor air quality can be affected by primary and secondary sources. It is obvious that primary sources, ventilation, and the presence of sorbant materials affect IAQ significantly and the timing of human exposure (e.g.-long vs. short, continuous vs. intermittent) affects potential health risk.
Human exposure assessed
Time (minutes)
Figure 2-Indoor air quality model with vented, vented plus source/sink, and grams of pollutant sorbed readings.
The information from this model can be used to assess human exposure in several cases as shown in Table VI. Such information is important in health, occupant exposure, comfort factor and personal risk assessment. The exposures are time weighted averages for the entire 400 minute period starting when the source begins emitting, for three different occupants: (1) A person who remains in the room for the entire 400 minute period. (2) A person who spends one minute in the room for each 10 minute period, and is in unpolluted air the other 9 minutes of each 10 minute period. (3) A person who is in unpolluted air for the first 115 minutes then enters the room, 15 minutes after the primary source ceases to emit. As is evident from the Table, effects vary, depending on the user’s actions.
Experimental
Time (minutes)
January 1994 c
American Dyestuff Reporter
Small environmental chambers provide a controlled experiment with variable parameters for testing source emissions of specific pollutants. A test facility which is capable of maintaining specific conditions by use of an air cleaning, conditioning and delivery system, small electropolished stainless steel chambers of 50 to 160 liters volume, and on-line gas chromatographic (GC) and other analytical equipment has been described.28 The environmental conditions in the chambers 45
are monitored and controlled with respect to humidity, air exchange rate, and temperature by use of a microprocessor. A permeation system and use of internal standards provide quality control. Sampling of the air stream is taken from a glass manifold connected to a mixing flask. Samples are drawn from the manifold by syringe or dual calibrated sampling loops. After a sample has been taken, it is injected into a GC where analysis is made by flame ionization detectors. Primary and secondary sources are placed in the chambers, and the data from these experiments characterize sources and sinks empirically. A house in Cary, N.C., is used by EPA to evaluate IAQ models by full scale testing.28 The basic one-story house is heated by natural gas forced air and cooled by electric air conditioning. A sufficient number of rooms, three bedrooms and two baths at one end and the kitchen and combination living/dining room at the other, provides the testing of room to room transport of emissions. The garage at the end of the house is used to house instruments. Temperature and humidity are controlled and can be varied. By operating an attic fan and opening or closing doors, the air exchange rate is controlled and a wide range of conditions can be tested. Air samples are taken by airtight syringes and analyzed by a GC with electron capture detectors. By taking samples after a source has been removed, source/ sink effects can be observed. In experiments to date, source characterization data have been put into models, and predicted pollutant levels have agreed well with observations, as shown in Table VII.28 Two situations were modelled in these studies, i.e.-placement of pdichlorobenzene moth cakes in a closet; and indoor operation of a kerosene heater, producing particulate% To characterize primary emissions from textile sources, new experimental work is now underway to use direct reading sample tubes as well as GC. A modified version of Method #112 is being used by incubating samples in two containers, with and without water, to determine the effect of humidity. A list of chemicals which possibly could be emitted has been prepared from various sources, such as the data in Table III. From these prescreening tests, the type and rate of emissions from textiles are being determined. Identified emissions which occur at rates of concern will then be characterized in more sophisticated strategies (e.g.-small chamber 46
tests as described above). Time and temperature of incubation will be varied to determine kinetic parameters. Sorption and reemission testing is being done by replacing the water in the above tests with a volatile chemical. Textile samples are held at constant temperature in the presence of chemical vapors until an equilibrium sorption state is reached. Then the samples are quickly transported to a clean sampling jar without volatile chemical (except for the amount sorbed) where it is incubated at constant temperature until vapor equilibrium is again reached. The air is sampled, as described. Another experiment uses gravimetric methods to characterize sorption and desorption. Pure fabrics as well as finished fabrics of a variety of fibers, structures and blend levels will be tested for primary emissions as well as sorption and reemission characteristics.
Summary TCP effects of IAQ has been identified as an emerging issue for the textile industry. Considerable work is being done to determine the type and severity of problems (if any) and to find alternatives. Development of information, specifications, test methods, low emitting materials and even “infinite sinks” from textile materials potentially can improve IAQ. c c c
Disclaimer This paper does not represent the views or position of EPA.
References (1) Legwold, G; Home Sick Home: Make Sure Indoor Pollutants Aren’t Making You Sick, Better Homes and Gardens 68,70-71 (1993) (2) Bayer, C; Indoor Environment Testing Using Dynamic Environmental Chambers, ITEA Journal, December 1992 24-26 (1992) (3) Moseley. C; Indoor Air Quality Problems: A Proactive Approach for New or Renovated Buildings, Journal of Environmental Health, 53 19-22 (1990) (4) Brodmann, G; Retention of Chlorinated Solvents in Fabrics Textile Chemist and Colorist 7 20-23 (1975) (5) Weitzman, D, et al; lnddor Air Quality At EPA Headauarters: A Case Studv: The Practitioners Approach to lndoor Air Quality Investigations, Proceedings of the Indoor Air Quality International Symposium 151-162 (1989) (6) Burnett, J; Sick Building Syndrome and Workplace Health in the 1990s, Hosiery News 70 38 (1991) (7) Smith, S; Controlling ‘Sick Building Syndrome’, Journal of Environmental Health 53 22-23 (1990)
(8) Carpet and Furnishings: Wool Helps Fight Indoor Pollution, The Indian Textile Journal 88 95-96 (1978) (9) Crawshaw, G; The Role of Wool Carpets in Controlling Indoor Air Pollution Textile lnst Ind 16 12-15 (1978) (10) Godish. T; Residential Formaldehyde: Increased Exposure Levels Aggravate Adverse Health Effects, Journal of Environmental Health 53 34-37 (1990) (11) Schiller, W; Formaldehyde Emlsslon From Home Textiles, Mellland Textilbenchte/lnternational Textile Reports 71 908-912 (E413-415) (1990) (12) Bayer, C; et al; Exposure Assessments To Volatile Organic Compound Emissions From Textile Products. unpublished manuscript, Georgia Tech Research Institute, Atlanta GA (1993) (13) Smith. B: Identification and Reduction of Toxic.Pollutants in Textile Mill Effluents, NC Division of Environmental Management Monograph, 1992 (14) Tucker, W; Emission of Organic Substances from Indoor Surface Materials Environment International 17 357. 363 (1991) EPA/600/J-91/205 (15) Klingenberger, H, et al; Distribution of Dust Mites in Home Textiles in German Households, unpublished manuscript. TFI German Carpet Research Institute, Germanusstrasse 5,5100 Aachen, Germany (1993) (16) AATCC RA68-Odor Determination AP #107: Total Formaldehyde Emission During Simulation of Latex Curing (17) AATCC RA68-Odor Determination AP #92: Square Wave Voltammetric Determination of Formaldehyde (18) AATCC RA68-Odor Determlnatlon AP #67: HPLC Method of DetermIning Free Formaldehyde Content by Derivatization with Dimedon (19) AATCC RA68-Odor Determination AP #32: Determination of Free Formaldehyde In Low Odor Resins (20) AATCC RA68-Odor Determination AP #63: Determination of Formaldehyde Odor in Fabrics Treated with ‘Low’ or ‘Zero’ Formaldehyde Resins (21) AATCC RA68-Odor Determination AP #3: Free Formaldehyde (22) AATCC Technical Manual; AATCC (1992) (23) Analytical Methods for a TextlIe Laboratory, AATCC (1992) (24) Cumulative Index of Textile Chemist and Colorist, AATCC, (1986) (25) Trask-Morell, B, et al; A Laboratory Scale Dynamic Chamber Test for Formaldehyde in Air From Finished Fabrics, Textile Chemist and Colorist 23 35-39 (1991) (26) Collier, B, et al; A Dynamic Method for Measuring Formaldehyde Release from Durable Press Fabrics, Textile Chemist and Colorist 24 26-29 (1992) (27) Juliani, Carla; Its In The Air, ASTM Standardization News 25 March (1991) (28) Tichenor, B et al; Evaluating Sources of Indoor Air Pollution, J Air Waste Manage Assoc, 40 487-492 (1990) (29) EPA Document 60018-90-074, October 1990 (30) Leovic, K, and White, James, EPA’s Indoor Air/Pollution Prevention Workshop, to be presented at the 86th Annual Air and Waste Management Association Meeting in Denver CO, June 13-18. 1993
American Dyestuff Reporter c
January 1994


![Indoor Air Quality Concerns [PDF]](https://m.moam.info/img/260x300/indoor-air-quality-concerns-pdf_647a01f0098a9eb5108b4579.jpg)