tible host, the guinea pig, where the experimental disease ..... Units/g of liverPer cent of N + Eb No./g of liverc Per cent of ..... Federation of American Societies for.
Vol. 5, No. 4
INFECTION AND IMMUNITY, Apr. 1972, p. 513-523 Copyright ( 1972 American Society for Microbiology
Prinited in U.S.A.
Infection at the Subcellular Level I. Localization of Intravenously Injected Brucellae in the Vacuolar Apparatus of Cells of Guinea Pig Liver HUMBERTO GUERRA,1 RUSSELL L. DETER, AND ROBERT P. WILLIAMS
Departmenzts of Microbiology and Anatomy, Baylor College of Medicine, Houston, Texas 77025 Received for publication 10 January 1972
The distribution ofBrucella melitensis in various tissues and in subcellular fractions obtained from liver was investigated to evaluate the initial phases of brucellosis in the guinea pig. Fifty minutes after intravenous infection, brucellae were found principally in the blood and liver, with a substantial number recovered from spleen. Fractionation of liver established that most bacteria were found in the mitochondrial plus lysosomal (M + L) fraction; a significant number, however, sedimented in the nuclear (N) fraction. With time, there was a progressive shift of bacteria from the M + L to the N fraction, accompanied by a similar shift in acid phosphatase activities. Isopycnic centrifugation of mixtures of M + L fractions and brucellae permitted complete separation of acid phosphatase-bearing particles from bacteria. Similar experiments with fractions from infected animals showed that viable bacteria were found in both the acid phosphatase and free brucellae regions of the gradient. At 10 min postinfection, 52% of the recovered organisms were in the acid phosphatase region; at 30 min, 65%; at 60 min, 85%; and at 315 min, 79%. Detergent plus sonic treatment of an M + L fraction from the liver of an animal killed 50 min after infection caused most of the bacteria in the acid phosphatase region to shift to the region where free bacteria were found. These data suggested that brucellae sequestered in the liver were located primarily in the vacuolar apparatus of the cells which phagocytized them. Removal of infectious bacteria by the reticuloendothelial system is a mechanism of primary importance in host defense (28). Phagocytosis of several species of bacteria has been investigated in vitro by using isolated leukocytes and macrophages (17) and has been illustrated electron micrographically. To our knowledge, however, a quantitative description of the phenomenon during the course of an in vivo infection has not been made; the present investigations are directed to this end. The choice of brucellosis as our experimental model resulted from our interest in intracellular bacterial parasites and the availability of a susceptible host, the guinea pig, where the experimental disease resembles that seen in man (6, 21). In vitro work with polymorphonuclearleukocytes
(27)
and macrophages (24) of animal species showed that these cells are capable of uptake and inactivation of brucellae to a limited extent. These experiments provided no information about the I
Present address: Instituto de Medicina
von Humbolt, Universidad Peruana
Postal 5045, Lima, Peru.
Tropical Alexander
Cayetano Heredia, Apartado
tissue phagocytes, members of the reticuloendothelial system which are not amenable to simple isolation procedures. This study sought to localize intravenously injected brucellae during the early phases of infection, with particular attention being given to the intracellular location of the bacteria in the liver. Quantitative evaluation of the endocytic processes has been possible through the use of the methods of tissue fractionation (3, 12) and density gradient centrifugation (13) in a manner similar to that described by Wattiaux et al. (30) in a study of the uptake of Triton WR-1339 by liver cells and by Silverstein and Dales (26) in a study of reovirus infection of L-strain fibroblasts. Our results demonstrate that the dynamics of infection can be followed in vivo from the distribution within organs of bacteria to their sequestration within the vacuolar apparatus of cells. Application of these techniques under various experimental conditions will allow investigation of host-parasite interactions at the 513
514
GUERRA, DETER, AND WILLIAMS
ultracellular level and will contribute to understanding of infectious diseases.
a
better
MATERIALS AND METHODS Bacteria. World Health Organization reference strain Brucella meliten?sis 16M was generously supplied by Boris Szyfres (Centro Panamericano de Zoonosis, Argentina). It was inoculated into an adult rabbit and recovered from the liver a week later at autopsy. Growth from a single colony then was maintained by monthly passage on Trypticase Soy Agar (BBL) slants. No rough colonies were detected throughout the investigation. Growth media. A chemically defined medium (ROS) described by Rode et al. (25) was selected. The 100 mg of DL-alanine per liter in the original recipe was replaced by 50 mg of L-alanine per liter, since the former could favor the appearance of rough colony variants (7). To facilitate incorporation of 32p in experiments requiring labeled bacteria, the phosphorus content of the medium was reduced to 10 mg/ liter, and 0.05 M tris(hydroxymethyl)aminomethane (Tris) was added as the buffer. This medium was designated ROS-Tris. Similar turbidimetric growth curves and a mean generation time of 190 min were obtained for B. melitensis 16M cultured in ROS, ROS-Tris, or Trypticase Soy Broth (BBL) at 37 C on a rotary incubator-shaker (PsycroTherm, New Brunswick Scientific Co., New Brunswick, N.J.) set at 250 rev/min. Viable counts. Phosphate-buffered saline of pH 7.0 (PBS), as formulated by Alton and Jones (2), and 0.25 M sucrose were chosen as dilution media. In these media, dilute suspensions of brucellae showed no reduction of viability for as long as 18 hr at 22 C and for 48 hr at 2 C. Serial, 10-fold dilutions in PBS of samples were plated in triplicate by spreading 0.1 ml on the surface of Trypticase Soy Agar (BBL). The plates were then incubated for 4 days at 37 C. The number of viable bacteria in the samples was determined by counting those sets of triplicate plates that contained between 30 and 500 colonies per plate and then calculating the mean number of colonies per plate for two of appropriate 10-fold dilutions. Dilution of samples in PBS followed by spreading of samples on agar for viable counts would rupture intracellular vacuoles and would release any sequestered bacteria. Preparation of inocula. All cultures were incubated at 37 C in the rotary incubator-shaker set at 250 rev/min. Brucellae were first grown in ROS medium for 24 hr, and 0.1 to 0.2 ml of this culture then was inoculated into 5 to 10 ml of ROS-Tris medium contained in a 250-ml Erlenmeyer flask with a side arm that could be used for turbidimetric readings in a Klett-Summerson colorimeter (Klett Manufacturing Co., New York, N.Y.). Bacteria were harvested at the late exponential phase of growth, when the Klett reading (with a red filter at about 640 nm) was 100 units, corresponding to about 2.0 X 10⁹ brucellae/ ml. The bacteria were washed with 120 to 240 ml of PBS in a Nalgene Filter Unit (Nalge Co., Rochester, N.Y.), having a filter with a 0.2-,um pore size, and then resuspended in 2 to 4 ml of PBS.
INFECT. IMMUNITY
When labeled bacteria were needed, the ROS-Tris medium contained 1.0 uCi of 32p per ml. This level of radioactivity showed no inhibition of bacterial growth and caused no death of harvested bacteria. As determined by extraction procedures (9), 22%c of the label was soluble in cold trichloroacetic acid, 68%/ was insoluble in cold trichloroacetic acid but soluble in hot acid, and 10' could not be dissolved. These results indicated that 78c/ of the label was in macromolecules; 68',(, in nucleic acids. Controls for loss of viability and label in vitro. Washed, labeled brucellae lost no 32p and were not killed by up to 60 min of incubation at 37 C with fresh guinea pig blood, guinea pig liver homogenate, or fresh ROS-Tris. Procedure for animal experiments. Healthy male albino guinea pigs, 300 to 500 g, were obtained from local sources. Their diet contained no antibiotics. Each experimental animal was fastened to an animal board and injected via the penile vein (18) with I ml of the washed bacteria suspended in PBS. After 10 to 315 min, according to the experiment, a 5-ml sample of blood was collected from the heart in a test tube containing heparin (10 mg), and the animal then was killed with a sharp blow to the head. The internal organs were quickly dissected out and placed in 0.25 M sucrose kept at 2 to 4 C. Liver fractionation. Three grams of liver was weighed, homogenized, and separated into the nuclear (N) fraction and cytoplasmic extract (E), the latter being further subdivided into the mitochondrial plus lysosomal (M + L) and microsomal plus soluble (P + S) fractions. The procedures used to obtain these fractions were those described by de Duve et al. (2), except that washing of the pellets was omitted to minimize damage to fragile cell components. All procedures were carried out at 2 to 4C. Density gradients. Preliminary experiments with discontinuous sucrose density gradients established the densities to which brucellae and cellular components sedimented when centrifuged at 65,000 rev/ min for 60 and 120 min in a Beckman L2-65 ultracentrifuge with a SW65L rotor (Beckman Instruments, Spinco Division, Palo Alto, Calif.). With these data, a linear sucrose density gradient was designed which could separate brucellae from cellular constituents containing acid phosphatase. A Beckman gradient former was used to make the gradients from sterile sucrose solutions. The gradients were checked with an Abbe refractometer (Bausch and Lomb, Rochester, N.Y.) and showed a linear increase in density at 0 C from 1.23 to 1.28, as calculated from data of de Duve et al. (11). A volume of 0.25 ml of a 1:2 M + L fraction (the mitochondrial plus lysosomal fraction from 1 g of liver suspended in 2 ml of 0.25 M sucrose) was layered on 5-ml density gradients in each experiment. Conditions of centrifugation designed to sediment the particles to their equilibrium densities were 65,000 rev/ min for 90 min, providing an integrated force of 2.72 X 10⁷ g-min (11), 1.4 times as great as that needed for rat liver mitochondria to attain their equilibrium density (5).
VOL. 5, 1972
INFECTION AT SUBCELLULAR LEVEL
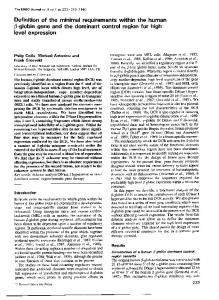
Gradient fractionation was done with a gradient fractionator (Instrumentation Specialties Co., Lincoln, Neb.) which forced a 65%o (w/w) sucrose solution, at the rate of 0.2 ml per min, into the bottom of the centrifuge tube held in a tube piercer (Buchler Instruments Inc., Fort Lee, N.J.). The outflow from the conical cap and delivery tube was collected, without stopping the fractionator, as 0.25-ml fractions in vials kept at 2 to 4 C. The reproducibility of the density gradient technique was checked by determining the density and volume (calculated from the density and the weight of the fraction) of all fractions from seven experimental runs. Figure 1 presents the density distribution, plotted as a function of the gradient volume, from seven experiments. The first fractions are distorted because of the sample in 0.25 M sucrose, whereas the last correspond to the chase solution. Acid phosphatase determinations. Acid phosphatase was used as a marker for lysosomes in liver homogenates and fractions (12). The enzyme was assayed by measuring phosphate liberated at 37 C from glycerophosphate (Sigma Chemical Co., St. Louis, Mo.) in a medium buffered with 0.1 M acetate, pH 5.0 (22). Phosphate was measured by the technique of Chen et al. (8). One unit of enzyme liberated 1.0 ,AM of phosphate per min. The assay was linear for up to 120 min at a saturating substrate concentration of 0.1 M and with as much as 0.5 units of enzyme. Total activities were measured in the presence of 0.l% (v/v) Triton X-100 (Rohm and Haas, Philadelphia, Pa.), according to Wattiaux and de Duve (29), and free activities, in the presence of 0.25 M sucrose (15). Disruption of lysosomes and labeled brucellae. Liver homogenates mixed with 32P-labeled brucellae were disrupted by treatment as long as 10 min with a Biosonic II probe (Bronwill Scientific, Rochester, N.Y.) at a setting of 40. Similar mixtures were disrupted with 0.2%, (v/v) final concentration of Triton X-100. Another sample was subjected to /-
515
sonic treatment for 60 sec and also treated with Triton. After disruption, all preparations were centrifuged for 7.98 X 101 X g per min, and the acid phosphatase activity and radioactive counts in the sediment and in the supernatant fluid were determined. Radioactivity measurements. All samples were reduced to clear solutions in 10 ml of a toluenebased fluor mixture, Fluoralloy TLA Mix (8 g of Butyl-PBD per liter and 0.5 g of PBBO per liter; Beckman Instruments, Inc., Fullerton, Calif.). Aqueous solutions of up to 0.4 ml were dissolved in 10 ml of TLA Mix incorporating 5% (v/v) Beckman Bio-Solv-3 (BBS-3). Tissue homogenates and fractions, in 0.2-ml amounts, were dissolved with 1.0 ml of Soluene-100 (5 N quaternary ammonium base in toluene; Packard Instruments, Inc., Downers Grove, Ill.) in an oven at 60 C for 15 to 60 min. The solutions were neutralized with 0.04 ml of glacial acetic acid, decolorized with 4 to 8 drops of 30% (v/v) H202, and finally dissolved in 10 ml of TLA Mix. The samples were counted in either of two instruments, a Beckman CPM-100 and a Unilux (Nuclear-Chicago Corp., Des Plaines, Ill.), for a total of 60 min per vial. Settings were such that less than 2%c of the counts were lost, as ascertained from the external standard ratio provided by the Beckman instrument. Background counts averaged 20 counts/ min, with a 2 a error of 1.15%. More than 1,200 counts/min above background were obtained in all samples. The number of bacteria per counts per minute was determined from the inoculum suspension for each experiment, and this value was used to estimate the total number of bacteria in the other preparations.
RESULTS Fractionation of normal guinea pig liver. The liver of normal guinea pigs contained a mean (16
TABLE 1. Distribution of acid phosphatase in fractionts of normal guillea pig liver Total acid phosphataseb
Free acid
phosphatasec cent of each(per
Fraction'
Whole liver (N + E) ............................ Fractions N ........... M + L ..... P + S ...............
............................
.............................
Units/g of liver
Per cent of N + Ee
3.41 ±t0.62
100.0
O. 0.4-0.08 2.12 -0.30 0.80 ± 0.19
fraction)"
NAf
12.0 -- 1.4 63.9 4± 5.5 24.1 - 4.4
70.5 4± 16.0 21.3 -! 6.7 67.2 ±t9.7
Recoveries
LN + (M + L) + (P + S)I] ....................
3.32
0.57
97.8
11.4
NA
a N, nuclear fraction; E, cytoplasmic extract; M + L, mitochondrial and lysosomal fraction; P + S, microsomal and soluble fractions. b Mean and standard deviation of five experiments. c Mean and standard deviation of four experiments. d Strong shearing forces were generated during resuspension of the N fraction. e Data corrected for recovery so that N + (M + L) + (P + S) = N + E.
f Not applicable.
I NFECTr. IMMUNrry
GUERRA, DETER, AND WILLIAMS
5 16
TABLE 2. Distributtiont of acid phosplhatase antd viable brucellae it fractions of guinea pig liver after mixing in vitro,, Total acid phosphatase Fraction
_ Per cent of N +Eb
Units/g of liver
Whole liver (N + E). Fraction
2.72 :i
Viable brucellae __ _ Per cent of per of. N +FE liveragO
Free acid
phosphatase
ec(per rcin" Iec cent of
0.144l00.0
NAe
26.4 + 7.9 100.0
.0.43 + 0.021 14.0 i 0.9 61.5 i 7.31 1.55 + 0.2 5.9 + N ..... . 1.92 i 0.23 63.0 4 8.6 18.2 + 6.2 27.8 + 0.1 93.9 + M + L P + S..... .0.70 ± 0.21' 23.0 + 7.5 65.5 ± 7.2 0.06 ± 0.06 0.2 i Recoveries 29.4 +0.8 1112.5 [N + (M + L) + (P + S)] .....3.04 i 0.07112.4 + 8.5, NA
2.3 2.2 0.1 4.9
a Mean and standard deviation of three experiments. For explanation of abbreviations, see Table 1, footnote a. Data corrected for recovery so that N + (M + L) + (P + S) = N + E. Strong shearing forces were generated during resuspension of the N fraction. d Determined by viable counts. Values are expressed X 107. e Not applicable.
TABLE 3. Distribuitioni of acid phosphatase an7d serum-treateda brucellae in fractions ofguintea pig liver after mixin1g in vitro Total brucellae
Total acid phosphatase Fraction
Units/g of liver Per cent of N + Eb
Whole liver (N + E).... Fraction N M + L P+S
. ....
...
.
Recoveries N + (M + L) + (P + S)
No./g of liverc
Per cent of N + Eb
2.86
100.0
16.2
100.0
0.67 1.74 0.72
21.4 55.6 23.0
1.47 11.9
0.58
10.5 85.3 4.2
3.13
109.6
13.8
85.8
Incubated for 30 min at 37 C with 50%0 (v/v) normal guinea pig serum. For explanation of abbreviations used, see Table 1, footnote a. b Data corrected for recovery so that N + (M + L) + (P + S) = N + E. c Determined by radioactive measurements. See text for methods. Values expressed X 107.
experiments) of 3.89 (standard deviation i 0.78) units of acid phosphatase per g. The N fraction contained a mean (eight experiments) of 11.6 =t 1.5S of the sum of the activity in N + E, a higher percentage than reported for rat liver (10, 12). The distribution of total acid phosphatase in fractions N, M + L, and P + S was determined in five experiments, in four of which free activities were also assayed (Table 1). The M + L fraction contained most (64%) of the acid phosphatase, and about 80% of the enzyme in this fraction was latent. These data established that our procedures for fractionation were effective and reproducible and that no extensive disruption of lysosomes occurred.
Fractionation of mixtures of guinea pig liver and brucellae. Bacteria were added to the homogenizer, at the same time as tissue, immediately prior to fractionation. Brucellae were found mainly in the M + L fraction (Table 2). To approximate the in vivo situation in one experiment, labeled brucellae were incubated in 50%° (v/v) normal guinea pig serum before being mixed with the liver tissue (Table 3). The distribution of both the enzyme and the bacteria was similar to those obtained in the previous experiments (Table 2), demonstrating that normal serum did not cause bacteria to aggregate into larger, more readily sedimented particles. Density gradient analyses of brucellae and
VOL. 5, 1972
INFECTION AT SUBCELLULAR LEVEL
517
r 1.32
i
1.30 1.28
L26
PREENT INVETESAI
1.24-
5+
u
49
Iz a
w
~
r
o 1.22-
I.-
- --. s ~~~~~~~~~~~
~
-
Jr-~~~~~~~~~
rr---
1.20-
4
t BEAUfAY et oK~~~~~~~~~~~
+~ ~ ~ ~ ~ ~
1.18a 1.16
REIO
I
REG-IONx
RGO
.. .K~~~~~~~~~~~~~~~~~~~~~~~~~~I
L
1.14
1.12 1.10 tL. I 0
5
20
15 10 FRACTION NUMBER I a 25 50 75 % OF GRADIENT VOLUME
24 100
FIG. 1. Densities of fractions from seveni experimental density gradienits. Vertical linles representt onie stanldard deviation. The distributioni of denisities in the gradienzt used by Beaufay et al. (5) is shownt for comparisont.
M + L fractions of liver and mixtures of liver and brucellae. Free brucellae, an M + L fraction from normal guinea pig liver, and M + L fractions from mixtures of normal guinea pig liver and brucellae were centrifuged to equilibrium in the density gradients described in Fig. 1. Fractions from these gradients were collected, and the acid phosphatase activity and viable bacteria in all fractions were determined. The content of acid phosphatase or of viable bacteria in each fraction was expressed as a percentage of the total recovered enzyme or bacteria. Data from these experiments were used to construct the distribution diagrams for
acid phosphatase and brucellae given in Fig. 2. These results demonstrated that the gradients used were able to separate acid phosphatasebearing particles from bacteria and that the brucellae contained no detectable acid phosphatase. Median equilibrium densities were obtained for particles and for bacteria using the formula: I[(dG + dH)/2] [(dG + dF)/2]}[(50 - J)/PG], where dtm is the median equilibrium density sought; G, the fraction where the accumulated activities exceed 50%; F, the fraction preceding dm = (dG + dF) /2 + -
INFECT. IMMUNITY
GUERRA, DETER, AND WILLIAMS
518
TABLE 4. Distributioni of 32P-labeled brutcellae in organls of a guiniea pig sacrificed 50 miii alfter inijectioni of'bacteria
J
Contri-
Contribution to
bd bution weight to body wegt minus content of
-i
>
Organ 0~
blood'
°
Distribution of brucellae
in
organsb
Blood Fraction contriof ttal butionc
Tissue contri-
bution'
2c
-
7.91e 3.91 0.18 0.99 0.84 0.27
Blood. Liver Spleen. Lungs. Kidneys.. Heart.
ACID PHOSPHATASE VIABLE BRUCELLAE
- ---
0cr CD w
Ilr
0.95 0.80
39.40 36.30 18.80 4.86 0.62
0.25
0.11
0-0 3.73 0.16
39.40 0.89 0.12 0.22 0. 19 0.12
0-0 35.41 18.68 4.64 0.43
Hi In
°
't Blood content per organ calculated from data of Mancry and Hastings (20). hb Determined from radioactive counts of the organs. Values L


![[ 359 ] studies on respiratory infection - Europe PMC](https://m.moam.info/img/260x300/-359-studies-on-respiratory-infection-europe-pmc_5bb9e1ea097c47af488b4678.jpg)
