Ruhuna Journal of Management and Finance Volume 1 Number 2 - July 2014 ISSN 2235-9222
RJMF
Inflation Dynamics in Sri Lanka: An Application of VECM Approach N.P. Ravindra Deyshappriya
N.P. Ravindra Deyshappriya
Graduate School of International Development, Nagoya University, Japan.
[email protected]
Abstract Inflation has been highly discussed in the economic literature. Recently, the importance of discussing inflation has become crucial since it creates various adverse consequences to most of the economies around the world. Sri Lanka has also become more vulnerable during mid 2008 and 2009 as a result of the external shocks and domestic monetary expansion. This study mainly attempts to identify inflation dynamics in Sri Lanka and its determinants over the period of 1983-2010 based on the quarterly data. Both Johansen co-integration test and VECM have been employed to test the existence of log-run equilibrium together with the short run dynamics. Results show that, long term inflation of Sri Lanka is mainly driven by monetary expansion while rice price mainly accounts for the most of short run dynamics in inflation. Other factors such as Gross Domestic Production, unemployment and exchange rate inversely affect the price level of Sri Lanka. Further the results suggest that inflation expectation also plays a crucial role in explaining the domestic inflation. This study reveals that, controlling of unnecessary monetary expansion, supply shocks and the volatility of exchange rate together with expectation can lower inflation enabling the maintenance of price stability in Sri Lanka. Keywords: Colombo consumer price index; co-integration; inflation; monetary expansion; vector error correction model 1. Introduction Maintaining economic stability through the monetary policy mechanism is one of the principle goals of every central bank in the world. However, their way to achieve price stability is crucial since the general price level links with all other economic variables. Economists and the policy makers have already identified that, maintaining the price stability is not an easy task. Especially, inflation has become a dramatic problem in all over the world compared to deflation. Thus, a great deal of empirical studies has investigated the stated issue. However, existing findings are quite mixed. Therefore, this study attempted to identify the determinants and short run dynamics of inflation in Sri Lanka, targeting significant policy implications towards price stability. Basically, Colombo Consumer Price Index (CCPI) is currently being used as the official measurement of inflation in Sri Lanka. In fact, by the 1950s, inflation was limited to single digit and it remained the same during 1960s and 1970s being 5 percent and 5.9 percent respectively. However, after opening up the economy, inflation noticeably increased up to 12.1 percent 17
Ruhuna Journal of Management and Finance, Vol. 1 No. 2 - July 2014
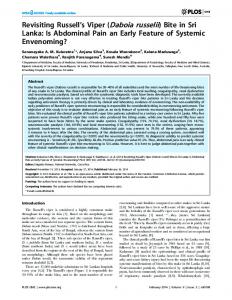
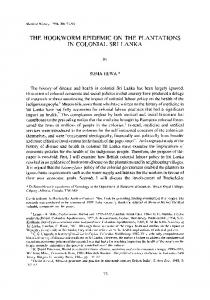
by 1978 from 1.2 percent in 1977. Further, this rapid increment in inflation had continued recording 26.1 percent by 1980. Even though, it showed a gradual decline after 1980, again it jumped up to 21.5 percent in 1990. This type of fluctuation can be seen throughout the history of Sri Lankan economy. Especially, after introducing the floating exchange rate regime in 2001 inflation has dramatically increased from 6.2 to 11.6 percent by 2005. The foodflation occurred in the world economy in 2008 and 2009, showing a rapid hike especially in headline inflation in Sri Lanka. Consequently, the CCPI increased from 183.5 to 203.7 from January to December 2008 reflecting the effect of external shocks such as oil price and food prices on inflation. Probably, the year-on-year change in CCPI has reached all time high by June 2008, i.e. 28.2 percent. Not only headline inflation but core inflation also recorded 17.2 percent in July 2008 indicating the severity of inflation. Further, it showed an increasing pattern even in 2011 as the rate of core inflation has risen up from 3.6 percent in January to 4.8 percent in May 2011. 30%
25%
Inflation
20%
15%
10%
5%
-5%
January March May July September November January March May July September November January March May July September November January March May July September November January March May July September November January March May July September November
0%
2005
2006 Month to Month
2007
2008
Year on Year
2009
2010
Annual Average
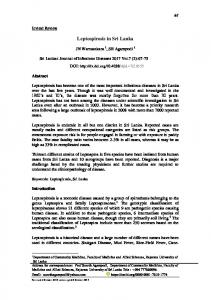
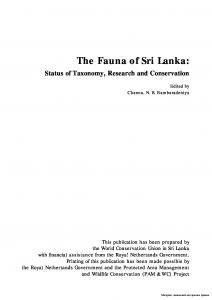
Source: Author based on the Data of Department of Census and Statistics Figure 1: Behavior of Colombo Consumers’ Price Index According to figure 1, after July 2008, again inflation came down and reached the single digit value of 1.1 percent by July 2009 with the wiping out of external shocks. Moreover, it shows a gradual increase again with the global economic crisis. According to figure 2, headline inflation of Sri Lanka is mainly driven by the highly volatile food prices. As a result of food price driven inflation, the living condition of the public is adversely affected because the food prices are directly related with the daily household expenses and most of the low income families spend more than 25 percent of their income just for consumption. Research Problem and Objectives Maintaining the price stability has become a paradox for all economies. According to the global experience, governments such as Zimbabwe has been severely influenced by the public due to 18
N.P. Ravindra Deyshappriya
the unbearable inflation. However, some economies are handling this issue quite well while others are running from bad to worse. Sri Lanka has been experiencing similar problematic situation, due to higher volatility of general price level. Therefore, it has been a very difficult and challenging task to sustain the price stability throughout the history and currently as well. Consequently, identification of the determinants of inflation and its dynamic adjustments is timely to implement the appropriate policies towards the price stability. Therefore, this study attempts to answer what are the key determinants of inflation and how does it move towards the equilibrium? To this end the study has two objectives. 1. Identify the key determinants of inflation in Sri Lanka 2. Analyze the short run adjustment process of price level in Sri Lanka 45 40 35
Percentage
30 25 20 15 10 5
January April July October January April July October January April July October January April July October January April July October January April July October
0 -5
2005
2006
2007
Food Inflation
2008
2009
2010
Non-Food Inflation
Source: Author based on the Data of Department of Census and Statistics Figure 2: Food and Non-Food Inflation of Sri Lanka Inflation 2. Literature Review Inflation is a key macroeconomic variable which drive both monetary and fiscal policy. A number of theories have been introduced to explain the determinants of inflation. Further, a great deal of empirical works has tested the determinant of inflation using different methodologies. Initial theoretical development was started by A.W. Phillips (1958, 1962) introducing the “Phillip’s Curve”. The notion introduced by Phillip was moderated by Lipsey (1960) to explain the wage driven inflation. However, Friedman (1968) and Phelps (1967) formulated the Natural Rate Hypothesis based on the difference of the long-run and short-run notion of Phillip. By the way, Lucas (1973), Sargent and Wallace (1975) argued that the Natural Rate Hypothesis is based on the Hypothesis of Adaptive Expectation. They introduced the Rational Expectation Hypothesis 19
Ruhuna Journal of Management and Finance, Vol. 1 No. 2 - July 2014
and highlighted the weakness attached to natural rate hypothesis. Phillips curve was also extended by including expectation which is known as Expectations-Augmented Phillips Curve. After that, Blanchard and Summers (1988) introduced Hysteresis Hypothesis. According to this hypothesis, Non-Accelerating Inflation Rate of Unemployment (NAIRU) depends on the actual level of employment. Friedman (1970) mentioned “Inflation is a monetary phenomenon always and everywhere”. His argument was confirmed by Laidler and Parkin (1975) indicating that, the inflation may occur due to the expansion of money exceeding the output expansion. Apart from that, Ericsson and Irons (1994) and Hendry (2000a) criticized the methodology adopted by Friedman (1956). They stressed the importance of expanded demand and supply shocks to explain the inflation. In addition, Hendry (2000b) and Dupasquier, Guay, and St-Amant (1999) highlighted the appropriateness of the output gap as a representative explanation variable in inflation models. Several empirical studies have been done in the context of Sri Lanka to investigate the subject matter of this paper. For example, Dheerasinghe (2002) attempted to explain the disparity in regional inflation in Sri Lanka and stated the heterogeneity of household spending in different districts in Sri Lanka. However, Dheerasinghe (2002) failed to find region-wise inflation measures but for the whole country. Unlike Dheerasinghe (2002), Anand, Peiris, and Saxegaard, (2010) applied the Bayesian estimation methods to develop a Forecasting and Policy Analysis System (FPAS) to forecast and target the inflation of Sri Lanka. Their results based on eight macroeconomic quarterly time series data from 1996 to 2010 emphasized the significance of the flexibility of exchange rate and usefulness of the monetary measures in inflation targeting in Sri Lanka. In the context of modelling Sri Lanka inflation, Cooray (2007) has applied Errors Correction Model (ECM) along with the co-integration test on the annual data from 1998 to 2006 and emphasized the significance of supply side factors which eventually account for the general price level of Sri Lanka. Similarly, a long term relationship has been investigated between the price level, real Gross National Product (GNP), the exchange rate and import prices. Moreover, this study expressed that with the opening up of the economy, import prices and exchange rate movements were appeared to have a significant impact on the general level of prices. In fact, this study is in a quite acceptable level and some of the results are consistent with the results of Anand et al, (2010) too. Further Nicholas (1990), Nicholas and Yatawara (1991), Rupananda (1994), Weerasekara (1992) have also analyzed the inflation dynamics in Sri Lanka and they also have raised the importance of supply side factors as determinants of general price level. 3. Methodology Quarterly time series data set on Colombo Consumer Price Index (CCPI), Seasonally Adjusted GDP (GDP_SA), Broad Money Supply (M2 ), Exchange Rate of USD vs RS (USD_RS), Rice Price (RICE_P) and Rate of Unemployment (UNEMP) from 1983 to 2010 was used in this study to identify inflation dynamics in Sri Lanka. The data was collected from the Central Bank annual reports and the reports of the Department of Census and Statistics. Unit Root Test According to the well known fact that non stationary variables lead to the spurious regression in many time series analysis, first, the stationarity of the variables were checked by performing the Augmented Dickey-Fuller (ADF) test (Dickey & Fuller, 1981) using the following models. p
∆Υt = α 0 + θΥt −1 + α 1t + ∑ δ j ∆Υt − j + ε t ........................................................(1) j −1
20
N.P. Ravindra Deyshappriya p
∆Υt = α 0 + θΥt −1 + ∑ δ j ∆Υt −1 + ε t .................................................................(2 ) j −1
Where Yt denotes the Time Series variable in time t, ΔY = Yt -Yt-1, α0 is the constant, α1 and δj are coefficients, and εt is the error term. This study tested the null hypothesis of unit root (H0; θ1=0), against the alternative hypothesis of no unit root (Ha; θ1 < 0). If a series is found to be non-stationary, then the series is differentiated and tested for higher order integration. Co-integration Test and Vector Error Correction Model (VECM) Once the order of intergratedness of time series is examined, generally economists used to check the co-integration among the variables to verify whether there is long run equilibrium. Especially since it is dealing with non stationary data, these macroeconomic non-stationary data are normally known to be co-integrated. Therefore, the intergratedness among the variables can be tested either with Engle–Granger test (1987) or Johansen test (1988). However, the Engle –Granger test limits only to one co-integration vector. Thus, Johansen test was used since it is especially designed to capture the multiple co-integration vectors among non-stationary variables. Assume a Vector Auto Regression (VAR) of order P as follows;
y t = λ1 y t −1 + ......... + λ p y t − p + et ..................................................................(3) Where Yt is a n×1 vector of non stationary I (1) variables and et is a n×1 vector of innovations. VAR can be re-written as, p −1
∆y t = Πy t −1 + ∑ Gi ∆y t −i + et ........................................................................(4 ) i =1
Where, p
p
Π = ∑λi − I i =1
and,
Gi = − ∑ λ j ..................................................................(5) j =i +1
If the coefficient matrix Π has the reduced rank G < n, then there exists n×G matrices α and β each with rank G such that Π=αβ́ and β́yt is stationary. G is the number of co-integration relationships, the elements of α are known as adjustment parameters in the f and each column of β is a co-integrating vector. If Π has full rank, then all the variables are stationary. It can be shown that for given G, the maximum likelihood estimator of β defines combinations of Yt-1 that yields the G largest canonical correlation of ΔYt with Yt-1 after correcting for lagged differences and deterministic variables when present. Further Johansen (1988) introduced the Trace test and the Maximum Eigen value test to measure the co-integration among the variables. Those two tests were used in this study to check the existence of the co-integration. By examining the co-integration, one can identify the long run equilibrium. However, VECM can also be applied to take short run adjustment process into account. In fact, VECM is a restricted VAR that has co-integration restrictions built into the specification. Further, the error correction term indicates the time period that takes to correct the short run dynamics towards the long run equilibrium. 21
Ruhuna Journal of Management and Finance, Vol. 1 No. 2 - July 2014
∆y1t = λ1 ( y 2(t −1) − βy1(t −1) ) + e1t ...................................................................(6 ) ∆y 2t = λ 2 ( y 2(t −1) − βy1(t −1) ) + e2t .................................................................(7 ) According to the above model, the right side terms represent the error correction terms. The error correction terms are equal to zero at the long run equilibrium. Moreover, the estimated coefficients λ1 and λ2 indicate the speed of adjusting toward the long run equilibrium. Impulse Response Function Impulse response function indicates the effect when giving a shock to the values of the endogenous variable. On the one hand this shock can be given to the residual which is equal to the one unit or one standard deviation. On the other hand one can follow the Cholesky or generalized impulse. Here, the generalized impulse was applied to observe the effect of explanatory variables on inflation. 4. Results and Discussion Unit Root Test Results of ADF test are illustrated in table 1. The second column of the table clearly indicates that none of the variable are stationary at their log level forms since the probability values are greater than 5 percent significant level. However, all the time series are significant at their first difference and therefore variables can be interpreted as I (1) variables. In fact, these I (1) variables provide the possibility of applying either ECM or VECM. Consistent with the methodology part VECM has been employed since it facilitates to examine the all long run, short run dynamics and speed of adjustment as well. Table 1: Augmented Dickey Fuller Test Results Level Series Prob. LOG(CCPI) 0.4079 LOG(GDP_SA) 0.9776 LOG(M2) 0.7908 LOG(USD_RS) 0.4763 LOG(RICE_P) 0.1162 LOG(UNEMP) 0.8699
st
1 Difference Series D(LOG(CCPI))*** D(LOG(GDP_SA)) *** D(LOG(M2)) ** D(LOG(USD_RS)) *** D(LOG(RICE_P)) *** D(LOG(UNEMP)) ***
Prob. 0.0004 0.0000 0.0238 0.0000 0.0000 0.0000
** Significant at 5% level *** Significant at 1% level Co-integration Test According to Johansen co-integration test based on Trace test and maximum Eigen value test (see table 2 and 3), only one co-integration vector has been identified at 5 percent significance level. Since both trace and max-eigen statistics are higher than that of critical values at one cointegration vector, it can be summarized that there is only one co-integration equation for the considered time series (see table 4). Consequently, long run equilibrium can be identified for inflation in Sri Lanka. And, VECM long run equilibrium can be interpreted as follows. 22
N.P. Ravindra Deyshappriya
Table 2: Unrestricted Co-integration Rank Test (Trace) Hypothesized No. of CE(s) Eigenvalue Trace Statistic 0.05 Critical Value None * 0.7641 137.2959 95.7537 At most 1 0.4445 66.5288 69.8189 At most 2 0.3436 37.7213 47.8561 At most 3 0.2259 17.0923 29.7971 At most 4 0.0829 4.5433 15.4947 At most 5 0.0062 0.3025 3.8415 Trace test indicates 1 co-integrating eqn(s) at the 0.05 level * denotes rejection of the hypothesis at the 0.05 level **MacKinnon-Haug-Michelis (1999) p-values
Prob.** 0.0000 0.0890 0.3143 0.6333 0.8552 0.5823
Table 3: Unrestricted Co-integration Rank Test (Maximum Eigenvalue) Hypothesized No. of CE(s) Eigenvalue Max-Eigen Statistic 0.05 Critical Value None * 0.7641 70.7671 40.0776 At most 1 0.4445 28.8075 33.8769 At most 2 0.3436 20.6290 27.5843 At most 3 0.2259 12.5490 21.1316 At most 4 0.0829 4.2408 14.2646 At most 5 0.0062 0.3025 3.8415 Max-eigenvalue test indicates 1 co-integrating eqn(s) at the 0.05 level * denotes rejection of the hypothesis at the 0.05 level **MacKinnon-Haug-Michelis (1999) p-values
Prob.** 0.0000 0.1787 0.2993 0.4945 0.8331 0.5823
Table 4: Results of Co-integration Equation Variables LOG(CCPI(-1))
Coefficients
Standard Error
t-Statistics
1.0000
-
-
-5.6156
1.7366
3.2336
1.7178
0.4540
3.7840
LOG(USD_RS(-1))
-0.5173
0.3122
1.6572
LOG(RICE_P(-1))
1.7559
0.2767
6.3462
LOG(UNEMP(-1))
-0.8797
0.4204
2.0927
C
52.9498
-
-
LOG(GDP_SA(-1)) LOG(M2(-1))
Log (CCPI ) = 52.949 − 5.615Log (GDP _ SA) + 1.717 Log ( M 2 ) − 0.517 Log (USD _ RS ) + 1.755 Log ( RICE _ P) − 0.879 Log (UNEMP ) According to the results, seasonally adjusted GDP shows a negative and statistically significant effect on Sri Lanka inflation while M2 indicates a significant positive relationship with inflation. In fact, these findings tally with the economic literature like Madhavi and Schimmelpfennig (2005), Laryea and Sumaila (2001), and Cooray (2007). As the theory says, an expansion in monetary policy leads to an increase in the money supply and consequently in the long term inflation. This goes along with Milton Freedman’s statement “Inflation is always and 23
Ruhuna Journal of Management and Finance, Vol. 1 No. 2 - July 2014
every where a monetary phenomena”. When the GDP is increasing, there is a higher possibility of avoiding the demand pull inflation and cost push inflation; hence the booming GDP enhances the aggregate supply of the economy. Consequently, higher GDP accounts for lower level of inflation. Apart from the GDP and M2, unemployment and exchange rate negatively has affected the inflation in Sri Lanka during the sample time period. At the same time rice price significantly tends to increase the general price level. When the dollar price increase, the prices of imported goods increase. Since Sri Lanka depends on relatively more imports, an increase in the domestic prices is inevitable as also found by Coory (2007) and Almounsor (2010). Further, a negative relationship between inflation and unemployment was found in Sri Lanka consistent with Phillips (1958), even though Phillip’s findings were questioned in the history. Moreover, based on the magnitude of the coefficients, both broad money supply and rice price cause inflation in Sri Lanka than all other considered factors. Vector Error Correction Model VECM indicates that changes in inflation expectations of the public may influence inflation in next quarter and the following quarter significantly, but not in the same quarter during which the expectation began (see table 5). In the short run, both GDP and unemployment are weakly exogenous since those are not statistically significant, though in the long run they are significant. In fact, the time lag always associates with effects of the shocks of GDP and unemployment. Table 5: Results of VECM Estimation Error Corrections
Coefficients
t-Statistics
Coint. Equation
-0.0125
-0.3963
D(log(CCPI(-1)))
-0.4121
-2.7711
D(log(CCPI(-2)))
0.3189
2.1529
D(log(GDP_SA(-1)))
-0.3691
-0.7386
D(log(GDP_SA(-2)))
0.1186
0.2340
D(log(M2(-1)))
0.1875
0.9044
D(log(M2(-2)))
0.4301
2.2857
D(log(USD_RS(-1)))
-0.0243
-0.0699
D(log(USD_RS(-2)))
0.4726
1.3310
D(log(RICE_P(-1)))
0.1582
2.1516
D(log(RICE_P(-2)))
-0.6035
-2.0410
D(log(UNEMP(-1)))
0.0030
0.0582
D(log(UNEMP(-2)))
-0.0461
-0.9725
C
-0.0011
-0.0671
The short run dynamics of broad money supply does not have any immediate effect on inflation even though it has caused a rapid increase in CCPI after two time periods significantly exhibiting the effect of monetary expansion towards the long term inflation. Further, an increase in money supply takes time to circulate in the economy and enhance the purchasing power of the public. Therefore, the consequence of monetary expansion cannot be seen as an immediate effect. Unlike the broad money supply, current changes in rice price in the country affect the CCPI in next period and also in the following period. It implies that any supply shock in the current period make an effect on inflation during the next two period’s time. Exchange rate 24
N.P. Ravindra Deyshappriya
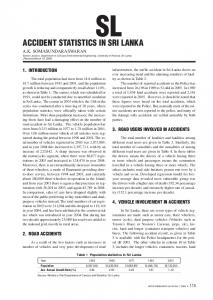
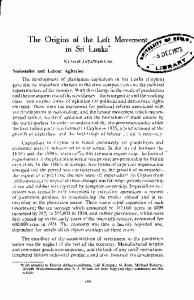
dynamics in the short run are weakly exogenous, however after two period’s time it seems to affect inflation significantly. Impulse Response Functions Figure 3 illustrates the response of CCPI due to a shock of (generalized impulse) each explanatory variable. The first graph, response of log(CCPI) to log(CCPI), implies the significance of inflation expectation on inflation in Sri Lanka. It is apparent that any positive shock in inflation expectation cause an increase in inflation immediately and this effect remains the same in the economy for a long time period and will not die out even in the 10th quarter though it shows a fluctuation. Therefore, inflation expectation of public affect inflation in the economy. Response to Generalized One S.D. Innovations Response of LOG(CCPI) to LOG(CCPI)
Response of LOG(CCPI) to LOG(GDP_SA)
.03
.03
.02
.02
.01
.01
.00
.00
-.01
1
2
3
4
5
6
7
8
9
-.01
10
Response of LOG(CCPI) to LOG(M2) .03
.02
.02
.01
.01
.00
.00
1
2
3
4
5
6
7
8
9
-.01
10
Response of LOG(CCPI) to LOG(RICE_P) .03
.02
.02
.01
.01
.00
.00
1
2
3
4
5
6
7
8
9
3
4
5
6
7
8
9
10
1
2
3
4
5
6
7
8
9
10
Response of LOG(CCPI) to LOG(UNEMP)
.03
-.01
2
Response of LOG(CCPI) to LOG(USD_RS)
.03
-.01
1
-.01
10
1
2
3
4
5
6
7
8
9
10
Figure 3: Impulse Response Function According to the second graph, a positive shock of GDP does not create a considerable impact on CCPI. Further, its effect is dying out quickly despite it fluctuated in the negative region. The third graph illustrates the drastic effect of monetary expansion on inflation. Any positive shock in broad money supply makes an immediate increase in inflation and this effect gradually 25
Ruhuna Journal of Management and Finance, Vol. 1 No. 2 - July 2014
climbs up and does not die out over the time and may reflect a cyclical effect. Immediate effect of a foreign exchange rate shock is quite low and however after second time period it begins to affect inflation heavily without dying out even in the 10th period of time. Apart from that, any shock given to the rice price makes a tremendous and immediate increase in inflation and after second period it is continuously falling down and gradually dying out over the time. In fact, rice price hike can be used as a proxy for supply shock in the economy and the effect of these supply shocks end in a short time period even though the shock of monetary expansion remains in the economy for a very long time period. Therefore, the severity of inflation occurred due to the monetary expansion and supply shocks can be separated by comparing the third and fifth graphs. Finally, a shock of unemployment also influences on inflation and the effect remains in the economy for a long duration without dying out. 5. Conclusions This study makes a number of conclusions regarding the short run inflation dynamics and the long run inflation determinants. Inflation expectations of the public are one of the most important determinants of inflation in Sri Lanka during the short and long terms. Further, factors such as broad money supply, rice price and GDP also account for inflation in Sri Lanka considerably. Even though, rice price plays a major role in short term fluctuations of general price level, long term inflation of the country is mainly driven by the monetary expansions. However, both rice price and broad money supply are positively linked with the general price level. Further, GDP does not make a considerable effect on inflation during the short run, but increasing pattern of GDP gradually reduce the general price level in the economy during the long run. Furthermore, both unemployment and exchange rate do not affect CCPI in short run. These factors are heavily related inversely with the long term inflation. Several policy implications can be drawn from the findings of this study. First, maintaining the anti-inflation expectation of public is important. Second, stabilizing the rice price of the economy is always encouraged to avoid the short run fluctuations of the CCPI which can even spread up to long term inflation. Third, this study emphasizes the importance of controlling unnecessary monetary expansion to get rid of higher long term inflation in the economy. Finally, the appropriate policy implications towards the lower level of unemployment and non-volatile exchange would also facilitate attainment of price stability. References Almounsor, A. (2010). Inflation Dynamics in Yemen: An Empirical Analysis. IMF Working Papers 10/144. International Monetary Fund. Anand, R., S. J. Peiris., and Magnus Saxegaard (2010). An Estimated Model with Macrofinancial Linkages for India, IMF Working Papers 10/21. International Monetary Fund. Blanchard, O. J., and Summers, L. H. (1988). Beyond the natural rate hypothesis. American Economic Review, 78, 182–187. Central Bank of Sri Lanka. (2010). Road Map 2011. Central Bank of Sri Lanka. Cooray, A. (2007). A model of inflation for Sri Lanka. Discussion paper. Faculty of commerce. University of Wollongong. Dheerasinghe, K.G.K. (2002). Disparity in Regional Inflation in Sri Lanka. Staff Studies. 27-28, Central Bank of Sri Lanka. Dickey, D. A., and Fuller, W. A. (1981). Likelihood ratio statistics for autoregressive time series with a unit root. Econometrica. 49, 1057–1072. Dupasquier, C., Guay, A., & St-Amant, P. (1999). A survey of alternative methodologies for 26
N.P. Ravindra Deyshappriya
estimating potential output and the output gap. Journal of Macroeconomics, 21, 577–595. Engle, R. F., and Granger, C. W. J. (1987). Co integration and error correction: Representation, estimation and testing. Econometrica, 55, 251–276. Ericsson, N. R., and Irons, J. S. (eds.) (1994). Testing Exogeneity. Oxford: Oxford University Press. Friedman, M. (1956). Studies in the Quantity Theory of Money. Chicago: University of Chicago Press. Friedman, M. (1968). The role of monetary policy. American Economic Review, 58, 1–17. Friedman, M. (1970). A theoretical framework for monetary analysis. Journal of Political Economy, 78, 193–238. Friedman, M. (1971). A monetary theory of nominal income. Journal of Political Economy, 79,323–337. Hendry, D. F. (2000a). Does money determine UK inflation over the long run?. In Backhouse, R., and Salanti, A. (eds.), Macroeconomics and the Real World, 1, 85–114. Oxford: Oxford University Press. Hendry, D. F. (2000b). Measuring the ‘gap’. Mimeo, Nuffield College, Oxford University. Johansen, S. (1988). Statistical analysis of cointegration vectors. Journal of Economic Dynamics and Control, 12, 231–254. Reprinted in Engle, R. F. and Granger, C. W. J. (eds.) (1991). Long-Run Economic Relationships, Oxford: Oxford University Press. pp.131-152. Laidler, D. E. W., and Parkin, M. J. (1975). Inflation: A survey. Economic Journal, 85, 741–809. Laryea, S.A, and Sumaila, U.R. (2001). Determinants of inflation in Tanzania. CMI working papers. Chr. Michelsen Institute. Lipsey, R. G. (1960). The relationship between unemployment and the rate of change of money wage rates in the UK, 1862–1957: A further analysis. Economica, 27(105), 1–32. Lucas, R. E. (1973). Some international evidence on output-inflation tradeoffs. American EcoEconomic Review, 63, 326–334. Madhavi, B. and Schimmelpfennig, A. (2005). Three Attempts at Inflation Forecasting in Palistan. IMF Working Paper. WP/05/105. Nicholas, H.V.B and Yatawara,R.A.(1991). “Inflation in Sri Lanka in 1990” Institute of Policy Studies Working Paper No.2, Institute of Policy Studies, Colombo. Nicholas, H.V.B. (1990).“Inflation in Sri Lanka 1971–87: A Preliminary Study,” Macroeconomic Series No.3, Institute of Policy Studies, Colombo. Phelps, E. S. (1967). Phillips curves, expectations of inflation and optimal unemployment over time. Economica, 34, 254–281. Phillips, A. W. H. (1958). The relation between unemployment and the rate of change of money wage rates in the United Kingdom, 1861–1957. Economica, 25, 283–299. Phillips, A. W. H. (1962). Employment, inflation and growth. Economica, 29, 1–16. Rupananda, W. (1994). Econometric Model for Inflation in Sri Lanka. Economic Review Sri Lanka, 20(7), 25–28, Colombo, Sri Lanka. Sargent, T. J., and Wallace, N. (1975). Rational expectations, the optimal monetary instrument, and the optimal money supply rule. Journal of Political Economy, 83, 241–254. Weerasekara (1992). Inflation in Sri Lanka: A Causality Analysis. South East Asian Centrel Banks Centre Staff Paper No. 46, South East Asian Central Banks Research and Training Centre, Kuala Lumpur. 27
Ruhuna Journal of Management and Finance, Vol. 1 No. 2 - July 2014
28


![Faculty of Engineering University of Moratuwa Sri Lanka [PDF]](https://m.moam.info/img/260x300/faculty-of-engineering-university-of-moratuwa-sri-_647d1bf5098a9ef7468b45d8.jpg)