INFLUENCE OF PERSONALITY TRAITS, LOCUS OF CAUSALITY, AND MOTIVATION ON EXERCISE ADHERENCE
By
Gregory A. Garrett
A Thesis Submitted in Partial Fulfillment of the Requirements for the Degree of Masters of Arts in Psychology
Middle Tennessee State University 2013
Thesis Committee: Dr. Thomas Brinthaupt Dr. Gloria Hamilton Dr. Minsoo Kang
ACKNOWLEDGMENTS
I would like to thank my wife Kristi for her unwavering love and support throughout this long process. Without Kristi’s great support and feedback, I would not have been able to fulfill this dream of mine. I would also like to thank Dr. Gloria Hamilton and Dr. Thomas Brinthaupt for believing in me at the very beginning. Finally, I would like to thank Dr. Minsoo Kang, Angela Bowman, and Michelle Sterlingshires for their support and education in the area of Multiple Regression Linear Analysis.
ii
ABSTRACT An individual’s health can be improved by addressing negative behaviors, thereby mitigating or reducing risk factors associated with certain disease processes. This study is designed to identify the relationship of personality traits, locus of causality orientations, and motivational attitudes to exercise adherence. Three hundred and seven participants from a national company that promotes healthy living through behavior change responded to an online survey to assess their exercise stage of change, Big 5 personality, locus of causality, and exercise motivation. It was expected and found that the respondent’s personality type, locus of causality orientation, and motivational attitudes would individually predict the respondents’ exercise Stage of Change. In the overall model, personality traits, motivational attitudes, and locus of causality orientations were regressed on an individual’s self-reported Stage of Change for exercise. The constructs of autonomy, LOC for exercise, intrinsic motivation, and introjected motivation significantly predicted an individual’s stage of change. This understanding of an individual’s personality type and how these personality types interact with motivation and locus of causality will assist health care providers in the determination of the best course of action in increasing or maintaining exercise adherence.
iii
TABLE OF CONTENTS Page CHAPTER I: INTRODUCTION & REVIEW OF THE LITERATURE
1
Personality and Health Behaviors
3
Categories of Motivation and Locus of Causality
6
The Transtheoretical Model
9
Statement of the Problem and Hypotheses
12
Hypothesis One
12
Hypothesis Two
13
Hypothesis Three
13
Hypothesis Four
14
CHAPTER II: METHOD
16
Participants
16
Procedure
16
Measures
17
Stage of change
17
Ten item personality inventory
18
Exercise causality orientation scale
18
Locus of causality for exercise scale
19
Behavioral regulation in exercise questionnaire
21
CHAPTER III: RESULTS
22
Descriptives
22
Principal Component Analysis
22
iv
Ten-Item Personality Inventory
22
Exercise Causality Orientations
25
Locus of Causality for Exercise
27
Behavior Regulation in Exercise
28
Regression Analysis
31
Hypothesis One
31
Hypothesis Two
32
Hypothesis Three
33
Hypothesis Four
34
CHAPTER IV: DISCUSSION
37
Conclusion
39
REFERENCES
42
APPENDICES
51
APPENDIX A: Ten-Item Personality Inventory Scree Plot
52
APPENDIX B: Exercise Causality Orientations Scree Plot
53
APPENDIX C: Locus of Causality for Exercise Scree Plot
54
APPENDIX D: Behavioral Regulation in Exercise Scree Plot
55
APPENDIX E: Multiple Regression Histogram
56
APPENDIX F: Multiple Regression P-P Plot
57
APPENDIX G: Multiple Regression Q-Q Plot
58
APPENDIX H: IRB Approval
59
v
LIST OF TABLES Page TABLE 1: PCA Rotated Varimax Structure Matrix of the Ten Item Personality Inventory
24
TABLE 2: PCA Rotated Varimax Structure Matrix of Exercise Causality Orientations
26
TABLE 3: Component Matrix for PCA of the Locus of Causality for Exercise Survey
28
TABLE 4: PCA Rotated Varimax Structure Matrix of Behavioral Regulation in Exercise Questionnaire
30
TABLE 5: PCA Regression Analysis Personality
32
TABLE 6: PCA Regression Analysis Locus of Causality Orientations
33
TABLE 7: PCA Regression Analysis Behavioral Regulation in Exercise
34
TABLE 8: Summary of Full Model Multiple Regression Analysis
36
vi
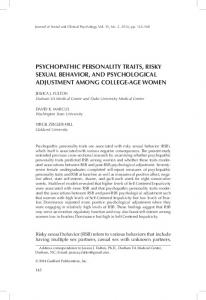
LIST OF FIGURES Page FIGURE 1: A Theoretical Model of the Determinants of Exercise Adherence
vii
15
1
CHAPTER I Introduction & Review of the Literature Obesity has become a worldwide epidemic that is affecting both developed and underdeveloped countries (Kelly, Yang, Chen, Reynolds, & He, 2008). In 2005, a projection of the world population that is overweight or obese was estimated at 33% and is expected to reach 57.8% by 2030 (Kelly et al., 2008). Obesity is linked to serious health risks such as heart disease, diabetes mellitus, cancer, reproductive issues, hypertension, osteoarthritis, and sleep apnea. Obesity levels in the United States have jumped from 19% to 35% through the period of 1988 to 2008; however levels of physical activity during that same period have decreased from 31% to 25% (“1998-2008 No Leisure-Time”, 2010). Diet, inactivity, genetic factors, environment, and health conditions have contributed to this increase in weight and obesity. Physical activity has been shown to have significant positive health effects, including lowering the risks of chronic illness, preventing falls, avoiding weight gain, and reducing depression (CDC, 2009). Yet more than 50% of individuals who begin an exercise program will drop out within 6 months (Rose, Markland, & Parfitt, 2001). In 2008, health-related charges due to obesity and physical inactivity cost the United States approximately 147 billion dollars or 9.1% of U.S. health care expenditures (Hellmich, 2009). The decreases in physical activity levels in adults and children have not kept pace with increases in obesity levels.
2
There is a multitude of reasons why individuals do not take the necessary steps to prevent obesity and therefore positively impact their health. Personality is a relatively stable, broad, and multi-faceted way to address the issues of individuals’ behaviors and reactions to their health. Personality traits can be viewed as the background influence on how individuals perceive their motivation or ability to achieve a particular healthrelated task. Understanding how personality traits negatively impact health behavior motivations can have potentially far-reaching consequences for a variety of negative health outcomes including financial (health related costs associated with higher insurance premiums, lost wages due to illness, and increased medical bills), physical (higher rates of mortality, higher rates of chronic conditions, and increased susceptibility to illness), and emotional (higher rates of depression/anxiety, low self-esteem, and decreased social interactions). A great deal of research and theory has addressed individual personality traits and the concepts of perceived control and motivation in “moving” an individual into a healthier state of well-being (Biddle, 1999; Blissmer, Prochaska, Velicer, Redding et al., 2010; Bogg, 2008; Lippke & Plotnikoff, 2009). My objective is to determine the relationships among personality, individuals’ perceived control/motivation, locus of causality, and their Stage of Change. Stage of Change describes the different phases that an individual passes through in the acquisition and incorporation of health behaviors. The stages are listed as Precontemplation, Contemplation, Preparation, Action, and Maintenance (Ingledew, Markland, & Medley, 2004).
3
The findings of this research will aid in determining strategies to move an individual effectively through the Stage of Change process with the assistance of motivational interviewing and the development of personal environments that facilitate increased compliance with exercise initiation and adherence. In the following review of the literature, I will discuss personality traits and their influence on health behavior, the concepts of motivation and locus of causality, the Transtheoretical Model, and the use of motivational interviewing to facilitate health behavior change. Personality and Health Behavior Personality can be viewed as a sum of individual traits that include genetic, physiological, learning, and social factors (Whitman, Deary, & Matthews, 2003). These characteristics or traits influence an individual’s response to situational experiences; in essence they determine not only our reaction to our experiences but how others view us based on the characteristics and traits we exhibit. There has been significant research on personality traits and their influence on intrinsic and extrinsic motivation, locus of causality, and adherence to exercise behavior. For example, Extraversion has been shown to be positively related and Neuroticism negatively related to exercise behavior. Additionally, Conscientiousness has been shown to be negatively related to exercise barriers while Openness has been positively related to moderate exercise (Courneya, Bobick & Schinke, 1999; Rhodes, Courneya & Hayduk, 2002).
4
Profiles of personality characteristics are important in determining an individual’s dispositional bias on behavior and outcomes in the areas of health (Hagger, 2009). The most obvious causal links between personality traits and health involve risky behaviors such as smoking, drug abuse, and unprotected sex; additionally, personality traits have been linked to protective behaviors such as weight management, exercise, healthy eating, and getting enough sleep (Kern, 2011). Because of these interactions within a social and environmental framework, people’s personality traits will direct them to engage in prescribed medical regimens, increase or decrease the success of medical treatments, affect the quality of life, affect physical health, and increase or decrease their mortality risk (Kern, 2011). There are several ways that an individual’s personality traits can be measured, but it is important to note that identification of single individual traits is not as important as the determination of a profile of personality characteristics when determining the dispositional biases on behavior and outcomes in the domain of stress and health (Hagger, 2009). The Big 5 or 5 Factor Model (FFM) is a personality trait approach that quantifies five different personality domains: Extraversion, Neuroticism, Openness, Agreeableness, and Conscientiousness (McRae & John, 1992). Neuroticism is typically defined as the presence of distress; high scores on neuroticism indicate the negative emotions that are typified by individuals with low self-esteem, poor control of impulses, and irrational thinking. Low scores in neuroticism indicate individuals generally are happier and have a greater satisfaction with their lives. High extraversion personality types are defined as cheerful, talkative, sociable, and warm, whereas low extraversion types are typically shy,
5
retiring, and quiet. Individuals who are high in agreeableness exhibit nurturing, caring, and emotional support with low agreeableness types appearing hostile, spiteful, jealous, and self-centered. Individuals with a high conscientiousness score tend to exhibit behaviors of diligence, achievement orientation, and neatness and individuals with low conscientiousness exhibit the relative absence of these characteristics. Finally individuals who have a high openness value are “open” to new experiences, are creative, enjoy intellectual pursuits, and have a need for variety and unconventional values. Individuals low in openness are typically conventional, prefer routine, and have a narrower range of pursuits (McCrae & John, 1992). The FFM model has been validated and shown to be reliable over time and across instruments as well as through observer reports (McCrae & Costa, 1987). The FFM appears to broadly and conceptually assess information one might expect to gather to describe an individual’s personality (McAdams, 1992). Recent studies that have used the FFM to predict exercise adherence have found some correlation of high Extraversion and high Conscientiousness with increased exercise and exercise engagement, high Neuroticism with decreased exercise adherence, and relatively little association of Agreeableness and Openness to exercise adherence (Raynor & Levine, 2009). Since the correlations between the FFM and exercise adherence seem to vary by trait, it appears that the FFM may not be a strict predictor of exercise adherence. Rather, personality may correlate more strongly with other domains such as motivation and locus of causality, which in turn may be stronger predictors of exercise adherence.
6
In summary, individuals classified as being high in Conscientiousness and Extraversion typically exhibit increased exercise adherence and initiation. Hence, the expression of a dominate personality trait or traits can be used to predict an individual’s bias towards exercise adherence and the FFM model has been shown to be a reliable and valid approach that captures an individual’s personality type. Categories of Motivation and Locus of Causality Motivation is what moves us to do something. Individuals who are energized and activated to achieve a goal are considered motivated, whereas an individual who is characterized as de- or unmotivated has no interest in acting or striving to achieve a goal (Ryan & Deci, 2000). Not only do people have different amounts of motivation, they also have different types of motivation. Ryan and Deci (2000) have developed SelfDetermination Theory (SDT), which states that motivation can be divided into three broad categories: Intrinsic, Extrinsic, and Amotivation. Intrinsic motivation refers to that motivation that is internal and refers to doing something that is enjoyable or inherently interesting. Extrinsic motivation refers to doing something because it leads to a separable outcome, and Amotivation refers to the state of lacking an intention to act. According to SDT (Ryan & Deci, 2000), there are four levels of Extrinsic motivation in which the task in uninteresting: External regulation—rewards or punishments that demand compliance with specific acts or goals; Introjection–a focus on approval/compliance from self or others; Identification—the identification of personal importance of a goal or behavior and acceptance by the individual for the
7
regulation of said goal; and lastly Integrated regulation—in which the task is still considered uninteresting but the individual understands the value of the task and is personally committed to take action for the desired outcome. The levels can be viewed as a continuum where an individual moves from a state of least autonomy to a fully autonomous state, with amotivation on the far left of the continuum and intrinsic motivation to the far right. It is important to note that an individual can enter the continuum at any level as well as move left or right along the continuum until full integration is achieved or the goal is abandoned. Individuals may assume that they are intrinsically or extrinsically motivated by observing their behaviors and in which context it occurs (Calder & Straw, 1975). Deci and Ryan (2000) have developed the General Causality Orientations Scale in which the causality orientation concept is a move towards a dimensional view of personality rather than a categorical characterization of behavior type (Rose et al., 2001). Causality orientations theory identifies three separate events: informational, controlling, and amotivating. Informational events or circumstances result in the promotion of intrinsic motivation by supporting autonomy and buoying competence; controlling events promote extrinsic motivation through the perception that achievement of specific outcomes is controlled by an external source; and amotivating events lead to a feeling of learned helplessness in which individuals believe that they cannot achieve a desired outcome. There are subsets of these causality orientations. For example, power, or illusory control, over outcomes is determined by chronic
8
personality types, cultural differences, and dynamic unbalanced power situations (Fast, Gruenfeld, Sivananthan, & Galinsky, 2009). The perception or belief that one can control or influence outcomes beyond one’s reach can be either realistic or illusory, and this sense of control is a physiological experience of power (Fast et al., 2009). Neuroticism has been associated with more introjected regulation, Extraversion with both more intrinsic and identified regulation, Openness with less external regulation, and Conscientiousness with more intrinsic regulation (Lewis & Sutton, 2011). As an individual moves in the direction of more autonomy, exercise participation and levels of physical activity increase suggesting that autonomous motives are underpinned by the satisfaction of psychological needs (Lewis & Sutton, 2011). Autonomous intentions promote intrinsically motivated activity which has been linked with choice, enjoyment, effort, satisfaction, and motivational persistence over time (Brickell, Chatzisarantis, & Pretty, 2005). The exercise habits of individuals may be influenced by their causality orientations. In assessing the exercise-specific causality orientations to promote the psychological benefits and enjoyment of exercise, the creation of an atmosphere and environment to facilitate exercise adherence must include the interaction of personality characteristics, environmental conditions, and individual preferences (Rose et al., 2001). One example of individual preferences is commitment. Commitment in competitive sports consists of four components: involvement opportunities, personal involvement, enjoyment, and social constraints. These four components have been
9
found to be predictors of exercise commitment in health club participants, and in a recent study, increased commitment within an exercise program was in fact associated with improved exercise performance (Brinthaupt, Kang, & Anshel, 2013). In sum, the perception of events as externally or internally controlled can motivate or de-motivate an individual in regards to the achievement of goals. Personality types such as Neuroticism and Extraversion have been correlated with less motivation and control and increased autonomy and achievement of goals respectively. In addition, environments that buoy illusory control or power increase autonomy thereby promoting intrinsic motivation enhancing an individual’s perception of enjoyment and satisfaction. The Transtheoretical Model The Transtheoretical Model (TTM) is a stage-based process that is used to illustrate the behavioral and cognitive processes that an individual uses while changing health behaviors (Kim, 2007; Spencer, Adams, Malone, Roy, & Yost, 2006). As mentioned earlier, the stages that are identified by TTM are Pre-Contemplation, Contemplation, Preparation, Action, and Maintenance. Individuals do not always progress linearly through the stages but can vacillate between the stages cyclically until the change in behavior is achieved. There are ten associated processes that have been identified to assist individuals in their progression through the stages (Spencer et al., 2006): consciousness raising, dramatic relief, self-reevaluation, social liberation, self-
10
liberation, environmental reevaluation, helping relationships, counter conditioning, reinforcement management, and stimulus control. These processes of change are emphasized at an individual’s particular stage, once it has been identified, in order to assist the individual to the next stage (Marcus & Simkin, 1994). Individuals in precontemplation and contemplation perceive that the cons of behavior change (negative consequences) outweigh the pros (positive perceptions) of behavior change. Preparation individuals perceive them as equal. In the action stage, individuals perceive pros outweighing the cons. There is evidence that perceived barriers to exercise participation may be associated with exercise adherence (Fallon, Hausenblas, & Nigg, 2005). Individuals classify barriers into broad categories such as time, enjoyment, health limitation, and obstacles and these barriers influence both intention and compliance to exercise (Clarke & Eves, 1997). In addition, obligated commitments are barriers to long term exercise adherence as participants are less likely to maintain long-term committed exercise regimes (Brinthaupt, Kang, & Anshel, 2010). The TTM stage-based approach used in conjunction with motivational interviewing strategies has been shown to be most effective in assisting individuals through the stages (Butterworth, Linden, McClay, & Leo, 2006; Wilson & Schlam, 2004). Motivational Interviewing (MI) is the process that practitioners employ to assess an individual’s stage of change (Huffman, 2010; Linden, Butterworth, & Prochaska, 2010). In using such techniques as open-ended questions, affirmations, reflective listening, and
11
summaries, practitioners are able to determine the individuals’ willingness to change and potential gaps or roadblocks that hamper their attempts to implement health behaviors. Using MI, many coaching programs have been better able to address such areas as self-efficacy, implementation of intentions, motivations, perceptions of pros and cons, and environmental and cultural influences specific to an individual’s healthrelated behavior, such as exercise (Butterworth et al., 2010). The use of MI with stagematched behavior has been proven to better facilitate health behavior change than previous methods in which practitioners typically prescribed and instructed individuals on healthy change (Butterworth et al., 2010). To summarize, individuals who are unable or unwilling to participate in an exercise program can be guided by the use of MI to determine the barriers to sustained exercise adherence. Understanding the TTM stage and the associated processes of change for these individuals can facilitate an increased level of engagement and adherence to exercise. In conclusion, Identification of an individual’s stage of change through the use of MI can effectively facilitate movement from a pre-contemplation to a maintenance stage. By addressing barriers, identifying gaps in knowledge, identifying support, determining self-efficacy, motivational attitudes, and perceived control, practitioners are better able to effect change by working with rather than instructing individuals.
12
Statement of the Problem and Hypotheses Obesity levels continue to increase worldwide in developed nations. Theorists and researchers have proposed that individuals have a tendency to choose healthy and unhealthy environments that reinforce their own developed personality. Therefore an understanding of an individual’s general personality profile based on FFM can be used to predict an individual’s bias towards exercise adherence and exercise behavior. With an understanding of an individual’s pre-disposed bias toward exercise, coaches using MI can more effectively address barriers, determine self-efficacy, and instigate behavior change from pre-contemplation to action. An understanding of an individual’s predominant personality trait, locus of causality orientation, and motivation attitudes towards exercise can assist health care providers when addressing situational and behavioral barriers. Hypothesis One: Based on previous research, personality domains Extraversion, Neuroticism, and Conscientiousness should be related to exercise adherence. Studies have shown that exercisers are more extraverted and less neurotic than their nonexercising counterparts (Courneya & Hellsten, 1998). Individuals high in Conscientiousness are more diligent and achievement orientated than those who are low in Conscientiousness, which has been confirmed in previous research examining adherence to self-motivation and exercise adherence (Dishman, Ickes, & Morgan, 1980). Therefore conscientious and extraverted individuals are highly predicted to be in action or maintenance stages than in earlier stages.
13
Hypothesis Two: The causality orientations are believed to be motivational in nature and as such the scale that was constructed is a representation of the varying measures of each orientation within an individual rather than a classification of an individual as one of the types. Locus of Causality (LOC) is representative of four orientations: Locus of Causality for Exercise, Autonomy, Controlled, and Impersonal. Individuals with strong autonomy interpret situations as more autonomy promoting and organize their actions on the basis of personal goals and interests rather than control or constraints (Deci & Ryan, 1985). Control oriented individuals tend to do things because they “should” and rely on extrinsic rewards to determine their behavior, whereas high Impersonal oriented individuals tend to believe they are unable to regulate their behavior and believe the sources of control are unknown and regulated by impersonal forces (Deci & Ryan, 1985). An individual’s perception of LOC exerts effects upon behavior through intentions which can enhance the effects of personality and the associated individual differences towards exercise adherence (Rhodes & Courneya, 2003). Thus, individuals’ LOC orientations will predict their Stage of Change to exercise. In particular, I expected that individuals with an autonomy orientation or a high score on the Locus of Causality for exercise survey would rate themselves in either an action of maintenance stage. Hypothesis Three: As discussed earlier, motivation is comprised of five parts: Amotivation, Extrinsic, Introjected, Identified, and Intrinsic. Previous research has discovered that where motivation is intrinsic, exercise behavior is internalized and there
14
is a strong possibility that exercise can continue for a long period of time, suggesting a self-determined motivational profile (Matsumoto & Takenaka, 2004). Individuals therefore classified as nonself-determined will maintain a strong extrinsic motivation and introjected profile whereas Amotivated individuals, who are also nonselfdetermined, maintain a low motivational profile (Matsumoto & Takenaka, 2004). Therefore motivational attributes will be a strong predictor of Stage of Change for exercise. In particular, I expected that amotivated individuals would be more likely to place themselves in the pre-contemplation stage and conversely intrinsic individuals would more likely stage themselves in action or maintenance stages. Hypothesis Four: Finally, the satisfaction of psychological needs for competence and autonomy, as stated by Deci and Ryan (2000), will internalize and integrate intrinsic motivation which is necessary to strengthen exercise behavior. As represented in Figure 1, when all the personality types, motivational attitudes, and locus of causality orientations are entered into the full model they will predict exercise adherence. The expectation is that if individuals differ in their motivational orientations and personality based causality orientations, then it is possible that by fostering environments that promote intrinsic motivation, increased exercise adherence and participation will be achieved (Rose et al., 2001).
15
Figure 1
16
CHAPTER II Method Participants Three hundred and seven (54 male and 253 female) employees from a health company of varied educational, socio-economic, physical fitness, and environmental backgrounds in 16 United States geographic locations completed electronically delivered surveys. This research was approved by the Institutional Review Board of Middle Tennessee State University and all participants were informed as to the nature and intent of the study and were afforded the opportunity to accept or decline consent to participate. Three hundred and seventy one surveys were attempted; sixty-four participants who did not complete at least 50% of the survey were eliminated. The age range was 22 – 68 with a mean of 45 years (SD = 12.2). Procedure The surveys were delivered via three different electronic weekly newsletters over the period of two weeks. Participants had the option to choose to participate in the survey by selecting a link in the newsletters which in turn opened a separate web page. The link to the surveys was designed as a one-time use and therefore eliminated the possibility of individuals taking the survey more than once. A cover letter on the opened web page informed the employees that the survey results would be used in a publishable manuscript, no personal data would be collected, and information collected
17
would be used to determine effective strategies for healthy change. Participants then selected the option for consent at which time the web page opened to allow them to complete the survey. Measures The survey consisted of the participant’s self-reported Stage of Change for exercise, a 10-item Big 5 personality inventory, a 7-item Exercise Causality Orientations Scale, a 19-item Behavior Regulation for Exercise survey, and a 3-item Locus of Causality for Exercise Scale. Additionally, gender, age, and geographic work location were collected. All participants completed the measures in the order they are listed earlier and had the option to skip any question that they did not wish to answer. Stage of Change. The measure for Stages of Change for exercise (Prochaska & Velicer, 1997) assessed the participant’s current stage for exercise. This measure was based on the 1996 physical activity recommendations from the Centers for Disease Control and the American College of Sports Medicine stating 30 minutes of moderate physical activity 30 minutes five to seven times per week or intense activity for 20 minutes three times per week. Participants had five options to represent their current exercise frequency, which determines their appropriate stage for exercise: 1. (PreContemplation) No, and I do not intend to in the next 6 months; 2. (Contemplation) No, but I intend to in the next 6 months; 3. (Preparation) No, but I intend to in the next 30
18
days; 4. (Action) Yes, I have been for less than 6 months; 5. (Maintenance) Yes, I have been for more than 6 months. Ten-Item Personality Inventory. Gosling, Rentfrow, and Swann (2003) developed an abbreviated 10-item version of the Big 5 personality assessment for research projects that require a very brief assessment of participants’ personality over the five domains. Each item consists of two descriptors, separated by a comma, using the common stem, “I see myself as:…” A typical example would be “I see myself as extraverted, enthusiastic.” Each of the five items was rated on a 7-point scale (1= disagree strongly, 7= agree strongly). With only two items per scale, the 10-Item Personality Inventory (TIPI) emphasized content validity considerations thus lowering inter-item correlations that are typical with more homogenous scales. Unusually low internal consistency estimates for Cronbach alphas were .68, .40, .50, .73, and .45 for the Extraversion, Agreeableness, Conscientiousness, Neuroticism, and Openness scales respectively (Gosling et al., 2003). The Cronbach’s alpha scores in the current study were very similar to previously reported values: Extraversion .76, Agreeableness .45, Conscientiousness .33, Neuroticism .62, and Openness .44. Exercise Causality Orientations Scale. The 7-scenario Exercise Causality Orientations Scale (ECOS) was used to assess the participants’ motivational orientation towards initiating and regulating behavior (Markland, 1999). The ECOS contains seven exercise scenarios with three different responses, with each response corresponding to one of the three causality orientations, which the respondents rate on a 7-point scale (1
19
= very unlikely, 7 = very likely) in terms of how characteristically those responses best represent them. These responses captured the defining characteristics for each causality orientation (autonomous, control, and impersonal), as they would relate to the scenario described below (Rose et al., 2001). An example of one such scenario with responses follows: You are asked to keep a record of all the weekly exercise you have completed in an exercise diary. You are likely to view the diary: 1. As a way to measure your progress and to feel proud of your achievements. (Autonomy) 2. As a way of pressurizing yourself to exercise. (Control) 3. As a reminder of how incapable you are at fulfilling the task. (Impersonal) (Rose et al., 2001) Upon completion of the survey, the score for Autonomy, Controlled, and Impersonal are summed by orientation and the highest total score indicates the orientation that best describes the participant. The development of the 7-scenario measure resulted in a model fit: Satorra-Bentler scaled chi square = 387; minimum fit function chi square = 445; df = 165; CFI = .96; SRMR = .06; RMSEA = .05 (90% confidence interval. = .04 : 06) (Rose, Markland, & Parfitt, 2001). Locus of Causality for Exercise Scale. The 3-item Locus of Causality for Exercise Scale (LCE; Markland & Hardy, 1997) assesses the extent to which individuals feel that
20
they freely choose to exercise rather than the feeling that they are forced to for some reason. When individuals feel that their behavior is controlled, whether by pressure from others or self-imposed, they are said to have an external locus of causality. An external example item is: “Exercising is not something I would necessarily choose to do; rather it is something that I feel I ought to do.”
An internal perceived locus of causality is apparent when individuals feel autonomous and that they are engaging in the activity without a sense of compulsion or pressure from external forces. An internal example item is: “I exercise because I like to rather because I feel I have to.” Participants rate each item using a 7-point scale (1 = strongly disagree, 7 = strongly agree). Two items in the scale that reflect less autonomy are reverse scored then summed with the third item and an averaged composite score is calculated. Therefore composite scores closer to 7 are said to indicate individuals who are more autonomous in nature. The scale was developed using exploratory and confirmatory factor analysis with reported alpha reliability of .83 and .82 in two studies (Markland & Tobin, 2004). In this study, the Cronbach’s alpha value was .81. Scores range between 3 and 21, with high scores indicating more internal perceived locus of causality and lower scores more external locus of causality (Rose et al, 2001).
21
Behavioral Regulation in Exercise Questionnaire. The 19-item Behavioral Regulation in Exercise Questionnaire (BREQ-2) determines the participants’ amotivation, external, introjected, and identified forms of regulation of exercise behavior (Markland & Tobin, 2004). Participants rate statements regarding exercise attitudes, using a 7point scale (1 = strongly disagree, 7 = strongly agree). Answering strongly agree to the item “I think exercising is a waste of time” is representative of individuals with amotivated regulation. Strongly agree answers on items similar to “I exercise because other people say I should” are representative of external regulation. Introjected regulation is representative of strongly agree responses to the item “I feel guilty when I don't exercise;” strongly agree responses to “I value the benefits of exercise” indicate identified regulation, and finally strongly agree responses to “I exercise because it is fun” is an example of intrinsic regulation. A recent study of 194 participants confirmed the reliability of this scale with Cronbach’s alpha values as follows: Amotivation .83, External regulation .79, Introjected regulation .80, Identified regulation .73, and Intrinsic regulation .86 (Markland &Tobin, 2004). In this study, the Cronbach’s alpha values were similar: Amotivation .78, External regulation .78, Introjected regulation .70, Identified regulation .70, and Intrinsic regulation .94.
22
CHAPTER III Results Descriptives The sample consisted of 307 total participants out of which 2 male and 16 female participants staged themselves in pre-contemplation; 3 male and 38 female participants that staged themselves in contemplation; 7 male and 39 female participants that staged themselves in preparation; 7 male and 60 female participants that staged themselves in action; and lastly 35 male and 99 female participants that staged themselves in maintenance. Principal Component Analysis Principal Component Analysis (PCA) is a variable reduction procedure that creates principal components which account for most of the variance in the observed variables. It is used to determine the redundancy or correlation between variables that may be measuring the same construct and aids in the determination of which items to be used as predictor variables in subsequent analyses (Stevens, 1986). PCA was used on all measures within this study to generate principal components used in the regression analyses. Ten-Item Personality Inventory – Owing to the inability to perform Confirmatory Factor Analysis on this measure (Gosling et al., 2003), Principal Component Analysis was
23
performed with a Varimax rotation using SPSS (version 21). Initial inspection of the correlation matrix indicated that the conscientiousness item 8 (“I see myself as disorganized, careless") did not meet the correlation criterion greater than 0.3. The item was therefore eliminated. The analysis was re-run and the correlation matrix was reassessed. It was determined that all items had at least one correlation coefficient greater than 0.3. Upon inspection of the rotated component matrix, agreeableness item 2 (“I see myself as critical, quarrelsome“) loaded strongly on two components and was also removed. The analysis was re-run, the correlation matrix and rotated component matrix were reassessed and it was determined that all items met the correlation criteria. On closer inspection of the rotated component matrix, agreeableness and conscientiousness factors did not have more than one variable with loadings ≤ .3 and were removed. The overall Kaiser-Meyer-Oklin (KMO) measure was 0.550 with all individual KMO measures greater than .5 with the exception of extraversion question 6 and neuroticism question 4 with KMO values .499 and .486 respectively, suggesting classifications of ‘miserable’ to ‘middling’ according to Kaiser (1974). Before deciding to remove these 2 variables assessment of Bartlett’s Test of Sphericity indicated statistical significance (p < .0005) indicating that the data were likely factorizable and the two variables in question were retained. PCA revealed two components that had eigenvalues greater than one and which explained 32.9%, and 25.6% of the total variance, respectively. Visual inspection of the scree plot (Appendix A) indicated that three components should be retained (Cattell,
24
1966). In addition, a 3-component solution met the interpretability criterion. As such, three components were retained. The 3-component solution explained 74.8 % of the total variance, with each of the components contributing at least 10% to the total variance. A Varimax orthogonal rotation was employed to aid interpretability. The rotated solution exhibited ‘simple structure’ (Thurstone, 1947). The interpretation of the data was consistent with the personality attributes the questionnaire was designed to measure with strong loadings of extraversion items on Component 1, neuroticism items on Component 2, and openness items on Component 3. Component loadings and communalities of the rotated solution are presented in Table 1.
Table 1 PCA Rotated Varimax Structure Matrix of The Ten-Item Personality Inventory Items
Rotated Component Coefficients Component 1
Component 2
Component 3
Communalities
Extraversion 6 Rev
.904
-.137
.088
.844
Extraversion 1
.879
.159
.140
.818
Neuroticism 4 Rev
.131
.815
.138
.700
-.115
.863
.006
.759
Openness 10 Rev
.124
-.095
.846
.740
Openness 5
.086
.281
.738
.631
Neuroticism 9
Note. Major loadings for each item are bolded.
25
Composite scores were computed for each raw score for the items listed in Table 1. These composite scores were later used in the regression analysis. Exercise Causality Orientations Scale - Principal Component Analysis was performed with a Varimax rotation with SPSS (version 21). Initial inspection of the correlation matrix indicated that three items did not meet the correlation coefficient criterion greater than 0.3 and were subsequently removed (controlled item 2, autonomy items 6 and 7). The analysis was re-run and after review all items met the correlation coefficient greater than 0.3 criteria. Subsequent PCA analyses were re-run each time an item was removed until all items loaded strongly on each component. Items removed in order were impersonal item 1 (loaded strongly on two components), impersonal item 5 (strong loading on autonomy component one), impersonal 2 (correlation < .3), impersonal item 4 (strong loading on autonomy component one), autonomy item 1 (strong loading on impersonal component three), controlled item 7 (strong loading on impersonal component three), and lastly controlled item 6 (correlation < .3). The final overall Kaiser-Meyer-Oklin (KMO) measure was 0.741 with individual KMO measures greater than .675, classification of ‘middling’ to ‘meritorious’ according to Kaiser (1974). Bartlett’s Test of Sphericity was statistically significant (p < .0005) indicating that the data were likely factorizable. PCA analysis revealed three components that had an eigenvalues greater than one and which explained 53.4% of the total variance. Visual inspection of the scree plot (Appendix B) indicated that three components should be retained (Cattell, 1966). In
26
addition, a 3-component solution met the interpretability criterion. As such, three components were retained. A Varimax orthogonal rotation was employed to aid interpretability. The rotated solution exhibited ‘simple structure’ (Thurstone, 1947). The interpretation of the data was consistent with what the motivational attitudes questionnaire was designed to measure with strong loadings of autonomy items on Component 1, strong loadings of controlled items on Component 2, and strong loadings of impersonal items on Component 3. Component loadings are presented in Table 2. Table 2 PCA Rotated Varimax Structure Matrix of Exercise Causality Orientations Items Autonomy 3 Autonomy 2 Autonomy 5 Autonomy 4 Controlled 4 Controlled 3 Controlled 5 Controlled 1 Impersonal 3 Impersonal 7 Impersonal 6
Component 1 .788 .726 .696 .581 .228 -.228 -.131 .155 -.135 -.041 .044
Rotated Component Coefficients Component 2 Component 3 -.168 .169 .227 .103 .090 -.252 -.129 -.229 .733 .090 .655 .003 .620 .207 .567 .207 -.055 .772 .313 .678 .316 .676
Note. Major loadings for each item are bolded.
Communalities .677 .589 .556 .407 .597 .481 .445 .389 .616 .560 .558
Composite scores were computed for each raw score for the items listed in Table 2. These composite scores were used later in the regression analysis.
27
Locus of Causality for Exercise - Principal Component Analysis was performed with a Varimax rotation in SPSS (version 21). Initial inspection of the correlation matrix indicated that all variables had at least one correlation coefficient greater than 0.3. The overall Kaiser-Meyer-Oklin (KMO) measure was 0.68 with individual KMO measure greater than .6, classification of ‘mediocre’ to ‘middling’ according to Kaiser (1974). Bartlett’s Test of Sphericity was statistically significant (p < .0005) indicating that the data were likely factorizable. PCA revealed one component that had an eigenvalue greater than one and which explained 72.5% of the total variance. Visual inspection of the scree plot (Appendix C) indicated that one component should be retained (Cattell, 1966). In addition, a 1-component solution met the interpretability criterion. As such, one component was retained. The one-component solution explained 72.5% of the total variance. A Varimax orthogonal rotation was employed to aid interpretability. The rotated solution was not achievable as only one factor was extracted. The interpretation of the data was consistent with what the Locus of Causality for Exercise questionnaire was designed to measure with strong loadings of Locus of Causality for Exercise items on Component 1. Component loadings are presented in Table 3.
28
Table 3 Component Matrix for PCA of the Locus of Causality for Exercise Survey Items LOC 2 Rev LOC 3 Rev LOC 1
Component Coefficients Component 1 Communalities .899 .807 .837 .701 .816 .666
Composite scores were computed for each raw score for the items listed in Table 3. These composite scores were used later in the regression analysis. Behavioral Regulation in Exercise Questionnaire – Principal Component Analysis was performed with a Varimax rotation in SPSS (version 21). Initial inspection of the correlation matrix indicated that all items had at least one correlation coefficient greater than 0.3. Inspection of the rotated matrix revealed three items that loaded strongly on more than one component; identified 4 (“I get restless if I don’t exercise”), identified 2 (“It’s important for me to exercise regularly”), and amotivation 4 (“I think exercising is a waste of time”) and were removed from the analysis. The final overall Kaiser-Meyer-Oklin (KMO) measure was 0.839 with individual KMO measure greater than .7, classifications of ‘middling’ to ‘meritorious’ according to Kaiser (1974). Bartlett’s Test of Sphericity was statistically significant (p < .0005) indicating that the data were likely factorizable. Principal Component extraction revealed five components that had eigenvalues greater than one and which explained 31.1%, 17.1%, 10.1%, 6.9%, and 6.5% of the total variance, respectively. Visual inspection of the scree plot (Appendix D) indicated that
29
five components should be retained (Cattell, 1966). In addition, a 5-component solution met the interpretability criterion. As such, five components were retained. The five-component solution explained 71.7% of the total variance. A Varimax orthogonal rotation was employed to aid interpretability. The rotated solution exhibited ‘simple structure’ (Thurstone, 1947). The interpretation of the data was consistent with the motivational attributes the questionnaire was designed to measure with strong loadings of intrinsic items on Component 1, extrinsic items on Component 2, amotivation items on Component 3, introjected items on Component 4, and identified items on Component 5. Component loadings and communalities of the rotated solution are presented in Table 4.
30
Table 4 PCA Rotated Varimax Structure Matrix of Behavioral Regulation in Exercise Questionnaire Items
Rotated Component Coefficients Component 1
Component 2
Component 3
Component 4
Component 5
Communalities
Intrinsic 3
.920
-.095
-.161
.078
.128
.903
Intrinsic 2
.915
-.098
-.163
.079
.140
.899
Intrinsic 1
.890
-.099
-.142
.078
.036
.829
Intrinsic 4
.769
-.094
-.165
.135
.329
.754
Extrinsic 2
-.038
.793
.170
.069
.015
.664
Extrinsic 3
.005
.788
..183
.017
-.093
.664
Extrinsic 4
-.070
.756
.129
.183
-.051
.630
Extrinsic 1
-.238
.685
.129
.007
.050
.545
Amotivation 2
-.183
.173
.813
-.025
-.140
.744
Amotivation 3
-.213
.170
.789
-.052
-..001
..699
Amotivation 1
-.125
.272
.766
-.121
-.107
.703
Introjection 1
.087
-.155
-.009
.802
.090
.683
Introjection 2
.202
.189
-.050
.768
.026
.670
Introjection 3
-.009
.256
-.123
.755
.020
.651
Identified 3
.114
-.103
-.086
.076
.867
.788
Identified 1
.374
.075
-.119
.045
.692
.640
Note. Major loadings for each item are bolded
Composite scores were computed for each raw score for the items listed in Table 4. These composite scores were used later in the regression analysis.
31
Regression Analysis Hypothesis One: Personality trait PCA composite scores were regressed onto selfreported Stage of Change for exercise using SPSS (version 21). There was an independence of residuals, as assessed by a Durbin-Watson statistic of 2.026. Inspection of the studentized residual and unstandardized predicted value scatterplot indicated a linear relationship between the independent variables and dependent variable as well as a verification of homoscedasticity. The assumptions of linearity, independence of errors, homoscedasticity, unusual points and normality of residuals were met. Regression analysis of personality variables to stage of change did indicate statistical significance F(3, 303) = 2.769, p = .042, adj. R2 = .017, with only Openness significant, p < .05. Thus, hypothesis one was not supported as conscientiousness nor extraversion were significant, however the Openness component was significant which indicates that individuals having higher scores on openness would stage themselves relative to action or maintenance stages. Regression coefficients and standard errors can be found in Table 5.
32
Table 5 PCA Regression Analysis Personality Variable B SEB Intercept 3.831 0.073 Extraversion -0.020 0.073 Neuroticism 0.105 0.073 Openness 0.182 0.073 Note. *p < .05; B = unstandardized regression coefficient;
ϐ -0.015 0.081 *0.141
SEϐ = standardized error of the coefficient; ϐ = standardized coefficient
Hypothesis Two: Locus of Causality Orientations and LOC for exercise PCA composite scores were regressed onto self-reported Stage of Change for exercise using SPSS (version 21). There was an independence of residuals, as assessed by a DurbinWatson statistic of 2.089. Inspection of the studentized residual and unstandardized predicted value scatterplot indicated a linear relationship between the independent variables and dependent variable as well as a verification of homoscedasticity. The assumptions of linearity, independence of errors, homoscedasticity, unusual points and normality of residuals were met. Locus of Causality orientations were significant when regressed to Stage of Change F(4, 302) = 21.790, p < .0005, adj. R2 = .214, with LOC for Exercise and Autonomy variables significant, p < .0005 (Table 6) indicating that higher scores for LOC for exercise and Autonomy significant predictors to higher stages such as action or maintenance. Thus, hypothesis two was partially supported.
33
Table 6 PCA Regression Analysis Locus of Causality Orientations Variable Intercept Autonomy Impersonal Controlled LOC for Exercise
B
SEB
ϐ
3.831 0.332 0.014 -0.001 0.410
0.066 0.071 0.066 0.066 0.071
*0.256 0.011 -0.001 *0.317
Note. *p < .005; B = unstandardized regression coefficient; SEϐ = standardized error of the coefficient; ϐ = standardized coefficient
Hypothesis Three: Behavioral Regulation of Exercise PCA composite scores were regressed onto self-reported Stage of Change for exercise using SPSS (version 21). There was an independence of residuals, as assessed by a Durbin-Watson statistic of 1.987. Inspection of the studentized residual and unstandardized predicted value scatterplot indicated a linear relationship between the independent variables and dependent variable as well as a verification of homoscedasticity. The assumptions of linearity, independence of errors, homoscedasticity, unusual points and normality of residuals were met. Regression analysis of Behavioral Regulation of Exercise to Stage of Change did indicate significance, F(5, 301) = 19.501, p < .0005, adj. R2 = .232. All motivational variables were significant to Stage of Change p < .05, with the exception of Identified regulation. These results provided strong support for hypothesis three that a continuum does exists with amotivated individuals as pre-contemplative and intrinsic individuals in an action or maintenance stages (Table 7).
34
Table 7 PCA Regression Analysis Behavioral Regulation in Exercise Variable Intercept Intrinsic Extrinsic Amotivation Introjected Identified
B
SEB
ϐ
3.831 0.551 -0.207 -0.164 0.177 0.078
0.065 0.065 0.065 0.065 0.065 0.065
*0.425 *-0.160 *-0.127 *0.137 0.060
Note. *p < .05; B = unstandardized regression coefficient; SEϐ = standardized error of the coefficient; ϐ = standardized coefficient
Hypothesis Four: Personality traits, locus of causality, locus of causality for exercise, and behavioral regulation in exercise composite scores were regressed onto self-reported Stage of Change for exercise using SPSS (version 21). There was an independence of residuals, as assessed by a Durbin-Watson statistic of 2.114. Inspection of the studentized residual and unstandardized predicted value scatterplot indicated a linear relationship between the independent variables and dependent variable as well as a verification of homoscedasticity. Initial inspection of the correlation matrix indicated no correlations greater than .70. Consultation of Tolerance and VIF values indicated no problems with collinearity issues, with all variable Tolerance values greater than .441 and VIF variable levels below 2.268. Inspection of the casewise diagnostics table indicated one outlier with value above ±3 SDs (-3.073). Before determination to remove this outlier, leverage values were assessed with no responses considered “risky.” Further inspection of Cooks values indicated all responses were below the cut-
35
off level of 1.00, an indication of no highly influential points; therefore the outlier was not removed. Finally histogram (Appendix E), normal p-plot (Appendix F), and Q-Q plot (Appendix G) were reviewed for normal distribution. The assumptions of linearity, independence of errors, homoscedasticity, unusual points and normality of residuals were met. By keeping all other variables held constant, Openness no longer is a significant predictor in the final model. The full model with all variables present was statistically significant at predicting an individual’s stage of change, F(12, 294) = 9.466, p < .0005, adj. R2 = .249. Hypothesis four was partially supported with Autonomy, Locus of Causality for Exercise, Intrinsic motivation, and Introjected motivation as significant predictors. Regression coefficients and standard errors can be found in Table 8 below.
36
Table 8 Summary of Full Model Multiple Regression Analysis Variable B SEB Intercept 3.831 0.064 Extraversion -0.065 0.067 Neuroticism -0.032 0.068 Openness 0.000 0.068 Autonomy 0.224 0.079 Impersonal 0.033 0.068 Controlled -0.002 0.073 LOC for Exercise 0.195 0.095 Intrinsic 0.330 0.097 Extrinsic -0.112 0.078 Amotivation -0.110 0.069 Identified 0.070 0.065 Introjected 0.181 0.065 Note. *p < .05; B = unstandardized regression coefficient;
ϐ -0.050 -0.025 0.000 *0.173 0.026 -0.002 * 0.150 *0.255 -0.087 -0.085 0.054 *0.140
SEϐ = standardized error of the coefficient; ϐ = standardized coefficient
37
CHAPTER IV Discussion This is the first study to combine the predictive factors of personality, motivation and locus of causality on stage of change in the exercise domain. Unfortunately, the personality inventory used was not as robust a measure as desired as it contained only 10-items. Openness was the only significant item when the personality traits were regressed to Stage of Change. Individuals who are high in Openness tend to have a need for variety (McCrae & John, 1992). Conscientiousness was the most frequently endorsed personality trait in this sample (Table 1). Additionally, a total of 201 participants ranked themselves as either in the action or maintenance Stage of Change (Table 2) which likely confirms previous research that individuals high in Conscientiousness are more likely to follow through on their intentions to exercise than those low in Conscientiousness in predicting Stage of Change even though this personality trait was not statistically significant (Bogg, 2008). Interestingly Extraversion and Neuroticism, which previous research has shown to be main contributors to exercise adherence, were not significant. Possible explanations as to the nonsignificance of these personality traits may be directly related to the population that the sample was derived. As the participants are employees of a health company, personality traits that are associated with non-exercisers such as individuals high in neuroticism may not be prevalent.
38
It is worth noting the ratio of females to males in this sample to general populations and the impact on significant personality traits. Previous research on the five factor model has indicated gender differences between males and females on the personality traits of agreeableness and neuroticism while there are small or negligible differences on extraversion, openness, and conscientiousness (Costa, Terracciano, & McCrae 2001). Locus of causality orientations indicates external or internal forces and their impact on health behaviors. An indication of a more autonomous orientation suggests an individual who will participate in an activity due to its enjoyment (Brickell et al., 2005). Most individuals staged themselves in Action or Maintenance so it is not surprising that LOC for Exercise and Autonomy are the only significant items when regressed to Stage of Change (Table 6). When addressing locus of causality, it was hypothesized that those individuals who perceive themselves as having an orientation that is controlled or impersonal will be less likely to achieve their goals and those with autonomous intentions will be closely related to intrinsic and identified motivational attitudes (Brickell et al., 2005). The significance of these autonomous variables is a clear indication that individuals have identified the importance and value of exercise and are committed to achievement of their goal (Ryan & Deci, 2000). Motivation has been described as a continuum from amotivation to intrinsic motivation and, as such, motivational attitudes will move on this continuum until intrinsic motivation is achieved (Ryan & Deci, 2000). When reviewing the coefficient
39
values for the Behavioral Regulation in Exercise scores (Table 9) it does appear that this continuum is confirmed as the coefficient values move from lowest value (amotivated) to highest value (intrinsic). Interestingly, all the motivational attitudes (except identified) are significant items when regressed to Stage of Change (Table 7). This sample is representative of a health behavior change company that encourages exercise behavior within and outside of the workplace Therefore it is not surprising that intrinsic and identified motivations are significant although this finding may not be representative of the general population at large. In the full model, when all the items are included in the regression analysis, only Autonomy, LOC for Exercise, Intrinsic motivation, and Introjected motivation are significant (Table 8). These are not surprising results due to the lack of robustness of the personality measure, and the high number of participants who staged themselves in the action and maintenance stages. Conclusion Consistent with the hypotheses and past research, the present study found that Openness is a personality dimension related to exercise adherence and behavior. The importance of Conscientiousness to exercise adherence is consistent with previous research categorizing Conscientious individuals as those who are determined and strong-willed in being task oriented and in the completion of goals. Therefore it is not surprising that there is a high representation in this sample of Conscientious individuals
40
along with significant Introjected and Intrinsic motivational attitudes as well as Autonomy and LOC for Exercise causality orientation. Although this study identified relationships among locus of causality and motivation and certain personality traits, further research is still required. For example, samples that are generalizable to the population may yield more useful findings as the current study lacked enough differentiation between the levels of Stage of Change. Any differences among samples are likely to have direct and meaningful implications for implementation of the most effective intervention programs. Additionally, a more comprehensive personality trait survey could yield a higher variability between traits. Of note is the high incidence of Openness personality traits for Pre-Contemplation and Contemplation stages and the shift to Conscientiousness for Preparation, Action, and Maintenance stages. Certain questions could be answered with future research such as: Are Openness personality traits representative of individuals that do not like/want to exercise? Is the Ten-Item Personality Inventory sufficient to capture the complexity of personality traits? Perhaps the most relevant question would be: Why are some of the items significant predictors of exercise adherence by themselves and are non-significant when they are combined with other constructs? Is there an underlying latency at work between these items when predicting exercise adherence?
41
The findings of this study suggest important considerations when working with individuals in the exercise domain. For example, identification of individuals who are already intrinsically motivated with an autonomous orientation have already internalized and recognized the benefits of exercise. Therefore, companies that are engaged in coaching, would find utilization of resources best served in other health related areas rather than exercise. The need for the creation of an atmosphere and environment that incorporates personality characteristics, individual differences, and environmental conditions that maintain or initiate exercise behavior is important. Through the use of motivational interviewing, tailoring interventions based on an individual’s motivational attitude, locus of causality orientations, and dominate personality trait could facilitate initiation and maintenance of exercise adherence.
42
References
1998-2008 No Leisure-Time Physical Activity Trend Chart (2010). Retrieved March 21, 2013 from http://www.cdc.gov/nccdphp/dnpa/physical/stats/leisure_time.htm. Biddle, S. H. (1999). Motivation and its perceptions of control: Tracing its development and plotting its future in exercise and sport psychology. Journal of Sport & Exercise Psychology, 21(1), 1-23. Blissmer, B., Prochaska, J., Velicer, W., Redding, C., Rossi, J., Greene, G., & ... Robbins, M. (2010). Common factors predicting long-term changes in multiple health behaviors. Journal of Health Psychology, 15(2), 205-214. doi:10.1177/1359105309345555. Bogg, T. (2008). Conscientiousness, the transtheoretical model of change, and exercise: A neo-socioanalytic integration of trait and social-cognitive frameworks in the prediction of behavior. Journal of Personality, 76(4), 775-802. doi:10.1111/j.1467-6494.2008.00504.x. Brickell, T., Chatzisarantis, N., & Pretty, G. (2006). Autonomy and control: Augmenting the validity of the theory of planned behaviour in predicting exercise. Journal of Health Psychology, 11(1), 51-63.
43
Brinthaupt, T. M., Kang, M., & Anshel, M. H. (2010). A delivery model for overcoming psycho-behavioral barriers to exercise. Psychology of Sport and Exercise, 11, 259266. Brinthaupt, T.M., Kang, M., & Anshel, M.H. (in press). Changes in exercise commitment following a values-based wellness program. Journal of Sport Behavior. Butterworth, S., Linden, A., McClay, W., & Leo, M. C. (2006). Effect of motivational interviewing-based health coaching on employees' physical and mental health status. Journal of Occupational Health Psychology, 11(4), 358-365. doi:10.1037/1076-8998.11.4.358. Calder, B. J., & Staw, B. M. (1975). Self-perception of intrinsic and extrinsic motivation. Journal of Personality and Social Psychology, 31(4), 599-605. doi:10.1037/h0077100. Cattell, R. B. (1966). The Scree Test for the Number of Factors. Multivariate Behavioral Research, 1, 245–276. Clarke, P., & Eves, F. (1997). Applying the transtheoretical model to the study of exercise on prescription. Journal of Health Psychology, 2(2), 195-207. doi:10.1177/135910539700200216.
44
Costa, P., Terracciano, A., & McCrae, R. (2001). Gender differences in personality traits across cultures: Robust and surprising findings. Journal of Personality and Social Psychology, 81(2), 322-331. doi:10.1037/0022-3514.81.2.322 Courneya, K. S., Bobick, T. M., & Schinke, R. J. (1999). Does the theory of planned behavior mediate the relation between personality and exercise behavior? Basic & Applied Social Psychology, 21(4), 317-324. Courneya, K. S., & Hellsten, L. M. (1998). Personality correlates of exercise behavior, motives, barriers and preferences: An application of the five-factor model. Personality and Individual Differences, 24(5), 625-633. doi:10.1016/S01918869(97)00231-6 Deci, E. L., & Ryan, R. M. (1985). The general causality orientations scale: Selfdetermination in personality. Journal of Research In Personality, 19(2), 109-134. doi:10.1016/0092-6566(85)90023-6. Dishman, R. K., Ickes, W. & Morgan, W. P. (1980). Self-motivation and adherence to habitual physical activity. Journal of Applied Social Psychology, 10, I 15-l 32. Ehrhart, M. G., Ehrhart, K., Roesch, S. C., Chung-Herrera, B. G., Nadler, K., & Bradshaw, K. (2009). Testing the latent factor structure and construct validity of the TenItem Personality Inventory. Personality & Individual Differences, 47(8), 900-905. doi:10.1016/j.paid.2009.07.012.
45
Fallon, E. A., Hausenblas, H. A., & Nigg, C. R. (2005). The transtheoretical model and exercise adherence: Examining construct associations in later stages of change. Psychology of Sport & Exercise, 6(6), 629-641. doi:10.1016/j.psychsport.2005.01.003. Fast, N. J., Gruenfeld, D., Sivanathan, N., & Galinsky, A. D. (2009). Illusory control: A generative force behind power's far-reaching effects. Psychological Science (Wiley-Blackwell), 20(4), 502-508. doi:10.1111/j.1467-9280.2009.02311.x. Furnham, A. (2008). Relationship among four Big Five measures of different length. Psychological Reports, 102(1), 312-316. doi:10.2466/PR0.102.1.312-316. Gosling, S. D., Rentfrow, P. J., & Swann, W. B., Jr. (2003). A very brief measure of the Big Five personality domains. Journal of Research in Personality, 37, 504-528. Hagger, M. S.(2009). Personality, individual differences, stress and health. Stress and Health, 25, 381-386. Hellmich, N. (2009, November 17). Rising obesity will cost U.S. health care $344 billion a year. USA Today. Retrieved from http://www.usatoday.com/. Huffman, M. (2010). Health coaching: A fresh approach to improving health outcomes and reducing costs. AAOHN Journal, 58(6), 245-252. doi:10.3928/0891016220100526-02.
46
Ingledew, D. K., Markland, D., & Medley, A. R. (1998). Exercise motives and stages of change. Journal of Health Psychology, 3(4), 477-489. doi:10.1177/135910539800300403. Ingledew, D. K., Markland, D., & Sheppard, K. E. (2004). Personality and selfdetermination of exercise behaviour. Personality & Individual Differences, 36(8), 1921. doi:10.1016/j.paid.2003.08.021 Kaiser, H.F. (1974). An index of factorial simplicity. Psychometrika, 39, 31-36. Kelly, T., Yang, W., Chen, C., Reynolds, K., & He, J. (2008). Global burden of obesity in 2005 and projections to 2030. International Journal of Obesity, 32(9), 1431-1437. doi:10.1038/ijo.2008.102. Kern, M. L. (2011). Personality and pathways of influence on physical health. Social and Personality Psychology Compass, 5(1), 76-87. Kim, Y. (2007). Application of the transtheoretical model to identify psychological constructs influencing exercise behavior: A questionnaire survey. International Journal of Nursing Studies, 44(6), 936-944. Lewis, M., & Sutton, A. (2011). Understanding exercise behaviour: Examining the interaction of exercise motivation and personality in predicting exercise frequency. Journal of Sport Behavior, 34(1), 82-97.
47
Linden, A., Butterworth, S., & Prochaska, J. (2010). Motivational interviewing-based health coaching as a chronic care intervention. Journal of Evaluation In Clinical Practice, 16(1), 166-174. doi:10.1111/j.1365-2753.2009.01300.x. Lippke, S., & Plotnikoff, R. C. (2009). The protection motivation theory within the stages of the transtheoretical model - Stage-specific interplay of variables and prediction of exercise stage transitions. British Journal of Health Psychology, 14(2), 211-229. doi:10.1348/13591 0708X399906. Marcus, B. H., & Simkin, L. R. (1994). The transtheoretical model: Applications to exercise behavior. Medicine And Science In Sports And Exercise, 261400-1404. Markland, D. (1999). Self-determination moderates the effects of perceived competence on intrinsic motivation in an exercise setting. Journal of Sport & Exercise Psychology, 21(4), 351-361. Markland, D. & Hardy, L. (1997). On the factorial and construct validity of the Intrinsic Motivation Inventory: Conceptual and operational concerns. Research Quarterly for Exercise and Sport, 68, 20-32. Markland, D. & Tobin, V. (2004). A modification to the Behavioural Regulation in Exercise Questionnaire to include an assessment of amotivation. Journal of Sport & Exercise Psychology, 26(2), 191-196.
48
McAdams, D. P. (1992). The Five-Factor Model in personality: A critical appraisal. Journal of Personality, 60(2), 329-361. Matsumoto, H., & Takenaka, K. (2004). Motivational profiles and stages of exercise behavior change. International Journal of Sport and Health Science, 2, 89-96. McCrae, R. R., & Costa, P. T. (1987). Validation of the Five-Factor model of personality across instruments and observers. Journal of Personality and Social Psychology, 52(1), 81-90. doi:10.1037/0022-3514.52.1.81. McCrae, R. R., & John, O. P. (1992). An Introduction to the Five-Factor model and its applications. Journal of Personality, 60(2), 175-215. Personality- Define Personality at Dictionary.com. (n.d.). Retrieved from Dictionary.com: http://dictionary.reference.com/browse/personality. Prochaska, J., & Velicer, W. (1997). The transtheoretical model of health behavior change. American Journal Of Health Promotion,12(1), 38-48. Raynor, D. A., & Levine, H. (2009). Associations between the Five-Factor model of personality and health behaviors among college students. Journal of American College Health, 58(1), 73-81.
49
Rhodes, R. E., Courneya, K. S., & Hayduk, L. A. (2002). Does personality moderate the theory of planned behavior in the exercise domain?. Journal Of Sport & Exercise Psychology,24(2), 120-132. Rhodes, R. E., & Courneya, K. S. (2003). Relationships between personality, an extended theory of planned behaviour model and exercise behaviour. British Journal of Health Psychology, 8(1), 19. Rose, E., Markland, D., & Parfitt, G. (2001). The development and initial validation of the Exercise Causality Orientations Scale. Journal of Sports Sciences, 19(6), 445-462. Ryan, R. M., & Deci, E. L. (2000). Intrinsic and extrinsic motivations: Classic definitions and new directions. Contemporary Educational Psychology, 25(1), 54-67. doi:10.1006/ceps.1999.1020. Ryan, R. M., & Deci, E. L. (2000). Self-determination theory and the facilitation of intrinsic motivation, social development, and well-being. American Psychologist, 55(1), 68-78. doi:10.1037/0003-066X.55.1.68. Spencer, L., Adams, T., Malone, S., Roy, L., & Yost, E. (2006). Applying the transtheoretical model to exercise: A systematic and comprehensive review of the literature. Health Promotion Practice, 7(4), 428-443. Stevens, J. (1986). Applied multivariate statistics for the social sciences. Hillsdale, NJ: Lawrence Erlbaum Associates.
50
Thurstone, L. L. (1947). Multiple factor analysis: A development and expansion of vectors of the mind. Chicago: University of Chicago. Whiteman, M. C., Deary, I. J., & Matthews, G. (2003). Personality traits (2nd ed.). United Kingdom: Cambridge University Press.
51
APPENDICES
52
APPENDIX A Ten-Item Personality Inventory
53
APPENDIX B Exercise Causality Orientations
54
APPENDIX C Locus of Causality for Exercise
55
APPENDIX D Behavioral Regulation in Exercise
56
APPENDIX E Histogram Multiple Regression for Stage of Change
57
APPENDIX F Multiple Regression P-P Plot for Stage of Change
58
APPENDIX G Multiple Regression Q-Q Plot for Stage of Change
59
APPENDIX H
June 11, 2012 Gregory Garret, Dr. Thomas Brinthaupt Department of Psychology
[email protected],
[email protected] Protocol Title: “The Relationship between Personality and Motivation in Exercise Adherence” Protocol Number: 12-337 Dear Investigator(s), The exemption is pursuant to 45 CFR 46.101(b) (2). This is because your study involves the use of survey materials and the information was recorded by the investigator in such a manner that subjects cannot be identified, directly or through identifiers linked to the subjects. You will need to submit an end-of-project report to the Office of Compliance upon completion of your research. Complete research means that you have finished collecting data and you are ready to submit your thesis and/or publish your findings. Should you not finish your research within the three (3) year period, you must submit a Progress Report and request a continuation prior to the expiration date. Please allow time for review and requested revisions. Your study expires on June 11, 2015. Any change to the protocol must be submitted to the IRB before implementing this change. According to MTSU Policy, a researcher is defined as anyone who works with data or has contact with participants. Anyone meeting this definition needs to be listed on the protocol and needs to provide a certificate of training to the Office of Compliance. If you add researchers to an approved project, please forward an updated list of researchers and their certificates of training to the Office of Compliance before they begin to work on the project. Once your research is completed, please send us a copy of the final report questionnaire to the Office of Compliance. This form can be located at www.mtsu.edu/irb on the forms page. Also, all research materials must be retained by the PI or faculty advisor (if the PI is a student) for at least three (3) years after study completion. Should you have any questions or need additional information, please do not hesitate to contact me. Sincerely, Andrew W. Jones Graduate Assistant to: Emily Born Compliance Officer 615-494-8918
[email protected]