Int. J. Electrochem. Sci., 7 (2012) 1666 - 1676 International Journal of
ELECTROCHEMICAL SCIENCE www.electrochemsci.org
Influence of Pressure on the Structural and Electrocatalytic Properties of Pt Nanoparticles Grown by Pulsed Laser Ablation onto Carbon Paper Substrate Zéhira Hamoudi, My Ali El Khakani and Mohamed Mohamedi* Institut National de la Recherche Scientifique (INRS)-Énergie, Matériaux et Télécommunications (EMT), 1650 Boulevard Lionel Boulet, Varennes, Québec, J3X 1S2, Canada. * E-mail:
[email protected] Received: 27 December 2011 / Accepted: 19 January 2012 / Published: 1 February 2012
The pulsed laser deposition has been used to synthesize Pt nanostructured films onto carbon paper substrate. In summary, we have examined the change occurring in structural characteristics of Pt thin films grown in a He background gas and in vacuum. The electrochemical studies showed that Pt deposited under 5 Torr of He background pressure displayed the highest electroactive surface area, and the highest current mass activity of methanol electro-oxidation. The reason for such enhanced electrocatalytic activity is ascribed to the high roughness of Pt5T surface, which offers more active sites. From an application point of view, this study demonstrates that using similar amount of Pt, the enhancement of the electrocatalytic activity can be achieved by tuning the surface roughness of the Pt rather than increasing its loading.
Keywords: Platinum; pulsed laser deposition; nanostructures, morphology effect; methanol electrooxidation
1. INTRODUCTION It is expected that nanostructures will lead to better utilization of noble metal and hence low electrode costs [1-2]. The activity of anode catalysts in fuel cell applications is critically affected by their structure, surface morphology, surface coverage, and durability. Exploring the relationship between electrode surface structure and the observed electron transfer reactivity will help proper design of high performing electrodes for fuel cells. In recent decades, researchers have tried a variety of electrodes structures in order to enhance the performance of fuel cells. Each major advance in material development and structuring has directed to a new generation of fuel cell electrodes [3-5].
Int. J. Electrochem. Sci., Vol. 7, 2012
1667
In our recent work [6], nanostructured Pt thin film catalysts of various morphologies have been synthesized by pulsed laser deposition (PLD) technique and studied towards enhancing their tolerance to CO poisoning; a reaction of critical issue to alcohol fuel cells. It was discovered that Pt film deposited under 5 Torr of He background pressure showed the highest electroactive surface area, and the lowest onset potential of CO oxidation demonstrating an enhancement of the CO poisoning resistance. In this work, our attention is focused on the influence of the PLD-background pressure on the electrocatalytic properties of thus synthesized nanostructured Pt towards methanol oxidation reaction (MOR), reaction that is of technological importance to direct methanol fuel cells (DMFCs) [7]. Hence, Pt was synthesized under vacuum and under various pressures of He atmosphere. Scanning electron microscopy (SEM), atomic force microscopy (AFM), Transmission electron microscopy (TEM), X-ray diffraction (XRD), and X-ray photoelectron spectroscopy (XPS) techniques were used to characterize the deposits. These aforesaid Pt nanostructures were then characterized in 0.5 M H2SO4 solution for their intrinsic electroactivity expressed in terms of electrode surface area (ESA). Afterwards, the MOR was studied by cyclic voltammetry (CV) and chronoamperometry in 0.5 M H2SO4+ 1 M CH3OH solution.
2. EXPERIMENTAL 2.1. Catalyst synthesis The Pt catalysts were deposited at room temperature using PLD by ablating a pure polycrystalline Pt target (99.99%, Kurt J. Lesker Co) by means of a pulsed KrF excimer laser (λ = 248 nm, pulse duration of 15 ns and at a repetition rate between 30 and 50 Hz). The laser fluence was set at 4 J/cm2, while the target-to-substrate distance was fixed at 5 cm. The target was moved continuously across the laser beam via a dual rotation and translation motion to obtain a uniform ablation over the entire surface of the target. A detailed description of the experimental PLD setup has been given elsewhere [8]. Prior to deposition, the chamber was evacuated by means of a turbo pump (4 × 10⁻⁵ Torr). Helium was then introduced in the deposited chamber. In this study, Pt samples were prepared using 50000 laser pulses either under vacuum denoted PtV or in the presence of He gas at various background pressure of 1, 2, 4 to 5 Torr and will be denoted Pt1T, Pt2T, Pt4T, and Pt5T (where T stands for Torr), respectively or PtxT when describing all Pt samples. The substrate chosen in this work is an untreated carbon paper (CP, Toray) made of 3D network of carbon fibers each having a diameter ranging between 7 and 10 m. This type of CP is well known in the area of fuel cells as the gas diffusion layer (GDL) in Membrane Electrode Assembly (MEA) and it is highly porous with good electrical conductivity and thus can also act as the current collector in the structures developed in this work. The Pt loading as measured by thermogravimetric analysis (TGA) was about 0.64 mg/cm 2 for all the samples.
Int. J. Electrochem. Sci., Vol. 7, 2012
1668
2.2. Material characterization The surface morphology of the as-prepared samples was examined by means of a scanning electron microscope (SEM, JEOL, JSM 6300F apparatus) operated at an accelerating voltage of 10 kV and a transmission electron microscopy (TEM, JEOL JEM-2100F) operating at 200 kV. The surface morphology and roughness of the samples were investigated by atomic force microscopy (AFM) using a Nanoscope III microscope from Digital Instrument. X-ray photoelectron spectroscopy (XPS) measurements were performed using a VG Escalab 220i-XL equipped with an Mg K source (1253.6 eV). The anode was operated at 10 kV and 20 mA. The pass energy of the analyzer was fixed at 20 eV. All samples were analyzed with a spot size of 250×1000 μm located approximately in the center of the sample. A survey spectra ranging from 0 to 1000 eV was first acquired, and then higher resolution multiplex scan spectra Pt 4f core levels were obtained. Quantification of the elements was performed with CasaXPS software (Casa Software Ltd.) by fitting the core level spectra after a Shirley background removal. The metallic components of the Pt 4f region were fitted using a Gaussian/ Lorentzian asymmetrically modified line shape, while a Gaussian/Lorentzian line shape was used to fit the other components. The C 1s core level peak at 284.6 eV, resulting from hydrocarbon contaminants at the surface, was used as an internal reference. All spectra have been recalibrated with respect to the C 1s core level peak of adventitious carbon contamination. The crystalline structure of all samples was determined by X-ray diffraction (XRD) using Bruker D8 Advance diffractometer equipped with a Cu K source. The diffractometer was operated at 40 kV and 40 mA. All diffractograms were acquired in the θ-2θ scan mode with an angular step size of 2θ of 0.04° and an acquisition time of 20 s by step.
2.3. Electrochemical studies Electrocatalytic properties were studied by cyclic voltammetry (CV) in 0.5 M H 2SO4 and in a mixture of 1 M CH 3OH+0.5 M H2SO4 deaerated solutions. Prior to the electrochemical measurements in methanol, the surface of the working electrode was cleaned electrochemically by potential cycling in 0.5 M H2SO4. Before each test, dissolved oxygen was removed from the solution by bubbling argon through the solution for 20 to 30 min. All electrochemical measurements were conducted at room temperature using a three compartments electrochemical cell with the reference electrode and counter electrode being an Ag/AgCl, 3 M NaCl and a platinum coil, respectively. The reference electrode was separated from the analyte solution by a Luggin capillary that is very close to the working electrode to minimize the IR drop. Data were acquired with a potentiostat/galvanostat Autolab from EcoChemie.
Int. J. Electrochem. Sci., Vol. 7, 2012
1669
3. RESULTS AND DISCUSSIONS 3.1. Synthesis and characterization of CP/Pt
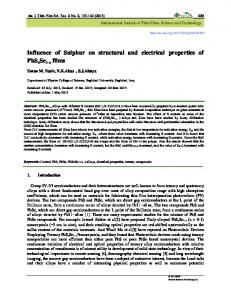
SEM images
AFM images R=1.8 nm
PtV
R=3 nm
Pt1T
1
R=4 nm
Pt2T
Y[µm]
0.8 0.6 0.4
0.2 0 0
0.2
0.4 0.6 X[µm]
0.8
1
R=4 nm
0.8
0.7
Pt4T
Y[µm]
0.6 0.5 0.4
0.3 0.2 0.1 0 0 0.1 0.2 0.3 0.4 0.5 0.6 0.7 0.8 X[µm]
R=7 nm
Pt5T
Figure 1. Surface morphology analyses of PLD-synthesized Pt under various He background pressures onto carbon paper substrate.
Int. J. Electrochem. Sci., Vol. 7, 2012
1670
TEM images
SAED (200)
dav=1.4nm (111)
PtV (220)
(311)
dav=4.4nm
Pt1T
dav=4.2 nm
Pt2T
Pt4T dav=3.9 nm
Pt5T dav=5 nm
Figure 2. TEM images and SAED patterns of PLD-synthesized Pt under various He background pressures onto carbon paper substrate.
Figure 1 shows SEM micrographs, as well as AFM images of Pt films deposited under vacuum (2 10 -5 Torr) and at He pressures varying from 1 to 5 Torr. Under all conditions of synthesis, the Pt xT deposits are found to highly cover the CP substrate. At the vacuum pressure, the PtV film appears dense and compact, with closed structure (no apparent pore). The AFM images confirm that no relief can be found at the surface of this film. The Pt V surface roughness, R, measured by AFM was found to be 1.8 nm indicating that it is very smooth. As the He pressure is increased from 1 to 5 Torr, the SEM and AFM images show the presence of grain boundaries and
Int. J. Electrochem. Sci., Vol. 7, 2012
1671
the surface roughness increased reaching 7 nm for Pt 5T.Typical HR-TEM images and Selected Area Electron Diffraction (SAED) patterns of PtxT films are shown in Fig. 2. In the case of Pt V, the nanoparticles are strongly interconnected and form a monolayer. The particle average diameter, dav estimated from TEM images was 1.4 nm± 0.8 nm. HR-TEM images of Pt films deposited under He pressure display more nanoparticles connectivity and overlap until developing into a dense columnar structure (Pt 4T and Pt5T). From TEM images dav was around 4.4, 4.2, 3.9 and 5 nm for Pt1T, Pt2T, Pt4T, and Pt5T, respectively. Finally, the SAED patterns demonstrates the polycrystalline nature of the Pt xT deposits, showing several bright concentric rings, attributed to the (111), (200), (220), and (311) diffractions of the Pt fcc crystal structure. The differences in the morphology (smooth versus porous) of the material product is due to the background pressure in the deposition chamber. These differences are mainly due to the decrease of the kinetic energy of the deposited species with the increasing of He pressure. The PLD involves all the physical processes of laser-material interaction during the impact of the highpower pulsed radiation on a solid target. Full details regarding the physical mechanisms responsible for the change of surface morphologies as function of the gas background pressure can be found in the work of Riabinina et al. [9]. Figure 3 shows the XRD patterns of PtxT films deposited under vacuum and various He pressures. The XRD spectra shows all the characteristic diffraction peaks of face centered cubic (fcc) lattice of Pt, indicating that PtxT films are polycrystalline with no preferential orientation. Since the Pt (111) was the most intense diffraction peak it was thus chosen to evaluate the lattice parameter of the fcc phase. A lattice parameter of 3.91 Å was obtained and was found unchanged for Pt films whether those deposited under vacuum or those made under various He background pressures.
Figure 3. X-ray diffraction patterns of Pt films deposited by PLD under various conditions of background gas pressure as indicated in the figure.
Int. J. Electrochem. Sci., Vol. 7, 2012
1672
High-resolution XPS Pt 4f core level spectra of the various Pt deposits are reported in Fig. 4. The Pt 4f core level spectrum displays two peaks whose maximum intensities are located between 71.3~71.5 eV and 74.6~74.8 eV binding energy range, which is expected from Pt 4f7/2 and Pt 4f5/2 core level peaks, respectively. The 3.3 eV binding energy difference between these two maxima is consistent with Pt being in a metallic state [10-12].
Figure 4. X-ray photoelectron spectra of Pt 4f core level peaks of Pt films deposited by PLD under various conditions of background gas pressure as indicated in the figure.
3.2. Electrochemical properties Figure 5a presents CVs recoded with a potential scan rate of 50 mV/s at the Pt electrodes in 0.5 M H2SO4 deaerated solution. In the potential region of ca. -0.3 to 0.2 V vs. Ag/AgCl, the CVs include the very well-known hydrogen adsorption (Hads) and desorption (Hdes) peaks [13-14]. The Pt oxide formation occurs at around 0.6 V whereas its counterpart reduction peak potential takes place within 0.52~0.53 V vs. Ag/AgCl. It has to be noted that peaks features of Had/Hdes became progressively resolved and their currents higher as the He background pressure increased, which illustrates the better utilization of Pt.
Int. J. Electrochem. Sci., Vol. 7, 2012
1673
Electrode surface area (ESA) is an important parameter representing the intrinsic electroactivity of Pt catalysts. The Pt ESA was determined electrochemically according to the following formula: ESA = QH/(Qref(Pt loading)) ESA is expressed in cm2/mgPt, where Pt loading is in mgPt/cm2 (0.64 mg/cm2) and Qref =0.21 mC/cm2 represents a monolayer hydrogen adsorption charge on polycrystalline Pt [15-16]. QH is the charge obtained by integrating the hydrogen adsorption region of the voltammograms shown in Fig. 5a, corrected for the double-layer current by back extrapolation of the current from the double layer region. Thus determined ESA as function of the pressure of He is reported in Fig. 5b. It can be seen that ESA increases moderately up to 4 Torr of He and then dramatically augments at 5 Torr reaching a value of 173 cm2/mg. Such high value of ESA is attributed to the higher surface roughness of Pt synthesized under 5 Torr of He.
200
5 Torr
a
5
b
0
150
2
2 Current density/(mA/cm )
-1
4 Torr
3
Electrode specific area/cm mg )
-5
0 -3
2 Torr 0
-4
1 Torr
0
100
50
-3
0 0
4
Vacuum
1 2 He pressure/Torr
4
5
0 -0.3
0.0
0.3
0.6
0.9
1.2
E/(V vs Ag/AgCl)
Figure 5. (a) Cyclic voltammetry in 0.5 M H2SO4 solution with the scan rate of 50 mV/s recorded at CP/PtxT electrodes. (b) Electrode specific area (ESA).
Next, CVs were run in 0.5 M H2SO4+1 M CH3OH solution at various scan rates and the results are reported in Fig. 6a-e. All electrodes exhibited the well-known methanol oxidation waves [17-18]. Figure 6f reports the peak current estimated from the forward anodic peak current extracted from slow CVs run at 5 mV/s (quasi-steady state). These currents are normalized by the Pt catalyst loading to generate mass activity as in mA/mgPt. This way to present is crucial concerning the practical application in fuel cells, i.e., the economical value of the catalyst, which basically is the activity
Int. J. Electrochem. Sci., Vol. 7, 2012
1674
normalized to cost. The mass activity delivered by the Pt5T electrode is 33 mA/mgPt, which is 5.7 times higher than the one displayed by PtV containing similar amount of Pt. The onset potential Eonset is another parameter that provides information about the kinetic of an electrochemical reaction. However, Eonset is a concept that is usually ill defined. It can be however estimated by establishing some criterion, even if arbitrary for example at 10% of the peak current. Accordingly, from CVs recorded at slow potential scan rate of 5 mV/s, we found an Eonset of 0.476, 0.478, 0.460, 0.476, and 0.471 V vs. Ag/AgCl for PtV, Pt1T, Pt2T, Pt4T, and Pt5T, respectively. It can be seen that Eonset does not vary much with the morphology of the electrode, which indicates that the nature of the active sites at the surface of Pt deposited under our conditions is identical.
8.0
40 16
a
6.0
b
14
c 30
12
2.0
2
i/(mA/cm )
8
2
i/(mA/cm )
2
i/(mA/cm )
10 4.0
6 4 2
20
10
0
0.0
-2
0
-4
-2.0 0.0
0.2
0.4
0.6
0.8
1.0
0.0
0.2
E/(V vs Ag/AgCl)
0.4
0.6
0.8
1.0
0.0
0.2
E/(V vs Ag/AgCl)
0.4
0.6
0.8
1.0
E/(V vs Ag/AgCl)
25
35 50
d
20
e
f
30
40
25
i/(mA/mgPt)
30
2
i/(mA/cm )
2
i/(mA/cm )
15
10
20
5
20 15 10
10 0
5 0 0.0
0.2
0.4
0.6
E/(V vs Ag/AgCl)
0.8
1.0
0 0.0
0.2
0.4
0.6
0.8
1.0
0
1
2
4
5
He pressure/Torr
E/(V vs Ag/AgCl)
Figure 6. (a-e) Cyclic voltammetry in 0.5 M H2SO4 + 1 M CH3OH-argon purged solution. The voltammograms were recorded at 5, 10, 20, 50, 100 and 200 mV s-1 potential scan rates: a) PtV, b) Pt1T, c) Pt2T, d) Pt4T, and e) Pt5T. Arrows indicate increasing potential scan rate. (f) Summary of peak current mass activity of MOR extracted from CVs recorded with 5 mV/s potential scan.
The better performance of CP/Pt5T was also confirmed by short-time chronoamperometric curves recorded by stepping the potential from the open circuit potential to 0.5 V vs Ag/AgCl, and the resulting current density-time curves are shown in Fig. 7a. It can be seen that all electrodes displayed an initial fast decay for periods of less than 0.2 sec followed by an increase upon higher time operation, attaining a quasi-equilibrium steady state. The fast decaying part is attributed to the formation of intermediate species, such as adsorbed CO during methanol oxidation reaction. The results of Fig. 7a confirm the high activity of Pt5T electrocatalyst. The steady state current mass activity
Int. J. Electrochem. Sci., Vol. 7, 2012
1675
(Fig. 7b) delivered by this electrode is 8.6 mA/mgPt that is 9.55 times higher than the corresponding mass activity delivered by PtV (0.9 mA/mg) that contains similar Pt loading.
10
a
6
b
5 Torr
8
2 i/(mA/cm )
4
4 Torr 2 Torr
3
iss/(mA/mg)
5
6
4
2
1 Torr
2 1
Vacuum
0
0 0
20
40
60
80
t/(s)
100
120
140
0
1
2
4
5
He pressure/Torr
Figure 7. (a) Chronoamperometry in 0.5 M H2SO4 + 1 M CH3OH-argon purged solution. (b) Summary of steady-state current mass activity of MOR extracted from the chronoamperograms of Fig. 7a.
4. CONCLUSIONS The pulsed laser deposition has been used to synthesize Pt nanostructured films onto carbon paper substrate. In summary, we have examined the change occurring in structural characteristics of Pt thin films grown in a He background gas and in vacuum. It was found that Pt deposited under vacuum was very smooth and dense. On the other hand, Pt deposited under He background pressure was rough and made of particles agglomerates. As the He pressure increased, the surface roughness increased. The electrochemical studies showed that Pt deposited under 5 Torr of He background pressure displayed the highest electroactive surface area, and the highest current mass activity of methanol electro-oxidation. The reason for such enhanced electrocatalytic activity is definitely ascribed to the high roughness of Pt5T surface, which offers more active sites. From an application point of view, it has always been known that higher amount of noble metal yields to high electrochemical performance. This study demonstrates that such condition is not necessary since similar amount of Pt was used. The enhancement of the electrocatalytic activity can be achieved by tuning the surface roughness of the Pt rather than increasing its loading. Finally, this work further provides a methodology for the proper design of catalysts that might be considered to be developed by the pulsed laser deposition technique.
Int. J. Electrochem. Sci., Vol. 7, 2012
1676
ACKNOWLEDGEMENT This work was supported by the Natural Sciences Engineering Research Council of Canada (NSERC), the Centre Québécois sur les Matériaux Fonctionnels (CQMF), the FQRNT and the MDEIE.
References 1. V. Baglio, A. Di Blasi, E. Modica, P. Cretì, V. Antonucci, A. S. Aricò, Int. J. Electrochem. Sci. 1 (2006) 71. 2. R.S. Amin, A.A. Elzatahry , K.M. El-Khatib, and M. Elsayed Youssef, Int. J. Electrochem. Sci. 6 (2011) 4572. 3. S. Litster and G. McLean, J. Power Sources 130 (2004) 61. 4. De-Chin Huang, Pei-Jung Yu, Feng-Jiin Liu, Shu-Ling Huang, Kan-Lin Hsueh, Yen-Cho Chen, Chun-Hsing Wu, Wen-Chen Chang, Fang-Hei Tsau, Int. J. Electrochem. Sci. 6 (2011) 2551. 5. Hong Wang, Min Zhang, Faliang Cheng, Changwei Xu, Int. J. Electrochem. Sci. 3 (2008) 946. 6. F. Saidani, D. Rochefort, M. Mohamedi, Laser Chemistry Article ID 143684 (2010) 7 pages. 7. J. Arun Kumar, P. Kalyani, and R. Saravanan, Int. J. Electrochem. Sci. 3 (2008) 961. 8. E. Irissou, F. Vidal, T. W. Johnston, M. Chaker, D. Guay, A. N. Ryabinin, J. Appl. Phys. 99 (2006) 34904. 9. D. Riabinina, E. Irissou, B. Le Drogoff, M. Chaker, and D. Guay, J. Appl. Phys. 108 (2010) 034322. 10. C. D. Wagner, W. M. Riggs, L. E. Davis, and J. F. Moulder, in Handbook of X-ray Photoelectronic Spectroscopy, Perkin-Elmer Corp: Eden Prairie, MN, 1979. 11. W. X. Tu, K. Takai, K. Fukui, A. Miyazaki, T. Enoki, J. Phys. Chem. B 107 (2003) 10134. 12. X. Y. Fu, Y. Wang, N. Z. Wu, L. L. Gui, Y. Q. J. Tang, Colloid Interface Sci. 243 (2001) 326. 13. 13 . K. Kinoshita, D. R. Ferrier, and P. Stonehart, Electrochim. Acta 23 (1978) 45. 14. T. J. Schmidt, H. A. Gasteiger, G. D. Stab, P. M. Urban, D. M. Kolb, and R. J. Behm, J. Electrochem. Soc. 145 (1998) 2354. 15. Mauro C. dos Santos, and Sergio A. S. Machado, J. Brazilian Chem. Soc. 9 (1998) 211. 16. K. Yamamoto, D. M. Kolb, R. Kotz, and G. Lehmpfuhl, J. Electroanal. Chem. 96 (1979) 233. 17. H. P. Liang, H. M. Zhang, J. S. Hu, Y. G. Guo, L. J. Wan, C. L. Bai, Angew. Chem. Int. Ed. 43 (2004) 1540. 18. Z. Liu, X. Y. Ling, X. Su, J. Y. Lee, J. Phys. Chem. B 108 (2004) 8234. © 2012 by ESG (www.electrochemsci.org)