MARINE ECOLOGY PROGRESS SERIES Mar Ecol Prog Ser
Vol. 381: 119–127, 2009 doi: 10.3354/meps07969
Published April 17
Influence of surface oceanographic variability on abundance of the western winter-spring cohort of neon flying squid Ommastrephes bartramii in the NW Pacific Ocean Jie Cao1, Xinjun Chen1, 2, 3,*, Yong Chen1, 2, 3, 4 1
College of Marine Sciences, 2The Key Laboratory of the Shanghai Education Commission for Oceanic Fisheries Resources Exploitation, and 3The Key Laboratory of Sustainable Exploitation of Oceanic Fisheries Resources, Ministry of Education, Shanghai Ocean University, 999 Hucheng Ring Road, Shanghai 201306, PR China 4
School of Marine Sciences, University of Maine, Orono, Maine 04469, USA
ABSTRACT: Abundance of the Ommastrephes bartramii winter-spring cohort fluctuated greatly from 1995 to 2004. To understand how abundance was influenced by sea surface conditions, we examined the variations in the proportion of thermal habitats with favourable sea surface temperature (SST). The SST data of both the spawning and feeding grounds were used to calculate the monthly proportion of favourable-SST areas (PFSSTA). Catch per fishing day per fishing boat (catch per unit effort, CPUE) of the Chinese mainland squid-jigging fleet was used as squid abundance index. The relationships between CPUE and monthly PFSSTA at spawning and feeding grounds were analyzed, and the relationship between CPUE and selected PFSSTA was quantified with a multiple linear regression model. Results showed that February PFSSTA at the spawning ground and August to November PFSSTA at the feeding ground could account for about 60% of the variability in O. bartramii abundance between 1995 and 2004, that February was the most important period influencing squid recruitment during the spawning season, and that feeding ground PFSSTA during the fishing season would influence CPUE by causing squid to aggregate. Our forecast model was found to perform well when we compared the model-predicted CPUEs and the average CPUEs observed during August to November in 2005 and 2006 from the Chinese squid-jigging fishery. KEY WORDS: Sea surface temperature · Abundance index · Ommastrephes bartramii · Northwest Pacific Ocean Resale or republication not permitted without written consent of the publisher
INTRODUCTION The role of environmental variables in regulating the dynamics of fishery stocks has been an important research topic, in particular for short-lived squid species (Roberts 1998, Agnew et al. 2002). The life span of most squid species is less than 1 yr (Boyle 1987). For such short-lived species, recruitment success dominates annual variations of stock abundance, and is influenced greatly by the physical and biological environments of spawning and nursery grounds (Sakurai et al. 2000). The abundance and distribution of squid
populations tend to be influenced greatly by environmental variables and respond quickly to changes in the environment (Wadley & Lu 1983, Yatsu et al. 2000, Anderson & Rodhouse 2001, Rodhouse 2001, Waluda et al. 1999, 2001, 2006, Bazzino et al. 2005). Waluda et al. (2001) suggested that about 55% of the variability in recruitment of the Falkland Island Illex argentinus fishery could be explained by variation in the total area of putative favourable-sea surface temperature (SST) areas at spawning grounds during spawning season. Variability in the abundance of Todarodes pacificus in the Sea of Japan was found to be related to changes in
*Corresponding author: Email:
[email protected]
© Inter-Research 2009 · www.int-res.com
120
Mar Ecol Prog Ser 381: 119–127, 2009
their favourable-SST areas for larval development (Sakurai et al. 2000). As a result, environmental indices are increasingly being used to predict recruitment strength in squid (Agnew et al. 2002). Tamaki (1987) reported that fishing conditions for diamond squid Thysanoteuthis rhombus in the Sea of Japan could be forecasted based on flow pattern and strength of the Tsushima Current, and water temperature on fishing grounds, but he did not clearly quantify any of these relationships. Miyahara et al. (2005) analyzed the fluctuation of T. rhombus and developed models to forecast catch per unit effort (CPUE) based on environmental factors. Fig. 2. Ommastrephes bartramii. Migration pattern of the winter-spring The neon flying squid Ommastrephes bar- cohort in the North Pacific Ocean, showing the spawning ground and feeding ground tramii is an oceanic cephalopod widely distributed in subtropical and temperate waters of The western stock of the winter-spring cohort is the main the world (Roper et al. 1984). It supports a major comtarget of the Chinese jigging fishery (Chen et al. 2007, mercial squid fishery in the northwest Pacific Ocean. 2008). This stock spawns mainly in the area between 130 Japan began the commercial fishery in 1974 after to 170° E and 20 to 30° N during January to April (Fig. 2; catches of the Japanese common squid Todarodes Bower 1996, Nagasawa et al. 1998, Yatsu et al. 1998). pacificus dropped sharply during the early 1970s; The fishing ground of the Chinese jigging fishery is in Korea and Taiwan, ROC, followed suit. In the late the area 150 to 165° E and 38 to 46° N; it operates during 1980s, with the development of a drift-netting fishery, August to November (Fig. 2; Chen et al. 2008). This is the annual catch increased rapidly. Estimated annual feeding ground of the western stock of the winter-spring catch varied from 150 000 to 350 000 t in the 1980s and cohort (Chen et al. 2008). 1990s (Bower & Ichii 2005). Mainland China started a Ommastrephes bartramii has a life span of less than small-scale commercial neon flying squid fishery in 1 yr and its life cycle is closely related to the environ1994; since then the fishery has expanded greatly. The ment of the North Pacific Ocean (Yatsu et al. 1997, annual catch continued increasing every year from 1998). Its abundance and distribution are strongly 1994 to 1999, but after 1999 the annual landing fluctuinfluenced by environmental variables such as water ated greatly from year to year (Fig. 1; Chen et al. 2008). temperature and salinity (Chen & Chiu 1999). La The North Pacific population of Ommastrephes barNiña/El Niño events have resulted in abnormal envitramii comprises 2 seasonal cohorts (autumn and winterronmental conditions that in turn influenced squid spring) and 4 stocks: (1) central stock of the autumn corecruitment (Chen et al. 2007). The early life stage of hort, (2) eastern stock of the autumn cohort, (3) western O. bartramii mainly occurs in surface waters. Paralarstock of the winter-spring cohort, and (4) central-eastern vae can be collected in surface tows both day and night stock of the winter-spring cohort (Bower & Ichii 2005). (Young & Hirota 1990, Saito 1994a,b), and they are abundant in the upper 25 m (Saito & Kubodera 1993). Therefore, surface conditions and environment are critical in determining squid recruitment success. The distribution of paralarvae suggests that they hatch in areas with SST ranging from 21 to 25°C (Hayase 1995, Saito 1994a, Bower 1996, Bower & Ichii 2005). On the feeding ground, monthly optimum SSTs for O. bartramii are 15 to 19°C, 14 to 18°C, 10 to 13°C, and 12 to 15°C for August, September, October and November, respectively (Chen 1997, 1999, Chen & Tian 2005). Previous studies of oceanographic variability influFig. 1. Ommastrephes bartramii. Total annual catch of the encing life process of squid suggested that SST is a western winter-spring cohort by the Chinese squid-jigging major factor of oceanographic variability and has sigfleet in the North Pacific Ocean from 1995 to 2004, and avernificant impacts on squid recruitment (Hayase 1995, age catch per unit effort (CPUE) in the area of 150 to 165° E, 38 to 46° N in the same period Saito 1994a, Bower 1996, Chen 1997, 1999, Chen &
Cao et al.: Influence of oceanographic variability on Ommastrephes bartramii abundance
Tian 2005, Semmens et al. 2007). However, more studies need to be done to evaluate how changes in SST influence the abundance of the western winter-spring cohort of Ommastrephes bartramii. In this study, we assume that changes of SST and other physical and climatic variables that may influence squid abundance are ultimately contained in the change of proportion of favourable-SST areas (PFSSTA). This study aims to evaluate how the abundance of western winter-spring stock of O. bartramii in the northwestern Pacific Ocean is related to surface oceanographic variability represented by PFSSTA on the spawning and feeding grounds, and to develop a fishery forecast model for predicting the fishery abundance of western winterspring stock of O. bartramii. Such a study can yield information critically important to understanding and predicting recruitment dynamics of western winterspring cohort of O. bartramii.
MATERIALS AND METHODS
121
Chen & Tian 2005). In order to understand how SST at the feeding ground influenced CPUE, we also selected PFSSTA of feeding ground as one of the environmental variables to be considered. Data on monthly SST at the spawning ground (130 to 170° E, 20 to 30° N) and feeding ground (150 to 165° E, 38 to 46° N) were obtained at the resolution of 1° latitude by 1° longitude from the Joint WMO/IOC Technical Commission for Oceanography and Marine Meteorology Products Bulletin Data Products (http://iridl. ldeo.columbia.edu/SOURCES/.IGOSS/.data_products. html 2008). We used Marine Explorer 4.0 software (Environment Simulation Laboratory) to map the monthly SST on the spawning (January to April) and feeding (August to November) grounds. The monthly PFSSTA from 1995 to 2006 was calculated based on SST ranges considered optimal for hatch and paralarvae distributions (21 to 25°C) on the spawning ground (Hayase 1995, Saito 1994a, Bower 1996) and on SST ranges considered optimal for the distribution of Ommastrephes bartramii in feeding activity on the feeding ground (15 to 19°C, 14 to 18°C, 10 to 13°C, and 12 to 15°C for August, September, October and November, respectively) (Chen 1997, 1999, Chen & Tian 2005). An example of these plots is given in Fig. 3. Forecast model and test. Inter- and intra-annual variability in PFSSTA of spawning and feeding grounds during 1995 to 2004 was examined using ANOVA. We took arcsine square-root transformation for proportional data to make data normally distributed with a constant variance. Correlation analysis was used for testing the relationship between CPUE and PFSSTA of spawning and feeding grounds during 1995 to 2004. According to the results of ANOVA and correlation analysis, we selected PFSSTA of either one of or both of the spawning and feeding grounds during 1995 to 2004 as the environmental variables in establishing a CPUE forecast model. The forecast model can be written as:
Fishery data. Data on daily catch (t), effort (days fished), and fishing locations were obtained from the Chinese commercial jigging fleet operating in the area of 150 to 165° E and 38 to 46° N. For the Chinese squidjigging fleet, this area yielded more than 80% of the total catch (Chen et al. 2008) during August to November from 1995 to 2006; most of the catch was from the western winter-spring stock of Ommastrephes bartramii, with a small amount from the autumn cohort (Chen et al. 2007, 2008). CPUE was quantified as t squid d–1, and calculated yearly from 1995 to 2006. One unit of fishing area is defined as 1° latitude by 1° longitude. Chinese jigging vessels are almost identical in fishing power, and the fishery operates at night. Bycatch is almost nonexistent (Wang & Chen 2005). Therefore, CPUE is considered to be a reliable index of stock abundance for O. bartramii because the fishing vessels are homogeneous in their characteristics and CPUEi = α0 + α1P1 + α2P2 + εi (1) operating behavior (Richards & Schnute 1986, Waluda et al. 1999, 2001, Chen et al. 2007, 2008). where CPUEi is the catch per fishing day from August Environmental data. Previous studies demonstrate to November in year i (t d–1) during 1995 to 2004, P1 that squid recruitment is mainly determined by the range of favourable-SST waters on their spawning ground (Sakurai et al. 2000, Waluda et al. 2001). Thus we selected PFSSTA of spawning ground as the environmental variable in evaluating the relationship between recruitment and environmental variability. CPUE was used as an indicator of abundance (Chen et al. 2007). SST is also an impor- Fig. 3. Ommastrephes bartramii. Example image of proportion of favourable sea tant environmental factor in affecting surface temperature areas (PFSSTA) in February 1995 at the spawning ground. Shaded area represents favourable-SST (21 to 25°C) waters squid distribution (Chen 1997, 1999,
122
Mar Ecol Prog Ser 381: 119–127, 2009
and P2 are the variables describing PFSSTA of spawning and feeding grounds, α0, α1, and α2 are model parameters to be estimated, and εi is an error term following normal distribution with mean of 0 and constant variance. We used a least-squares method to estimate model parameters. Residuals of above modeling were evaluated to ensure that the assumptions associated with the regression analysis were satisfied. The actual formulation of Eq. (1) was not determined until we completed the correlation analysis between CPUE and PFSSTA of spawning and feeding grounds. Based on the established forecast model, we estimated the predicted CPUE by applying the PFSSTA of spawning and feeding grounds in 2005 and 2006, and compared it with the corresponding CPUE observed from Chinese squid-jigging fishery.
Fig. 4. Ommastrephes bartramii. Average PFSSTA during January to April from 1995 to 2004 at the spawning ground
RESULTS Spawning ground The total area of the spawning ground (130 to 170° E, 20 to 30° N) was estimated to be 2 860 506 km2. From 1995 to 2004 the total area of PFSSTA on the spawning ground during spawning season (January to April) varied from 1 557 048 (April 1999) to 2 837 771 (January 1997) km2, corresponding to 54.4% and 99.2% of the total spawning area, respectively. The inter-annual variability in PFSSTA of spawning ground was not significant (F9,30 = 2.25, p > 0.05, ANOVA), whereas the intra-annual variability was significant (F3,36 = 8.93, p < 0.0001, ANOVA). This result indicates that the yearly change of PFSSTA was not statistically significant during the period of 1995 to 2004, but the monthly change was significant, suggesting seasonal variability was greater than annual variability in the PFSSTA of spawning ground. The average PFSSTA steadily decreased from 86.8% ± 6.47% (mean ± SD) in January to 69.8% ± 9.90% in April. Further analyses suggested that positive correlations between PFSSTA of spawning grounds and CPUE appeared in February (r = 0.48, p < 0.01) and April (r = 0.38, p < 0.05). The correlations were not significant for January (r = 0.12, p > 0.05), March (r = 0.01, p > 0.05) and the average of 4 mo (r = 0.27, p > 0.05). During the spawning season (January to April) the average PFSSTA was highest in January from 1995 to 2004; it decreased between January and April (Fig. 4).
Feeding ground The total area of feeding ground (150 to 165° E, 38 to 46° N) was estimated at 890 406 km2. The estimated
PFSSTA of feeding ground during the fishing season (August to November) from 1995 to 2004 ranged from 136 923 (October 2000) to 504 110 (June 1996) km2, corresponding to 15.3% and 56.6% of the total feeding areas, respectively. The inter-annual variability in PFSSTA of feeding ground was not significant (F9,30 = 0.89, p = 0.54, ANOVA), whereas the intra-annual variability was significant (F3,36 = 12.30, p < 0.001, ANOVA). Like the spawning ground, the inter-annual change of PFSSTA of feeding ground was not statistically significant from 1995 to 2004, but the monthly change was significant, suggesting seasonal variability was much higher than the annual variability. The average PFSSTA decreased from 39.9% ± 7.80% in August to 25.1% ± 2.36% in November. The correlation analysis showed that for from 1995 to 2004 the relationship between CPUE and PFSSTA of feeding ground was not significant for any month (r = –0.06, p > 0.05 in August; r = –0.15, p > 0.05 in September; r = 0.08, p > 0.05 in October; r = –0.37, and p > 0.05 in November). This suggests that PFSSTA during the fishing season (August to November) at the feeding ground was not significantly related to CPUE.
Regression analyses of CPUE versus SST Based on the results of ANOVA and correlation analyses, we selected PFSSTA of the spawning ground in February (the month with the highest correlation in the spawning season) and the fourth root of products of monthly PFSSTA during August to November (correlation between CPUE and PFSSTA of the feeding ground was not significant for any month during fishing season) on the feeding ground as the independent variables in Eq. (1) to evaluate how PFSSTA at the spawning and feeding grounds affected CPUE of squid. Thus,
Cao et al.: Influence of oceanographic variability on Ommastrephes bartramii abundance
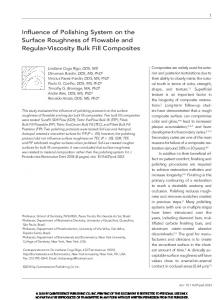
P1 and P2 in Eq. (1) were defined as the PFSSTA of February on the spawning ground, and the fourth root of products of monthly PFSSTA from August to November on the feeding ground, respectively. The fourth root of products of monthly PFSSTA from August to November on the feeding ground was selected as one of the independent variables because we found that PFSSTA of the feeding ground was not significantly related to CPUE for any single month of the fishing season and hypothesized that the combination of PFSSTAs of all months during fishing season would influence CPUE. The resultant empirical model was significant (p < 0.05), suggesting that CPUE was positively and significantly correlated with PFSSTA of the spawning ground in February. The parameter α1 associated with PFSSTA in February in the model had a larger value and was more significant than parameter α2 associated with PFSSTA on the feeding ground (Table 1). This indicates that PFSSTA of the spawning ground in February has a greater impact on squid recruitment than that of the feeding ground. The regression analysis suggested that there was a significant and positive relationship between CPUE and PFSSTA of the spawning ground in February. Thus in February, when PFSSTA was large, squid were abundant in the fishery, except in 1995 (Fig. 5; p < 0.05). Examples of SST images showing the distribution of favourable-SST areas on the spawning ground are given in Fig. 6, in which a high PFSSTA corresponded to a high abundance of squid in February 2004 (Fig. 6a). An intermediate PFSSTA corresponded to an average abundance in February 1997 (Fig. 6b) and a low PFSSTA corresponded to a low abundance in February 2001 (Fig. 6c). A significant and negative correlation between CPUE and the fourth root of products of PFSSTA of the feeding ground from August to November suggested that the overall PFSSTA during the fishing season (August to November) on the feeding ground was important in determining CPUE.
Table 1. Ommastrephes bartramii. Regression model between proportion of favourable-sea surface temperature areas (PFSSTA) and catch per unit effort (CPUE) Model
95% CI
p
CPUE = α0 + α1P1 – α2P2 α0 = –9.5350 –18.8267 to –0.2433 0.045 α1 = 20.0663 5.2710 to 34.8616 0.014 α2 = –12.7812 –24.8188 to –0.7436 0.040 P1 = PFSSTA of February on spawning ground P2 = 4th root of continued product of PFSSTA from Aug–Nov Multiple = 0.77, R2 = 0.60, Residual SD = 4.3426, F = 5.1627, Significance F = 0.0419
123
Fig. 5. Ommastrephes bartramii. Plot of February PFSSTA at the spawning ground against CPUE from 1995 to 2004
Test of forecast model In order to evaluate the performance of our forecast model, we used actual fishery CPUE data in 2005 and 2006 from Chinese squid-jigging fleets to compare with the CPUE predicted from the forecast model. We used bootstrap to calculate the total variance (σ2) and predicted confidence intervals based on samples collected from 1995 to 2004. Results indicate that the actual CPUEs in 2005 and 2006 were all within the confidence intervals of predicted CPUEs (Table 2).
DISCUSSION The significant regression model identified between the CPUE and environmental variables indicates that PFSSTA is important for explaining the variability in CPUE at both spawning and feeding grounds. This result is consistent with our hypothesis that CPUE is likely to be influenced by recruitment, represented by PFSSTA, at the spawning ground and squid distribution, represented by PFSSTA, at the feeding ground; this is also consistent with other similar studies. Waluda et al. (2001) examined the inter-annual variability in mesoscale oceanographic conditions in terms of the area occupied by frontal waters and by waters of favourable SST at inferred hatching area of winterspawned Illex argentinus, and found that high squid abundance was associated with a higher proportion of favourable-SST waters or a lower proportion of frontal waters. However, he did not examine the conditions in the fishing ground during fishing season, which might influence CPUE as well. Additionally, we found that variability in recruitment was determined by PFSSTA at the spawning ground in February, which month had
124
Mar Ecol Prog Ser 381: 119–127, 2009
conditions on the spawning grounds, whereas an El Niño event would lead to environmental conditions favourable to squid recruitment (Chen et al. 2007). From 1995 to 2004, La Niña events occurred 3 times on the spawning ground, in February 1999, 2000 and 2001 (Chen et al. 2007). It is noted that PFSSTA on the spawning ground of these 3 yr were the lowest during the 1995 to 2005 study period (Fig. 5). An El Niño event on the spawning ground in February corresponded to a high PFSSTA in 2003 (Fig. 5; Chen et al. 2007). Therefore, we believe La Niña/El Niño events or ENSO influence squid recruitment mainly by changing PFSSTA on the spawning ground in February. Additionally, PFSSTA on the spawning grounds representing favourable conditions for squid recruitment may also be related to the strength and distribution of North Equatorial Current (NEC) and Kuroshio Current (Chen et al. 2007). When the NEC was strong and bifurcation of the NEC was strongly deflected north between 130° E and 170° E, the 25°C isotherm on Fig. 6. Ommastrephes bartramii. Intra-annual variability in PFSSTA at the spawning ground: (a) high PFSSTA (Feb. 2004); (b) intermediate PFSSTA the spawning ground would be corre(Feb. 1997); and (c) low PFSSTA (Feb. 2001). Shaded areas represent spondingly deflected north and PFSSTA favourable-SST (21–25°) waters would be lower (Fig. 7a). On the other hand, almost the whole of the southern the second-highest average PFSSTA during the spawning ground features favourable SST (Fig. 7b). spawning season (Fig. 4). Therefore we suggest based When the Kuroshio Current is strong, it forms a V-like on this study that February may be the peak time of path between 135 and 140°E, the 21°C isotherm on the hatching for Ommastrephes bartramii. northwest spawning ground tends to be deflected furSeasonal change can lead to significant changes in ther south, and the northwest area of spawning ground SST in spawning and fishing areas, which also can cause is controlled by less favourable-SST waters (Fig. 7b). squid to do a south-north seasonal migration. However, Conversely, the PFSSTA is higher on the northwest the inter-annual variability in PFSSTA on the spawning spawning ground (Fig. 7a). We have extreme environground may be driven by climate changes and some ments for squid recruitment, the most favourable large-scale oceanographic processes (O’Dor & Balch (Fig. 7a) and unfavourable conditions (Fig. 7b) on the 1985). A La Niña event would result in a decrease in spawning ground. The above discussion covers possible squid recruitment through variability in environmental scenarios which can be used to explain the changes of PFSSTA. The interaction of these environmental factors and their influence on the PFSSTA require further study. Table 2. Ommastrephes bartramii. Results of model test In the absence of data on the abundance of paralarfor predicting fishery catch per unit effort (CPUE) in 2005 vae in this study, we could not directly set up a predicand 2006 tive model between variability in marine environment condition and squid recruitment. Instead, CPUE was Variables 2005 2006 used to reflect interannual variability in abundance of Ommastrephes bartramii (Chen et al. 2007). However, P1 (%) 89.29 81.37 P2 (%) 31.10 35.72 because O. bartramii lives less than 1 yr, abundance Actual CPUE (t d–1) 4.82 1.95 was only determined by the recruitment of current σ2 0.2038 0.2038 year. Thus, we can use CPUE as a surrogate for squid –1 Predicted CPUE (t d ) 4.41 2.23 –1 recruitment in this study. The same approach has been Confidence intervals (t d ) (4.00, 4.83) (1.94, 2.35) used for other short-lived species. For example para-
Cao et al.: Influence of oceanographic variability on Ommastrephes bartramii abundance
125
the study of early O. bartramii’s early life stage, and the development of models for quantifying impacts of environmental and oceanographic variability on the early life stage of squid. Ommastrephes bartramii are mainly distributed in the area with favourable-SST waters on the feeding ground (Chen et al. 2007); we consider that the oceanographic structure of the feeding ground plays a key role in the process. The feeding ground of O. bartramii is a transition area formed by the warm Kuroshio Current and cold Oyashio Current (Roden 1991). The dynamics of physical structures in this region, including meandering eddies and frontal zones, yield a highly productive habitat that serves as a feeding ground for various commercially important species, including O. bartramii (Zainuddin et al. 2006). On the feeding ground, O. bartramii prefer to aggregate in favourable-SST frontal areas (Wang & Chen 2005) because frontal zones may supply more food. For that reason the mechanism for O. bartramii gathering in favourable-SST frontal areas and the roles of different environmental variables in this favourable-SST ranges need to be identified in future studies. Additionally, in this study, since the migration route of Ommastrephes bartramii was not Fig. 7. Ommastrephes bartramii. Extreme environmental conditions for well known, we did not examine the environrecruitment at the spawning ground: (a) most favourable conditions mental variability in migration process of O. (widest possible area of favourable-SST); and (b) least favourable condibartramii, which might influence abundance. tions (least possible area of favourable-SST) However, based on our study we considered that when the Kuroshio Current meanders considerably, mortality of O. bartramii increases durlarval density index (PDI) as an index of recruitment ing migration. In 1995 the proportion of optimum-SST was strongly correlated with CPUE in Todarodes pacificus cohorts, and PDI was also used to reflect the stock waters of February (Fig. 4) on the spawning ground abundance of T. pacificus (Sakurai et al. 2000). Rewas highest in the 10 yr study period, but CPUE in the cruitment strength was also used to forecast the population abundance of Illex argentinus (Laptikhovsky et al. 2001). According to this study, CPUE may also be affected by PFSSTA on the feeding ground in addition to recruitment. The distribution of CPUEs was mainly in favourable-SST areas on the feeding ground from August to November according to this study (Fig. 8). With the decreased PFSSTAs of August to November the distribution of Ommastrephes bartramii tended to be more aggregated, resulting in many more fishing boats locating in favourable-SST areas on the feeding ground. This increased the CPUE of Chinese squid-jigging fishery. In the future we need to directly forecast recruitment based on environmental variability using survey data from paralarvae and young squid on the Fig. 8. Ommastrephes bartramii. Distribution of favourableSST waters and CPUE on the feeding ground August 2001 spawning ground. Future work should also focus on
Mar Ecol Prog Ser 381: 119–127, 2009
126
on the Western Winter-Spring Cohort of Neon Flying same year was low. We evaluated the monthly distribSquid (Ommastrephes bartarmii) in the northwestern ution of Kuroshio Current during 1995 to 2004 and Pacific Ocean. ICES J Mar Sci 64:1152–1160 found that in 1995 the Kuroshio followed a V-like path Chen XJ, Liu BL, Chen Y (2008) A review of the development ➤ during the migration period. Previous studies also of Chinese distant-water squid jigging fisheries. Fish Res showed that a V-like path of Kuroshio resulted in a low 89:211–221 Hayase S (1995) Distribution of spawning grounds of flying CPUE of the same year (Shao et al. 2005). squid, Ommastrephes bartramii, in the North Pacific To develop more powerful predictive models for Ocean. Jpn Agric Res Q 29:65–72 recruitment in future we should consider more comLaptikhovsky VV, Remeslo AV, Nigmatullin CHM, Polishchuk prehensive processes of squid life history, which may IA (2001) Recruitment strength forecasting of the shortfin squid Illex argentinus (Cephalopoda: Ommastrephidae) be significantly influenced by environmental variusing satellite SST data, and some consideration of the speables. Such a study can help us to better develop precies’ population structure. ICES CM K15:1–9 dictive models for squid recruitment.
Acknowledgements. We thank the Shanghai Ocean University for providing the CPUE data, and IRI/LDEO Climate Data Library of Columbia University for providing the environmental data. This study is supported by the Program for New Century Excellent Talents in University (NCET-06-0437), National Science and Technology Program (2006BAD09A05), National Natural Science Foundation (NSFC40876090) and Shanghai Leading Academic Discipline Project (Project S30702). We would like to thank 2 anonymous reviewers for their constructive comments.
LITERATURE CITED
➤
➤ Agnew DJ, Beddington JR, Hill SL (2002) The potential use of ➤ ➤
➤
environmental information to manage squid stocks. Can J Fish Aquat Sci 59:1851–1857 Anderson CIH, Rodhouse PG (2001) Life cycles, oceanography and variability: ommastrephid squid in variable oceanographic environments. Fish Res 54:133–143 Bazzino G, Quinones RA, Norbis W (2005) Environmental associations of shortfin squid Illex argentinus (Cephalopoda: Ommastrephidae) on the northern Patagonian Shelf. Fish Res 76:401–416 Bower JR (1996) Estimated paralarval drift and inferred hatching sites for Ommastrephes bartramii (Cephalopoda: Ommastrephidae) near the Hawaiian Archipelago. Fish Bull US 94:398–411 Bower JR, Ichii T (2005) The red flying squid (Ommastrephes bartramii): a review of recent research and the fishery in Japan. Fish Res 76:39–55 Boyle PR (1987) Comparative reviews. In: Boyle PR (eds) Cephalopod life cycles. Academic Press, London Chen XJ (1997) An analysis on marine environment factors of fishing ground of Ommastrephes bartramii in northwest Pacific. J Shanghai Fish Univ 6:285–287 (in Chinese) Chen XJ (1999) Study on the formation of fishing grounds of the large squid, Ommastrephes bartramii in the waters 160° E –170° E North Pacific Ocean. J Shanghai Fish Univ 8:197–201 (in Chinese) Chen CS, Chiu TS (1999) Abundance and spatial variation of Ommastrephes bartramii (Mollusca: Cephalopoda) in the eastern North Pacific observed from an exploratory survey. Acta Zool Taiwanica 10:135–144 (in Chinese) Chen XJ, Tian SQ (2005) Study on the catch distribution and relationship between fishing grounds and surface temperature for Ommastrephes bartramii in the northwestern Pacific Ocean. Periodical of Ocean University of China 35: 101–107 (in Chinese) Chen XJ, Zhao XH, Chen Y (2007) El Niño/La Niña Influence
➤
➤
➤
Miyahara K, Ota T, Kohno N, Ueta Y, Bower JR (2005) Catch fluctuations of the diamond squid Thysanoteuthis rhombus in the Sea of Japan and models to forecast CPUE based on analysis of environmental factors. Fish Res 72: 71–79 Nagasawa K, Mori J, Okamura H (1998) Parasites as biological tags of stocks of neon flying squid (Ommastrephes bartramii) in the North Pacific Ocean. In: Okutani T (ed) Contributed papers to International Symposium on Large Pelagic Squids. Japan Marine Fishery Resources Research Center, Tokyo, p 49–64 O’Dor RK, Balch N (1985) Properties of Illex illecebrosus egg mass potentially influencing larval oceanographic distribution. NW Atlant Fish Org (NAFO) Scient Coun Stud 9: 69–76 Richards LJ, Schnute JT (1986) An experimental and statistical approach to the question: is CPUE an index of abundance. Can J Fish Aquat Sci 43:1214–1227 Roberts MJ (1998) The influence of the environment of chokka squid Loligo vulgaris reynaudii spawning aggregations: steps towards a quantified model. S Afr J Mar Sci 20:267–284 Roden GI (1991) Subarctic-subtropical transition zone of the North Pacific: large- scale aspects and mesoscale structure. In: Wetherall JA (ed) Biology, oceanography and fisheries of the North Pacific transition zone and Subarctic frontal zone. NOAA Tech Rep 105:125 Rodhouse PG (2001) Managing and forecasting squid fisheries in variable environments. Fish Res 54:3–8 Roper CFE, Sweeney MJ, Nauen CE (1984) FAO species catalogue: an annotated and illustrated catalogue of species of interest to fisheries. In: Cephalopods of the World 3. FAO Fisheries Synopsis, p 125–277 Saito K (1994a) Distribution of paralarvae of Ommastrephes bartramii and Eucleoteuthis luminosa in the eastern waters off Ogasawara Islands. Bull Hokkaido Natl Fish Res Inst 58:15–23 (in Japanese with English abstract) Saito K (1994b) A sampling method for rhynchoteuthion paralarvae of neon flying squid Ommastrephes bartramii. Bull Hokkaido Natl Fish Res Inst 58:25–34 (in Japanese with English abstract) Saito H, Kubodera T (1993) Distribution of ommastrephid rhynchoteuthion paralarvae (Mollusca, Cephalopoda) in the Kuroshio Region. In: Okutani T, O’Dor RK, Kubodera T (eds) Recent advances in cephalopod fisheries biology. Tokai University Press, Tokyo, p 457–466 Sakurai Y, Kiyofuji H, Saitoh S, Goto T, Hiyama Y (2000) Changes in inferred spawning sites of Todarodes pacificus (Cephalopada: Ommastrephidae) due to changing environmental conditions. ICES J Mar Sci 57:24–30 Semmens JM, Leporati S, Shaw PW, Pecl GT and others (2007) Approaches to resolving cephalopod movement and migration patterns. Rev Fish Biol Fish 17:401–423
Cao et al.: Influence of oceanographic variability on Ommastrephes bartramii abundance
➤
➤
➤
Shao QQ, Ma WW, Chen ZQ, You ZM, Wang WY (2005) Relationship between Kuroshio meander pattern and Ommastrephes bartramii CPUE in the North Pacific Ocean. Oceanol Limnol Sin 36:111–122 Tamaki T (1987) Fishing condition of Thysanoteuthis rhombus in the Tajima region in 1985. Contr Fish Res Jpn Sea Block 9:99–104 (in Japanese) Wadley VA, Lu CC (1983) Distribution of mesopelagic cephalopods around a warm-core ring in the East Australian Current. Memoirs Natl Museum Victoria 44: 197–198 Waluda CM, Trathan PN, Rodhouse PG (1999) Influence of oceanographic variability on recruitment in the genus Illex argentinus (Cephalopoda: Ommastrephidae) fishery in the South Atlantic. Mar Ecol Prog Ser 183:159–167 Waluda CM, Rodhouse PG, Podesta GP, Trathan PN, Pierce GJ (2001) Surface oceanography of inferred hatching grounds of Illex argentinus(Cephalopoda: Ommastrephidae) and influences on recruitment variability. Mar Biol 139:671–679 Waluda CM, Yamashiro C, Rodhouse PG (2006) Influence of ENSO cycle on the light-fishery for Dosidicus gigas in the Peru Current: an analysis of remotely sensed data. Fish Res 79:56–63 Editorial responsibility: Hans Heinrich Janssen, Oldendorf/Luhe, Germany
➤
➤
➤
127
Wang YG, Chen XJ (2005) Ommastrephes bartramii In: Chen SS (ed) The resource and biology of economic oceanic squid in the world. Ocean Press, Beijing, p 79–295 Yatsu A, Midorikawa S, Shimada T, Uozumi Y (1997) Age and growth of the neon flying squid, Ommastrephes bartramii, in the North Pacific Ocean. Fish Res 29:257–270 Yatsu A, Tanaka H, Mori J (1998) Population structure of the neon flying squid, Ommastrephes bartramii, in the North Pacific. In: Okutani T (ed) Contributed papers to International Symposium on Large Pelagic Squids. Japan Marine Fishery Resources Research Center, Tokyo, p 31–48 Yatsu A, Watanabe T, Mori J, Nagasawa K and others (2000) Interannual variability in stock abundance of the neon flying squid, Ommastrephes bartramii, in the North Pacific Ocean during 1979–1998: impact of driftnet fishing and oceanographic conditions. Fish Oceanogr 9:163–170 Young RE, Hirota J (1990) Description of Ommastrephes bartramii (Cephalopoda: Ommastrephidae) paralarvae with evidence for spawning in Hawaiian waters. Pac Sci 44: 71–80 Zainuddin M, Kiyofuji H, Saitoh K, Saitoh S (2006) Using multisensor satellite remote sensing and catch data to detect ocean hot spots for albacore (Thunnus alalunga) in the northwestern North Pacific. Deep Sea Res II 53:419–431 Submitted: September 2, 2008; Accepted: February 11, 2009 Proofs received from author(s): April 4, 2009