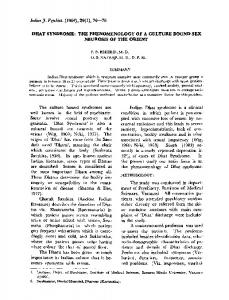
Figure 1 is ostensibly that Toyota has the highest profit among the car manufac- turers listed. Although much research has addressed the retrieval of documents,.
Infographics Retrieval: A New Methodology Zhuo Li, Sandra Carberry, Hui Fang*, Kathleen F. McCoy, and Kelly Peterson Department of Computer and Information Science, *Department of Electrical and Computer Engineering, University of Delaware Abstract. Information graphics, such as bar charts and line graphs, are a rich knowledge source that should be accessible to users. However, techniques that have been effective for document or image retrieval are inadequate for the retrieval of such graphics. We present and evaluate a new methodology that hypothesizes information needs from user queries and retrieves infographics based on how well the inherent structure and intended message of the graphics satisfy the query information needs. Keywords: Graph retrieval; natural language query processing
1
Introduction
Information graphics (infographics), such as the one in Figure 1, are effective visual representations of complex information. Moreover, the overwhelming majority of information graphics from popular media appear to be designed to convey an intended message. For example, the intended message of the graphic in Figure 1 is ostensibly that Toyota has the highest profit among the car manufacturers listed. Although much research has addressed the retrieval of documents, very little attention has been given to the retrieval of infographics. But infographics are an important knowledge resource that should be accessible from a digital library. Suppose that one is writing a government report about the success of Japanese car companies and poses the following query: Q1 : “How does the net profit of Toyota compare to other car manufacturers?” A graphic satisfying this information need would presumably depict net profit on the dependent axis and Toyota along with other car manufacturers on the independent axis; in addition, the graphic would compare Toyota’s net profit against those of the other car manufacturers. The infographic in Figure 1, which appeared in zmetro.com, is such a graphic. When Q1 was entered into major commercial image search engines, none of the highest ranked graphics were comparing car manufacturers according to their net profit, and thus they would not satisfy the query’s information need. Techniques that have been effective for document or image retrieval are inadequate for the retrieval of information graphics. Current search engines employ strategies similar to those used in document retrieval, relying primarily on the text surrounding a graphic and web link structures. But the text in the surrounding document generally does not refer explicitly to the infographic or even
2
Zhuo Li, Sandra Carberry, Hui Fang, Kathleen F. McCoy, Kelly Peterson
Fig. 1: An Example Infographic
describe its content [5]. An obvious extension would be to collect all the words in an infographic and use it as a bag of words. However, the text in graphics is typically sparse and we will show that this approach is insufficient. Content-based image retrieval (CBIR) has focused on extracting visual features or retrieving images that are similar to a user specified query image. Although CBIR can find bar charts and line graphs, a user with an information need is not just, if at all, seeking visually similar graphics. Moreover, since images are free-form with relatively little inherent structure, it is extremely difficult to determine what is conveyed by an image, other than to list the image’s constituent pieces. Infographics, on the other hand, have structure: the independent axis depicts a set of entities (perhaps ordinal entities in the case of a line graph) and the dependent axis measures some criteria for each entity. In addition, the graphic designer constructs the graphic using well-known communicative signals (such as coloring an entity in the graphic differently from other entities) to convey an intended message. Current retrieval mechanisms, both those used for document retrieval and those used for image retrieval, have ignored a graphic’s structure and message, and thus have been ineffective in retrieving infographics. We propose a novel methodology for retrieving infographics in response to a user query. Our approach analyzes the user query to hypothesize the desired content of the independent and dependent axes of relevant infographics and the high-level message that a relevant infographic should convey. It then ranks candidate graphics using a mixture model that takes into account the textual content of the graphic, the relevance of its axes to the structural content requested in the user query, and the relevance of the graphic’s intended message to the information need (such as a comparison) identified from the user’s query. We currently focus on static simple bar charts and line graphs; in the future, our methodology will be extended to more complex infographics. This paper presents our new methodology for retrieving infographics, together with experiments which validate our approach. Section 2 outlines the problem in more detail. Section 3 presents our methodology and describes how relevance of each graphic component to a user query is measured. Section 4 presents experimental results showing the significant improvement our methodology makes over a baseline approach that uses simple text retrieval techniques.
Infographics Retrieval: a New Methodology
2
3
Problem Formulation
Our research is currently limited to two kinds of infographics, simple bar charts and single line graphs that convey a two dimensional relationship between the independent axis and the dependent axis, which we will refer to respectively as x-axis and y-axis. Let an infographic be G. Given a digital library D of such infographics, we will present a ranking methodology for all G∈D according to the relevance of each graphic G to a query Q, denoted R(Q, G). We assume that in our digital library, each infographic G is stored with its original image together with an XML representation specifying the structural components of the graphic as described in Section 2.1 and the message components of the graphic as described in Section 2.2. This paper is not concerned with the computer vision problem of parsing a graph to recognize its bars, labels, colors, text, etc.; other efforts, such as the work in [6, 13], are addressing the processing of electronic images such as bar charts and line graphs. 2.1
Structural Content of Infographics
Our approach takes into account three structural components of each infographic G: 1) text that appears in a graphic’s caption or sub-caption, denoted Gc ; 2) the content of the independent axis (referred to as x-axis), denoted as Gx , consisting of the labels on the x-axis, such as the names of the car manufacturers in Figure 1; 3)the content of the dependent axis (referred to as y-axis), denoted as Gy . Determining Gy is not straightforward. Infographics often do not explicitly label the y-axis with what is being measured. For example, net profit is being measured on the y-axis in Figure 1 but the y-axis itself is unlabeled. Previous work on our project developed a system that utilized a set of heuristics to extract information from other graph components and meld them together to form a y-axis descriptor [9]. We assume that the XML representation of each infographic in our digital library contains all three structural components, GStruct = {Gx , Gy , Gc }. 2.2
Message Content of Infographics
Infographics in popular media generally have a high-level message GIM that they are intended to convey. For example, Figure 1 conveys a message in the Max category, namely Toyota has the highest net profit among the listed car manufacturers. Previous work on our project [10, 27] identified a set of 17 categories of intended messages that could be conveyed by simple bar charts and line graphs. For example, a Rank message conveys the rank of an entity with respect to some criteria (such as profit) whereas a Relative-Difference message compares two specific entities. The entity being ranked or the entities being compared are referred to as focused entities Gf x since the graphic is focused on them. Both studies [10, 27] identified communicative signals that appear in graphics and help to convey the graphic’s intended message. For example, salience of an entity in a graphic might be conveyed by coloring the bar differently from other bars (such as the bar for Toyota in Figure 1), thereby suggesting that it plays a significant role in the graphic’s high-level message. These communicative signals were entered as evidence in a Bayesian network that hypothesized the graphic’s
4
Zhuo Li, Sandra Carberry, Hui Fang, Kathleen F. McCoy, Kelly Peterson
intended message, both the category of intended message (such as Rank) and any focused entities that serve as parameters of the message. We assume that each infographic G in our digital library is stored along with its message components, Gmsg = {GIM , Gf x }, its structural components Gstruct = {Gx , Gy , Gc }, and a bag of words Gt of all the words in graphic G.
3
Retrieval Methodology
Given a query, our retrieval methodology first analyzes the query to identify the requisite characteristics of infographics that will best satisfy the user’s information need. Then the infographics in our digital library are rank-ordered according to how well they satisfy this information need as hypothesized from the user’s query. Section 3.1 discusses the analysis of user queries, Section 3.2 discusses the fast preselection of a set of candidate infographics and Section 3.3 discusses the rank-ordering of infographics in response to a user query. 3.1
Natural Language Query Processing
Our vision is that since the graphics have structure, the users whose particular information needs could be satisfied by infographics will formulate their queries to indicate the requisite structure of the desired graphics. Thus our methodology uses full-sentence user queries so that the semantics of the query can be analyzed to identify characteristics of relevant graphics. Consider the following two queries which contain similar keywords but represent different information needs: Q2 : Which Asian countries have the most endangered animals? Q3 : Which endangered animals are found in the most Asian countries? Both queries request graphics that convey the entities that have the largest value with respect to what is measured on the y-axis. However, query Q2 is asking for an infographic comparing Asian countries on the x-axis according to their number of endangered animals on the y-axis, while query Q3 is asking for a comparison of different endangered animals on the x-axis according to the number of Asian countries in which they reside on the y-axis. Our methodology utilizes our previous work that extracted clues from a query Q and used these clues as attributes in a learned model that hypothesized from Q the requisite content Qx of the x-axis, the requisite content Qy of the y-axis, and the noun words that do not belong on any of these axes Qn [19, 20]. Our retrieval methodology treats these axes contents separately instead of treating a query as a bag of words, thereby recognizing the difference between queries such as Q2 and Q3 . Similarly, consider the query: Q4 :How does the number of doctor visits per year change with a person’s age? Although both graphics in Figure 2 contain the same data, that is, a person’s age on the x-axis and the number of doctor visits on the y-axis, the changing trend in doctor visits (as requested by the query) is more discernible from the graphic on the left than from the graphic on the right which ranks age ranges
Infographics Retrieval: a New Methodology
5
Fig. 2: Graphics Displaying the Same Data with Different Messages
in terms of number of doctor visits. This correlates with Larkin and Simon’s observation [18] that graphics may be informationally equivalent (that is, they contain the same information) but not computationally equivalent (that is, it may be more difficult to perceive the information from one graphic than from the other). The model developed in our previous work [19] also processed a user query to identify the preferred category of intended message QIM and the focused entity Qf x (if any) of relevant infographics. In this paper, we process each user query Q using the learned models from our previous work [19, 20] in order to 1) extract all of the query components that convey structural information, Qstruct = {Qx , Qy , Qn }, and 2) identify the requisite message information that should be conveyed by the desired graphic Qmsg = {QIM , Qf x }. In addition, we form a bag of words Qt consisting of all words in query Q. 3.2
Infographics Preselection
As a first step for speeding-up infographic retrieval in a large digital library, we first preselect a subset of infographics that are loosely relevant to the words in a given user query. However, the words in a user query may differ from those appearing in a relevant graphic, especially since a graphic’s text is typically sparse. Query expansion is a commonly used strategy in IR to improve retrieval performance [1, 11, 22] since it is effective in bridging the vocabulary gap between terms in a query and those in the documents. The basic idea is to expand the original query with semantically similar terms other than those explicitly given in the original query. But infographic retrieval presents an additional problem. Consider a query such as Which car manufacturer has the highest net profit?. An infographic such as the one shown in Figure 1 displays a set of car manufacturers on the independent axis (Toyota, Nissan, Honda, etc..) but nowhere in the graphic does the term car or a synonym appear. Identifying the ontological categories, such as car or automobile, of these labels is crucial for infographics retrieval since the user query often generalizes the entities on the independent axis rather than listing them. To tackle the sparsity problem, before storing a graphic in the digital library, we expand the text in the graphic using Wikimantic[4], a term expansion method that uses Wikipedia articles as topic concepts. Given a sequence s of the text in a graphic, Wikimantic extracts all Wikipedia articles and disambiguation articles
6
Zhuo Li, Sandra Carberry, Hui Fang, Kathleen F. McCoy, Kelly Peterson
whose titles contain a subsequence of s; each of these articles is viewed as a Wikimantic concept and is weighted by the likelihood that the concept generates sequence s. Wikimantic then builds a unigram distribution for words from the articles representing these weighted concepts. By expanding graph entities such as Toyota, Nissan, Honda, and GM through Wikimantic, words such as car or automobile are part of the produced unigram distribution — that is, as a side effect, the ontological category of the individual entities becomes part of the term expansion. This expansion of the graphic components (as opposed to the typical expansion of the query) accomplishes two objectives: 1) it addresses the problem of sparse graphic text by adding semantically similar words, and 2) it addresses the problem of terms in the query capturing general classes (such as car or automobile) when the graphic instead contains an enumeration of members of that general class. If the expanded text of an infographic contains at least one of the query noun words, this infographic is preselected for further rank-ordering. 3.3
Methodology for Rank-ordering Infographics
After preselecting a candidate pool P of infographics for a given query Q, our methodology measures the relevance R(Q, G) of Q to each infographic G ∈ P . Our hypothesis is that graph retrieval should take into account the relevance of the structural and message components of an infographic to the requirements conveyed by the user’s query. We consider the following relevance measurements, as depicted in Figure 3: – X Axis Relevance R(Qx , Gx ): relevance of the graphic’s x-axis content Gx to the requisite x-axis content Qx extracted from the user’s query. – Y Axis Relevance R(Qy , Gy ): relevance of the graphic’s y-axis content Gy to the requisite y-axis content Qy extracted from the user’s query. – Intended Message Category Relevance R(QIM , GIM ): relevance of the category of intended message GIM of the infographic to the category of intended message QIM preferred by the query. – Intended Message Focused Entity Relevance R(Qf x , Gf x ) and R(Qf x , Gnx ): relevance of the graphic’s focused entity Gf x (if any) to the focused entity Qf x (if any) extracted from the user’s query. In cases where Qf x appears on the x-axis of a graphic but is not focused, such graphics may address the user’s information need, though less so than if the graphic also focused on Qf x . Therefore we also measure the relevance of the non-focused x-axis entities Gnx ∈ Gx to the query focused entity Qf x as R(Qf x , Gnx ). We consider three mixture models which respectively capture structural relevance, message relevance, and both structural and message relevance. Since the results of query processing are not always correct, we add to each model a back-off relevance measurement R(Qt , Gt ) which measures the relevance of all the words in the query to all the words in a candidate infographic. In addition, we include a baseline model that treats the words in the graphic and the words in the query as two bags of words and measures their relevance to one another.
Infographics Retrieval: a New Methodology
7
Fig. 3: Relevance Measurements for Component Approaches
Baseline-Model (bags of words): relevance of the bag of words in the query to the bag of words in a graphic, calculated by the following equation: Rbaseline (Q, G) = R(Qt , Gt )
(1)
Model-1 (structural components): relevance of the structural components (the x-axis and the y-axis) computed by the following function: R1 (Q, G) = ω0 · R(Qt , Gt ) + ω1 · R(Qx , Gx ) + ω2 · R(Qy , Gy )
(2)
Model-2 (message components): relevance of intended message components (message category and message focused entity, if any) computed by the following function: R2 (Q, G) = ω0 · R(Qt , Gt ) + ω3 · R(QIM , GIM ) (3) +ω4 · R(Qf x , Gf x ) + ω5 · R(Qf x , Gnx ) Model-3 (both structural and message components): relevance of both structural and intended message components, computed by the following equation: R3 (Q, G) = ω0 · R(Qt , Gt ) + ω1 · R(Qx , Gx ) + ω2 · R(Qy , Gy ) +ω3 · R(QIM , GIM ) + ω4 · R(Qf x , Gf x ) + ω5 · R(Qf x , Gnx )
(4)
The weighting parameters, ωi , are learned using multi-start hill climbing to find a set of parameters that yields a local maximal retrieval evaluation metric. Such hill-climbing search has been used successfully to learn parameters in other problems where the available dataset is small [23]. The next subsections discuss how relevance is measured for each of the terms in the above relevance equations. 3.4
Measuring Textual Relevance
The relevance between the words from the query and words from the graphic, such as R(Gt , Qt ), R(Gx , Qx ), R(Gy , Qy ), and R(Gf x , Qf x ), are textual relevances, measured by relevance function Rtext . We use a modified version of
8
Zhuo Li, Sandra Carberry, Hui Fang, Kathleen F. McCoy, Kelly Peterson
Okapi-BM25 [12] for measuring textual relevance Rtext : Rtext (Qc , Gc0 ) =
X wi ∈Qc
log(
|D| + 1 tfi · (1 + k1 ) )· gfi + 1 tfi + k1
where Qc is a query component and Gc0 is a graphic component, |D| is the total size of our graphic collection, gfi is the number of graphics that contain the word wi , tfi is the term frequency of wi in Gc0 , and k1 is a parameter that is set to 1.2, a widely used value. This version of Okapi-BM25 has replaced the original inverse document frequency in Okapi with the regular inverse document frequency (idf = log( |D|+1 gfi +1 )) to address the problem of negative idf . Our version of Okapi also does not take graphic text length into consideration, since text in graphics usually have similar limited length; moreover, a graph component, such as the message focused entity or the dependent (y) axis, only consists of a noun entity and therefore normalizing the length of such a component does not have the same affect as for documents. Our version of Okapi also does not take query term frequency into consideration, since most terms in the query occur only once. 3.5
Intended Message Relevance Measurement
Intended message relevance measures the relevance of the category of the intended message (such as Rank) along with the message focused entity of a query to those of an infographic. For measuring the intended message category relevance RIM , we condense the message categories in [10] and [27] into seven general categories of intended messages extracted from user queries: – Trend messages: convey a trend over some ordinal entity. Note that while a graphic might convey a rising trend, a query would be much more likely merely to request the trend of some entity since the user would not know a priori whether the trend is rising, falling, or stable. – Rank: convey the rank of a specific entity with respect to other entities. – Min: convey the entity that has the smallest value with respect to other entities. – Max: convey the entity that has the largest value with respect to other entities. – Rank-all: convey the relative rank of a set of entities – Rel-Diff: convey the relative difference between two entities – General: convey no specific message and just display data We abstract a concept hierarchy containing the seven general intended message categories, as shown in Figure 4. Our methodology uses relaxation as the paradigm for ranking infographics according to how well an infographic’s category of intended message GIM satisfies the requisite intended message QIM extracted from the user query. A six degree relevance measurement for RIM is computed based on this hierarchy. When GIM matches QIM , little perceptual effort is required for the user
Infographics Retrieval: a New Methodology
9
Ge n e r a l Co mp a r i s o n Re l a t i v e Di f f e r e n c e
Tr e n d
Ra n kAl l Mi n
Ma x Ra n k
Fig. 4: Intended Message Category Similarity
to get the message information he or she wants; this infographic is deemed fully relevant to the query in terms of message relevance. However, when GIM differs from QIM , the amount of perceptual effort that the user must expend to satisfy his information need depends on GIM . By moving up or down the intended message hierarchy from QIM → GIM , QIM is relaxed to match different GIM with different degrees of penalties for the relaxation. The greater the amount of relaxation involved, the less message-relevant the infographic is to the query, and the more points penalized for message relevance. At the top of the hierarchy is the General intended message category, which captures the least information message-wise. Message categories lower in the hierarchy contain more specific information. When QIM is lower in the hierarchy than GIM , QIM requires more specific information than provided by GIM . By up relaxing QIM −→ GIM , perceptual effort is needed for the user to get the desired information; this infographic will be penalized for not having specific enough information. For example, consider two graphics, one whose intended message is the Rank of France with respect to other European countries in terms of cultural opportunities (and thus France is highlighted or salient in the graphic) and a second graphic whose intended message is just a ranking (category Rankall) of all European countries in terms of cultural opportunities. If the user’s query requests the rank of France with respect to other countries, then the first graphic matches the user’s information need whereas the second graphic requires up a relaxation of message category from (QIM = Rank) −→ (GIM = Rank-all); in this latter case, user effort is required to search for France among the countries listed and thus the second infographic is penalized for message relevance. Limited space prevents further detail about the relaxation process.
4 4.1
Experimental Results and Discussion Data Collection
A human subject experiment was performed to collect a set of 152 full sentence user queries from five domains. We used the collected queries to search on popular commercial image search engines to get more infographics from the same domain. This produced 257 infographics that are in the domain of the collected queries. Each query-infographic pair was assigned a relevance score on a scale of 0-3 by an undergraduate researcher. A query-infographic pair was assigned 3 points if the infographic was considered highly relevant to the query and 0 points if it was irrelevant. Infographics that were somewhat relevant to the query were assigned 1 or 2 points, depending on the judged degree of relevance.
10
Zhuo Li, Sandra Carberry, Hui Fang, Kathleen F. McCoy, Kelly Peterson Query
Baseline Model-1: Model-2: Model-3: Structural Message Structural and Message exact match 0.3245 0.3766 0.3568 0.4168 Learned Model graph expansion 0.3905 0.4280 0.4191 0.4520 exact match 0.3245 0.4348 0.3881 0.4576 Hand Labeled graph expansion 0.3905 0.4782 0.4433 0.4866 Table 1: NDCG@10 Results
4.2
Approach
Experimental Results
In order to evaluate our methodology, we performed experiments in which we averaged together the results of 10 runs, with the Bootstrapping method [26] (a recommended evaluation method for small data sets) used to randomly select training and testing sets of queries. Normalized Discounted Cumulative Gain (NDCG) [17] is used to evaluate the retrieval result. It is between 0 and 1 and measures how well the rank-order of the graphs retrieved by our method agrees with the rank order of the graphs identified as relevant by our evaluator. We use a Student’s t-test for computing significance. The third column of Table 1 gives the NDCG@10 results for the baseline and the next three columns give the results for our three models (structural, message, and structural+message). The first two rows of Table 1 show results when the learned models from our previous work [19, 20] are used to hypothesize requisite structural and message content from the user queries; since the learned models are not perfect, the last two rows of Table 1 show results when handlabelled data is used.1 Furthermore, the first and third rows show results when textual relevance is computed using exact match of query words with graph words, whereas the second and fourth rows give results when query words are matched with words in the expansion of the graph text via Wikimantic. The experimental results, using the learned model for query analysis, show that utilizing structural relevance (Model-1) and message relevance (Model-2) each provide significantly better results than the baseline (p=0.001). Furthermore, the combination of structural and message relevance improves upon either alone (p=0.0005). The results also show that Wikimantic graph expansion improves retrieval performance significantly for all of the approaches (p≤0.005). Furthermore, the results using hand-labelled data are significantly better (p≤0.001) than the results using the learned models from our previous work to extract structural and message content from user queries, thereby indicating that improvement in these learned models should produce better retrieval results.
5
Related Work
Most infographic retrieval systems, such as SpringerImages and Zanran (http://www.springerimages.com, http://www.zanran.com), are based on graphics’ textual annotations as in image retrieval [14], such as the graphics’ 1
For the baseline method, the results are the same since structural and message information is not considered.
Infographics Retrieval: a New Methodology
11
names and surrounding text. There has been previous work on semi-structured data retrieval, such as xml data, that first measures the relevance of each semistructured data element separately, and then combines the relevance measurements to form the overall measurement [15]. In this paper, we focus on natural language queries since they allow users to express their specific information need more clearly than keywords [19, 24, 3]. Previous work on verbose and natural language queries used probabilistic models and natural language processing techniques [2, 21] to identify the key content in such queries. Research on retrieval of structured data, such as linked data and ontologies, also relies on the syntax and semantics of natural language queries [8]. However, attributes and relationships in the data are explicitly given in the ontologies, and the queries specify the desired attribute and/or relationship. In our work, the retrieved unit is a graphic as opposed to the value of an attribute, and extracting structural and message content from a query is more complex.
6
Conclusion and Future Work
This paper has presented a novel methodology for retrieving information graphics relevant to user queries; it takes into account a graphic’s structural content and the graphic’s high-level intended message. Our experimental results show that our methodology improves significantly over a baseline method that treats graphics and queries as single bags of words. To our knowledge, our work is the first to investigate the use of structural and message information in the retrieval of infographics. We are currently extending the variety of relevance features and exploring widely used learning-to-rank algorithms to achieve higher retrieval performance. We will also explore question-answering from relevant graphics.
7
Acknowledgements
This work was supported by the National Science Foundation under grant III1016916 and IIS-1017026.
References 1. Arguello, J., Elsas, J.L., Callan, J., Carbonell, J.G.: Document representation and query expansion models for blog recommendation. In: Proc. ICWSM (2008) 2. Bendersky, M., Croft, W.B.: Discovering key concepts in verbose queries. In: Proc. of ACM SIGIR Conf. on Res. and Dev. in Information Retrieval. 491–498. (2008) 3. Bendersky, M., Croft, W.B.: Analysis of long queries in a large scale search log. In: Proc. of the Workshop on Web Search Click Data. 8–14. (2009) 4. Boston, C., Fang, H., Carberry, S., Wu, H., Liu, X.: Wikimantic: Toward effective disambiguation and expansion of queries. Data & Knowledge Engineering (2014) 5. Carberry, S., Elzer, S., Demir, S.: Information graphics: an untapped resource for digital libraries. In: Proc. of ACM SIGIR Conf. on Res. and Dev. in Information Retrieval. 581–588. (2006) 6. Chester, D., Elzer, S.: Getting computers to see information graphics so users do not have to. In: Foundations of Intelligent Systems, 660–668. Springer (2005) 7. Clark, S., Curran, J.: Wide-coverage efficient statistical parsing with ccg and loglinear models. Computational Linguistics 33(4), 493–552 (2007)
12
Zhuo Li, Sandra Carberry, Hui Fang, Kathleen F. McCoy, Kelly Peterson
8. Damljanovic, D., Agatonovic, M., Cunningham, H.: Freya: An interactive way of querying linked data using natural language. In: The Semantic Web: ESWC Workshops. 125–138. Springer (2012) 9. Demir, S., Carberry, S., Elzer, S.: Effectively realizing the inferred message of an information graphic. In: Proc. of the Int. Conf. on Recent Advances in Natural Language Processing. 150–156 (2007) 10. Elzer, S., Carberry, S., Zukerman, I.: The automated understanding of simple bar charts. Artificial Intelligence 175(2), 526–555 (2011) 11. Escalante, H.J., Hern´ andez, C., L´ opez, A., Mar´ın, H., Montes, M., Morales, E., Sucar, E., Villase˜ nor, L.: Towards annotation-based query and document expansion for image retrieval. In: Advances in Multilingual and Multimodal Information Retrieval, 546–553. Springer (2008) 12. Fang, H., Tao, T., Zhai, C.: A formal study of information retrieval heuristics. In: Proc. of ACM Conf. on Res. and Dev. in Information Retrieval. 49–56. (2004) 13. Futrelle, R.P., Nikolakis, N.: Efficient analysis of complex diagrams using constraint-based parsing. In: Proc. of Int. Conf. on Document Analysis and Recognition, vol. 2, 782–790. (1995) 14. Gao, Y., Wang, M., Luan, H., Shen, J., Yan, S., Tao, D.: Tag-based social image search with visual-text joint hypergraph learning. In: Proc. of Int. Conf. on Multimedia. 1517–1520. (2011) 15. Hiemstra, D.: Statistical language models for intelligent xml retrieval. In: Intelligent Search on XML Data, 107–118. Springer (2003) 16. Huang, W., Tan, C.L.: A system for understanding imaged infographics and its applications. In: Proc. of ACM Symposium on Document Engineering. 9–18. (2007) 17. J¨ arvelin, K., Kek¨ al¨ ainen, J.: Cumulated gain-based evaluation of ir techniques. ACM Trans. Inf. Syst. 20(4), 422–446 (2002) 18. Larkin, J.H., Simon, H.A.: Why a diagram is (sometimes) worth ten thousand words. Cognitive science 11(1), 65–100 (1987) 19. Li, Z., Stagitis, M., Carberry, S., McCoy, K.F.: Towards retrieving relevant information graphics. In: Proc. of ACM SIGIR Conf. on Res. and Dev. in Information Retrieval. 789–792. (2013) 20. Li, Z., Stagitis, M., McCoy, K., Carberry, S.: Towards finding relevant information graphics: Identifying the independent and dependent axis from user-written queries (2013), http://www.aaai.org/ocs/index.php/FLAIRS/FLAIRS13/paper/ view/5939 21. Liu, J., Pasupat, P., Wang, Y., Cyphers, S., Glass, J.: Query understanding enhanced by hierarchical parsing structures. In: IEEE Workshop on Automatic Speech Recognition and Understanding, 72–77. (2013) 22. Metzler, D., Cai, C.: Usc/isi at trec 2011: Microblog track. In: TREC (2011) 23. Metzler, D., Croft, W.B.: A markov random field model for term dependencies. In: Proc. of ACM Conf. on Res. and Dev. in Information Retrieval. 472–479. (2005) 24. Phan, N., Bailey, P., Wilkinson, R.: Understanding the relationship of information need specificity to search query length. In: Proc. of ACM SIGIR Conf. on Res. and Dev. in Information Retrieval. 709–710. (2007) 25. Savva, M., Kong, N., Chhajta, A., Fei-Fei, L., Agrawala, M., Heer, J.: Revision: Automated classification, analysis and redesign of chart images. In: Proc. of ACM Symposium on User Interface Software and Technology. 393–402. (2011) 26. Tan, P, Steinbach, M., Kumar, V.: Introd. to Data Mining. Addison Wesley. (2006) 27. Wu, P., Carberry, S., Elzer, S., Chester, D.: Recognizing the intended message of line graphs. In: Diagrammatic Representation and Inference, 220–234. (2010)