VOXER Model ST-600 from NAC Image Technology. Company, with a monocular sampling rate of 30 Hz was used to trace eye movements of participants.
Original Paper
INFORMATION AND SYSTEMS IN EDUCATION, Vol. 12, No. 1 2013 pp. 1–12
Viewing Behaviors Affected by Slide Features and Learning Style in Slide Video from a Sequence Analysis Perspective Jianxia Cao* and Akinori Nishihara* (Received 14 October 2012 and accepted in revised form 19 March 2013) Abstract This study adopted eye-tracking techniques to investigate the viewing behaviors of students when they watched a slide video in order to get a better understanding of slide video design and learning style theory. The Felder-Soloman Learning Style Model (FSLSM) was used to test students’ learning styles and students’ viewing behaviors were recorded by an eye-tracking machine. Results showed that participants tended to give priority to the text parts which was consistent with the literature. Pictures in the slide video were paid attention to in a higher ratio compared with a previous study on text-picture integrated stimulus. Effects of slide features and picture functions on students’ viewing behaviors were examined. Strong visual learning preference participants paid more attention to the picture and title parts. Moderate visual participants paid more attention to the text and video parts while well-balanced participants were in between them. Sequence analysis was applied to check the transition preference and similarities of viewing behaviors among students. Strategies on slide video designs and a discussion of FSLSM model are provided. Keywords: e-learning, instructional design and curriculum, web-based learning
are being made to test the theory. Section 4 puts forwards research questions. Section 5 explains the research methodology, experimental setup and procedure. Section 6 presents data analysis results. Section 7 gives a discussion and Section 8 summarizes the conclusions.
1. Introduction Instructional slide video is widely used for educational purposes nowadays. Better understanding of the viewing behaviors of participants with different learning style preferences will help to improve the effectiveness of learning by using video. Previous research has shown that students differ in their learning preferences and patterns when they watch video(1). Eye-tracking technology traces participants’ real-time eye movements and provides details of the viewers’ cognitive processes. A previous study by Liu(2) claimed that eye-tracking technology is helpful in exploring students’ cognitive processes in multimedia learning. As individual characteristics of the viewer as well as the stimuli both contribute to viewers’ eye movement behaviors(3, 4), in this study, we investigate viewing behaviors of students from two perspectives, slide features and learning style, with the aim of getting a better understanding of learning style theory and more effective slide video design. The rest of our paper is structured as follows. Section 2 presents the background of this research, including initial findings on previously collected text-picture integrated information with eye-tracking technology and the theoretical basis for slide video design. Section 3 describes learning style theory and efforts that
2. Background Video is becoming the ultimate form to transmit educational resources for web-based self-paced learning. Bates(5) and Davis(6) have described particular attributes of video to support learning. Video facilitates narrative visualization and dynamic modeling. Abstracting information from ‘real life’ for conversion into text often results in over-simplification. Using video may lead to a better description by the lecturer and better visualization, recognition and identification by the students. Slide video refers to the multimedia learning contents which include a video of the lecturer with the voice synchronized to the learning slide contents. This kind of computer-based video media has the potential of keeping the advantages of authenticity and customization leading to a more self-regulated acquisition and a deeper elaboration of the slide contents(7). Since the late 1880’s there has been scientific interest in human eye movements and their ability to reveal cognitive strategies. Ocular indices enable researchers to determine what a learner is indeed viewing and reading, for how long, and in what order. Several key vari-
* Tokyo Institute of Technology, Japan 1
VIEWING BEHAVIORS AFFECTED BY SLIDE FEATURES AND LEARNING STYLE IN SLIDE VIDEO
ables have emerged as significant indicators of ocular behaviors throughout the history of eye-tracking research, including fixation, saccades and scanpaths(8). Fixations are a relatively stable eye-in-head position within some threshold of dispersion (typically about 2 deg) over some minimum duration (fixation time can last as long as 2 or 3 s, depending on the level of interest, but they generally fall within the 200–600 ms range), and with a velocity below some threshold (typically 15–100 deg/s)(9). Saccades are very rapid eye movements, which bring a new part of the visual scene into focus. Scanpath is defined as repetitive sequences of fixations and saccades(10). It is typically combined with a set of AOIs (Areas of Interest) by determining the containment of fixations within AOIs. A review of the literature provides few examples regarding people’s eye movements integrating both textual and visual elements in an educational context. An eye-tracking research study on advertising materials conducted by Rayer et al.(11) indicated that participants spent most of their time looking at the textual portions of the advertisement. Viewers tended to give early priority to the text. Rayer et al. presumed that it was more likely that early attention to the text might reflect a longstanding strategy based on years of interaction with stimuli that combine textual and pictorial information. This result is interesting for its inconsistency with how advertising agencies view the relative importance of the visual over text portions of ads. Another research study by Hughes et al.(12) on a video retrieval system found that participants looked at the textual surrogates (metadata stand for the full object) much longer than the visual surrogates by Hughes et al. claimed that regardless of where the text was placed it was utilized as the main information source. The balanced group (whose learning style preference is neither strongly visual nor strongly verbal) spent more time looking at text than did the picture-oriented group. All the participants looked at and fixated on titles and descriptions far more than on the pictures in the displayed results. Previous research found that imagery supplemented an initial and lasting impression that was decoded from the textual material when students viewed instructional diagrams comprised of both visual and textual directions(13). Prior research has indicated that important information is processed during the first few seconds(14). Against the popularly accepted view of “a picture is
worth a thousand words”, the Stanford Poynter Project investigating reading behaviors on news web sites concluded that text was frequently the first-entry point for a majority of online news readers(15). Initial design recommendations on web viewing have emphasized the need to place critical portlets on the left and top of the web portal area(16). Mayer and his colleagues(17, 18) argued that social cues in multimedia messages, including the type of voice, can affect how much students like the speaker and how hard students try to understand the presented material. They encouraged students to interpret humancomputer interactions as more similar to human-to-human conversation based on social agency theory. It is also expected that the presence of instructor would lessen the distance between teacher and students so that they would not feel bored or that the subject was dull. In a slide video context, the image and voice of the lecturer are integrated, text and picture learning materials are mixed up. The existence of abundant multimedia elements requires students to adopt more complicated cognitive processing strategies compared with text-picture integrated material. Therefore, we would like to address the effect of layout on students’ viewing behaviors. As more versatile layouts of the slides are incorporated into the slide video design; a more comprehensive understanding might be achievable. In addition, individual characteristics of each viewer as well as the stimuli both contribute to viewers’ eye movement behaviors in any eye-tracking study(4). In the present study, we examine the viewing behaviors of students in a slide video context from two perspectives, the slide stimulus and students’ cognitive traits—learning style. Sequential analysis of scanpaths can help to understand the flow of visual attention on a task. While several researchers such as Brandt and Stark(19) and Salvucci and Anderson(20) have described or used the string-editing methodology to study eye-path sequences, few other studies have been reported(14). This is the first study to our knowledge in which viewing behaviors regarding instructional slide video has been studied using eyetracking measurement and incorporating sequences analysis.
3. Learning Style Learning style is an important index for identifying students’ cognitive traits. There is a characteristic
2
INFORMATION AND SYSTEMS IN EDUCATION, Vol. 12, No. 1 2013
much more time decoding the text(12). It was hypothesized that, due to the left-to-right reading habits of Western culture, whatever information was placed on the left hand side might be used first. The layout did not affect the total fixation time in each region. Participants were thoroughly proficient at using text as their primary tool for selecting relevant videos. The situation in the Japanese language context might be different because of the right-to-left reading habit.
strength and style preference in the ways people take in and process information. Each student has his/her unique way of learning. Learning style is the way in which each participant begins to concentrate on, process, absorb, and retain new and difficult information(21). In engineering education the Felder-Soloman Learning Style Model (FSLSM)(22) has been commonly used. Its web-based version test is taken over 100,000 times every year and has been used in a number of published studies. Its reliability and validity have been examined and reported to meet standard acceptability(23). It is considered to be a suitable psychometric tool for evaluating learning style(23). The four dimensions of the FSLSM are: active/reflective, sensing/intuitive, visual/ verbal, and sequential/global. More information on these four dimensions is available in the literature(22–26). Various efforts have been made to detect students’ learning style to design better online courses. Graf and Liu(27) claimed that cognitive traits, in particular working memory capacity (WMC), can be used for identifying learning styles. They found a relationship linking a sensing learning style with low WMC and an intuitive learning style with high WMC; further, a balanced learning style tends to have high WMC, whereas participants with either a very active or a very reflective learning style tend to have low WMC. This relationship has been assumed to improve automatic student modeling in adaptive learning systems. In this study, we explore learning style by eye-tracking methodology, which might be a supplementary and feasible way to detect students’ learning style.
Q2: How do students distribute attention to each stimuli element in slide video based on learning style? Previous research showed that the balanced group (those who had no preference for either visual or verbal learning), spent more time looking at the text than the visual group in a digital video retrieval system(12). We hold the same view and propose to investigate it by eyetracking data. Different viewing behaviors which reflect the students’ learning style preference when they watch the same slide video can be assumed. We want to investigate which stimuli element in a slide video (text, picture, video or title) attracts participants’ attention more for different preferences participants.
Q3: Is there any transition tendency among participants having different learning style preferences?
Both stimuli and individual characteristics contribute to viewers’ eye movement behaviors(4). Pictures have been reported for short time fixation and confirmation use(11, 12) , and texts have been found to be frequent firstentry points for a majority of online news readers (15); whether these are true in a slide video learning environment is unknown. Therefore, we set our research questions as follows.
Participants tend to change their eye movement among different AOIs with different strategies. The transition of attention on stimuli reveals their cognitive tactics in processing the information. We want to investigate the tendency and preference students have to process the stimuli elements and what diverts their attention. Whether they tend to move their attention from picture to text parts or from text to video parts, do these transition differences reveal the characteristics of other dimensions of learning style or do they cause different learning performances are the questions to be investigated.
Q1: Are viewing behaviors affected by slide layout and if so, how?
Q4: To what extent do sequence similarities reveal learning style similarities?
In a study addressing the interplay between text and images, it was reported viewers consistently spent
Scanpath represents the cognitive strategy by which participants process the information. Scanpath
4. Research Questions
3
VIEWING BEHAVIORS AFFECTED BY SLIDE FEATURES AND LEARNING STYLE IN SLIDE VIDEO
analysis has revealed that the complexity of web page design influences the degree of scanpath variations(4). Whether sequence similarities represent learning style similarities and to what extent is examined.
5. Method A multimedia presentation on the ozone layer, synchronized with the lecturer’s voice and slides, was developed based on Mayer’s Cognitive Theory of Multimedia Learning (CTML) model in which several ways to reduce extraneous processing, manage essential processing and foster generative processing were proposed(28). Learning contents were designed based on some of those principles, and they are reviewed here. Coherence principle: Students are better able to make sense of a multimedia lesson when interesting but irrelevant material is not included. When designing slides, we asked one professor to check all the presentation materials to make sure contents were coherent. Signaling principle: People learn better from a multimedia message when the text is signaled rather than non-signaled. Signals do not add any new information but rather highlight (or repeat) the essential material in the lesson. We colored some words to emphasize their importance in the slide. Redundancy principle: People learn more deeply from graphics and narration than from graphics, narration and printed text. In our experiment, we did not distribute the printed presentation materials to the participants since our main concern was where their attention was distributed on the screen. Spatial contiguity principle: People learn more deeply from a multimedia message when corresponding text and pictures are presented near rather than far from each other on the page or screen. We ensured the corresponding text and pictures were arranged together when designing the slides. Temporal contiguity principle: People learn more deeply from a multimedia message when corresponding animation and narration are presented simultaneously rather than successively. Thus in the presentation, we added some animation to synchronize the narration and text or pictures. Mayer and his colleagues(17, 18) also suggested some principles for managing essential processing and fostering generative processing. These are as follows and all of them were followed in our slide video design.
Figure 1. Layout of Slide 1 in Slide Video.
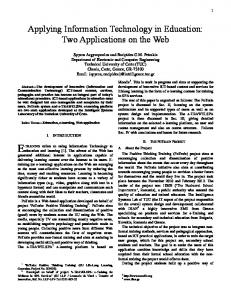
Multimedia principle: This presents an explanation with words and pictures results in better learning than presenting words alone. Personalization, voice and image principles: People learn more deeply when words are presented in conversation style rather than formal style and people learn more deeply when narration in a multimedia lesson is spoken by a friendly human voice rather than by a machine voice. The slide video was produced using the Microsoft producer for PowerPoint software and presented on a 65-inch monitor at a resolution of 1440×1080 pixels. Eleven slides were included in a total 9:54 minutes. Layout of the video structure for slide 1 is shown in Figure 1. The framework (areas for video, title, learning contents) was fixed throughout the eleven slides. In the upper left side, the video part captured the scene of the lecturer giving the lecture. The right upper side showed titles for each slide. The lower part including text 1, text 2, and picture 1 was variable according to the contents and design of each slide. There might be two pictures with one text paragraph, or two text paragraphs with one picture etc., based on the contents of the slides. A noncontact infrared type eye-tracker, EMRA-AT VOXER Model ST-600 from NAC Image Technology Company, with a monocular sampling rate of 30 Hz was used to trace eye movements of participants. The distance between the eye-tracker and monitor was 1500 mm. A photo of the experimental setup is reproduced in Figure 2. The experimental procedure was as follows: 1) �The paper-based FSLSM test was applied to test participants’ preferences. 2) �Participants were calibrated in order that their eye movements could be tracked successfully. Calibration
4
INFORMATION AND SYSTEMS IN EDUCATION, Vol. 12, No. 1 2013 Table 1. Mean Fixation for Each AOIs for Each Slide. AOIs
Text
Picture
Video
Title
Time (s)
20.7
16.7
1.2
1.5
Figure 2. Experimental Setup at the Eye-Tracking Lab.
consisted of identifying individual eye features based on geometry. 3) �A small pre-test asking very basic information on the ozone layer, like where the ozone layer is located and how it functions, was given. 4) � Participants watched and studied the instructional slide video. 5) �Participants had a three-minute free reviewing time to go through the unclear parts. 6) � A post-test and free-comment questionnaire which took 20 minutes were conducted. The total experiment lasted for 60–90 minutes depending on the calibration process and reading speed of each participant. Fifty students took part in this experiment. After calibration selection, we got 41 qualified participants (27 males and 14 females). Their average age was 23.8 years old and most of them were graduate students. Their majors varied among physics, chemistry, mechanics, computer science, nuclear engineering, information engineering and international development engineering.
Figure 3. Group A—Pictures Explain Changing Phenomena.
Figure 4. Group B—Pictures for Assisting Understanding.
on each AOI for all participants is shown in Table 1. Picture part in the slide occupied 41.7% of the attention from the total fixation. This was rather high compared with previous results(11, 12). Thus we speculated that the pictures in slide video are quite different from pictures in advertisement(11), a retrieval system(12) or in web browsing(4). For a more specific understanding, we divided all slide layouts into four groups based on the function of the pictures and their location.
6. Results A “left-to-right” tendency was found for all the participants. When the picture was on the left, participants predominately fixated on the picture first and when the text was on the left, the participants predominately fixated on the text. This was consistent with the “first-entry” effect from previous research on online news reading(15). Mean fixation duration on each page was 43.65 s, and the average explanation time for each slide was 54 s. Accuracy of this eye-tracking experiment was 43.65/54=81%. The exact times for slide 1 to slide 11 were 42, 40, 73, 61, 46, 49, 54, 55, 85, 45, and 44 s, respectively. Means of the total fixation for each slide
Q1: Are viewing behaviors affected by slide layout and if so, how? Group A included slides 4, 6, and 9, where pictures were used to explain the main principle and the changing process (like how ozone occurs and how the ozone layer is destroyed, etc.) and they were about the same size as the text area (Figure 3). Pictures in these slides got the highest fixation times, about 46–53% of one slide time. Group B included slides 7 and 8, where pictures
5
VIEWING BEHAVIORS AFFECTED BY SLIDE FEATURES AND LEARNING STYLE IN SLIDE VIDEO Table 2. Mean Fixation duration (MFD) on Picture Part for All Participants Based on Slides, Standard Deviation (SD) and p-Value. MFD on picture part (s)
SD
p-Value
Slide 4
29.71
10.74
0.05
Slide 6
25.47
9.37
Slide 9
24.12
11.70
Slide 7
19.04
8.55
Slide 8
16.96
9.05
Slide 1
11.80
5.13
Slide 5
14.83
7.82
Slide 10
15.70
8.15
Slide 11
13.44
6.37
Slide 2
6.11
4.07
Slide 3
5.63
4.25
Slide no.
Figure 5. Group C—Pictures Including Several Key Words.
and text were interlaced (Figure 4). There were several characters on the picture to assist explaining and understanding (like a picture of ozone used in industry, diseases caused by the ozone layer destruction). Pictures in this kind of layout got the second highest fixation times, about 29–35% of one slide time. Group C included slides 1, 5, 10, and 11 where a few labels were included in the picture part; they were key words abstracted from the text and shown in the picture (like the height of ozone layer in atmosphere, how it protected the earth, etc.). Pictures in this kind of layout got the third highest fixation times, about 20– 28% of one slide time. Group D included slides 2 and 3, with the same layout as Group C, but with no labels on the picture, mainly for help in imagining things (like an image of the ozone hole, an apparatus for measuring ozone density, etc.). Pictures in this kind of layout got the least fixation times, about 10–11% of one slide time. Mean fixation time on the picture part for the 41 participants, standard deviation, and p-value of the ANOVA test (t-test if there are only two slides included) for the slides in each group are shown in Table 2. We could see that the fixation on the picture part was largely dependent on the slide layout, especially which function the picture was used for. For the same slide layout which shared the similar picture function, fixation on the picture part was not significantly different based on the p-value for each group. Thus how the pictures were designed and used determined how much attention was paid to them. For research questions Q2–Q4, we focused mainly on the visual-verbal dimension in the learning style as eye-tracking data could reveal the characteristic of this dimension best, meanwhile, the other dimensions were also considered for reference. While the original score range for each dimension was [−11, 11], in our sampling dataset, all the participants’ scores on the visual-verbal
0.16
0.07
0.52
dimension were in the range [11, −3], which meant no strong verbal participants were identified. Hughes et al.(12) claimed there were six picture-oriented and six balanced participants in their study and none were textoriented. Combining that with our sampling data, we speculated most participants were visual-oriented. Based on the FSLSM participants were classified into three groups using their visual-verbal dimension score. Among these 41 participants, we identified 13 with very strong visual learning preference (with the score on the visual-verbal dimension in the range [9, 11]), 16 with moderate visual learning preference (with the score in [5, 7]) and 12 well-balanced visual-verbal participants (with the score in [−3, 3]).
Q2: How do students distribute attention to each stimuli element in slide video based on learning style? As shown in Figure 1, an instructional slide was divided into video, title, text and picture parts, a one-letter code was defined for each area, represented by V, C, T and P, respectively. For the right lower part, if there were two text paragraphs, they were combined and seen as one text part. If there were two picture parts, they
6
INFORMATION AND SYSTEMS IN EDUCATION, Vol. 12, No. 1 2013 Table 3. Mean Fixations of Each AOI for Three Groups (Unit=s). V
Table 4. Mean Scores of the Global-Sequential Dimension (GSD) for Three Groups.
Group
T
P
C
S
19.78
17.92
0.7
1.59
Learning preference
No. of GP
Mean score of GSD
No. of SP
Mean score of GSD
M
21.62
15.70
2.15
1.56
S
7
7.86
6
7.00
Bal
20.68
16.44
0.88
1.19
M
8
7.38
8
6.50
Bal
9
7.22
3
8.67
Note: T, text; P, picture; V, video; C, title; S, strong visual learners; M, moderate visual learners; Bal, well-balanced learners.
Note: S, strong visual learners; M, moderate visual learners; Bal, well-balanced learners, GP, global preference; SP, sequential preference.
were combined and seen as one picture part. The means of the sum of fixations of each AOI for each group are shown in Table 3. Strong visual learners were represented by S, moderate visual learners by M, and well-balanced learners by Bal. All participants gave the most attention to text and picture parts. This was understandable since the main material information on the slide was from texts and pictures. The title part was paid attention to in a relatively small portion for each slide since there was a little information and it was relatively fixed. Obviously, all three groups paid the most attention to the text part; the text part was given the first priority and utilized as the main information resource which was consistent with previous research(11, 12). Strong visual participants paid more attention to picture and title parts than the other two groups. Moderate visual participants paid more attention to text and video parts than the other two groups, followed by the well-balanced participants then the strong visual participants. The ANOVA test was applied on the fixation time on text, picture, video and title parts for three groups. No significant difference in fixation time was found on text, picture and title parts among three groups. Significant difference was found in the video part among the three groups (p=0.02). The Tukey HSD showed that the difference between the strong visual group and the moderate group was significant (p=0.03). Other dimensions of the FSLSM were also investigated in combination with the visual-verbal dimension. Twenty-four out of the 41 participants showed a global learning preference (threshold setting to zero) and 17 showed a sequential learning preference. Distribution of the global-sequential dimension with the visual-verbal dimension, and mean values of scores of the global-sequential dimension are shown in Table 4. Strong visual participants seemed to have a tenden-
cy for a higher global learning preference compared with moderate and well-balanced participants, which might explain why strong visual participants paid slightly more attention to the title part.
Q3: Is there any transition tendency among participants having different learning style preferences? Sequence patterns afford insight into questions regarding how viewers examine a scene while performing a task. Scanpaths of each participant for 11 slides were decoded from the eye-tracker data. For example, a viewing beginning with three fixations in area T followed by a single fixation in area C, two fixations in area P and three fixations in area V, would generate a sequence represented with “TTTCPPVVV”. A fixation sequence that contained multiple successive fixations within an AOI was called an expanded sequence. Expanded sequences conveyed both the sequential characteristics of a sequence and some temporal characteristics. The “eyePatterns” software(29) developed by researchers at the Rochester Institute of Technology was used to do the analysis. As gaze sequences reflect underlying cognitive operations, the differences and similarities between gaze sequences reflect the differences and similarities between cognitive processes while viewing a scene(29). The probability of a viewer’s fixation transitioning from one AOI to another predicts the manner in which attention switches between information sources(29). Anticipated transition probability of each AOI for the three groups is shown in Table 5. The probability at (i, j) was the probability that given a participant’s fixation was on AOI i, the next AOI was AOI j. All of the proba-
7
VIEWING BEHAVIORS AFFECTED BY SLIDE FEATURES AND LEARNING STYLE IN SLIDE VIDEO Table 5. Anticipated Transition Probability for Each AOI for Three Groups (TP per. =Transition Probability percentage). TP per. (%) Current AOI T
P
V
C
struction. Finally, if the current AOI was the title part, the next most possible AOI was the text part for all three groups. While the strong visual group transited more from title to text parts, moderate visual and well-balanced groups tended to transit from title to video parts. These transition tendency results were consistent with the time-domain analysis in Q2. Whatever strategies the participants were taking, these different transition tendencies did not affect students’ learning outcomes. Students’ learning performance was measured using the gain from the pre-test (range [0, 5]) to the post-test (range [0, 20]) scores. The ANOVA test was applied to the performance gain and it showed that there was no significant differences among the three groups (p=0.56). Strong visual (mean=13.77) and well-balanced visual (mean=13.67) groups reported a higher learning performance gain than the moderate group (mean=12.81). Effect of gender on learning performance gain was not significant either (p=0.32), although the female participants (mean=13.88) outperformed the male participants (mean=13.04).
Next AOI T
P
V
C
Total
S
62.0
27.8
2.3
7.9
100
M
61.6
25.4
4.8
8.2
100
Bal
66.8
25.0
3.0
5.2
100
S
39.3
52.2
1.9
6.6
100
M
38.2
51.1
5.4
5.3
100
Bal
38.5
53.9
3.0
4.6
100
S
43.7
21.2
18.0
17.1
100
M
35.8
26.8
20.5
16.9
100
Bal
39.7
22.6
23.3
14.4
100
S
50.6
20.2
7.9
21.3
100
M
44.4
14.9
13.9
26.8
100
Bal
40.8
22.3
12.2
24.7
100
Note: T, text; P, picture; V, video; C, title; S, strong visual learners; M, moderate visual learners; Bal, well-balanced learners.
Q4: To what extent do sequence similarities reveal the learning style similarities?
bilities in a row added up to 100%. Thus, from the table, we could speculate the next possible AOI where the gaze of the corresponding group was going to distribute. For example, from this table, we could see that if the current AOI was the text part, then for strong, moderate, and well-balanced visual groups, the next most possible AOI was still the text part. Strong visual participants tended to shift more from text part to picture part, while moderate visual participants tended to shift more from text part to video part compared with the other two groups. If the current AOI was the picture part, the most likely next AOI was still the picture part for all three groups. Strong visual participants tended to shift more from picture part to title part, while moderate visual participants shifted more from picture to video parts. If the current AOI was the video part, then the next most probable AOI was the text part for all three groups. Participants used audio and text as mutual auxiliary tools to help in their understanding and in meaning con-
Each participant had a value on the visual-verbal dimension, which was in the range [11, −3]. Absolute values of the differences of the visual-verbal dimension among the 41 participants were defined as E, a 41×41 matrix E was generated. Each participant got a scanpath from the eye-tracking, and the Levenshtein distance algorithm was used to calculate the distance among these sequences. Levenshtein distance is an optimal matching analysis (OMA) methodology that measures resemblance between sequences(30). It computes the smallest possible cost of elementary operations of insertion, substitution and deletion of units required to transform one sequence into another(31). A 41×41 matrix F was achieved based on the Levenshtein algorithm. We calculated the correlation between E and F (p=0.15, r=0.035). This indicated that the Levenshtein distance from the scanpath would rarely reflect the similarities of participants’ visual-verbal learning style preferences. The coefficient was low since only the visual-verbal dimension was considered. The other three dimensions might be contributing to the
8
INFORMATION AND SYSTEMS IN EDUCATION, Vol. 12, No. 1 2013
7. Discussion 7.1 About experiment setup There are two points that need to be noted. First, no handouts were distributed to the participants beforehand. In real life, students access slide video randomly and often without handouts beforehand. During the experiment, if participants were reading the handout instead of watching the video, we would not be able to track their eye-movements successfully. Second, the real learning process may involve note taking. But this was not allowed in our study as that would cause inconvenience to the tracking of eye movement too. Most of the participants insisted on watching the slide video continuously from beginning to end, they did not ask for a rest midway. It seemed that a ten-minute video was not so demanding on participants’ cognitive capacity and did not cause eye-tiredness. Although a three-minute free reviewing time was provided, participants were not forced to review for the full three minutes. Some of them asked for the test after a one-minute review, some made full use of the time till to the last second. An examination of the free-reviewing time revealed that active participants (mean=168.1 s, SD=53.86) (with the threshold of the active learning preference range [3, 11], balanced learning preference range [−3, 3] and reflective learning preference range [−3, −11]) spent less time on reviewing than balanced participants (mean=175.7 s, SD=47.64) and reflective participants (mean=168.1 s, SD=53.86). By observing the recorded video learning process, sequential learners were found to review the contents step by step while global learners dragged the cursor rapidly over a large area. The accuracy of the eye-tracking was 81%, which meant that 19% of the data were missing due to eye blinking and body movement of participants. The cognitive process might be taking place during these periods, which might cause some noise in the analysis, but it is unavoidable in eye-tracking experiments.
Figure 6. Participants Clustering. Note: The shape of the nodes represents the original learning style test result, triangles are for S, squares for M, and circles for Bal.
correlation. As an implication, based on the distance among the participants, we used hierarchy clustering(29) to visualize their similarities. The common trait among gaze sequences that were clustered together was their proximity to one another i.e., a small Levenshtein distance score. Forty-one students were clustered into three groups based on their Levenshtein distances as shown in Figure 6. As a short distance meant a higher proximity, the 41 nodes were classified into three areas by intuitiveness, rough circles marked by S, M, and Bal. And the shape of the nodes represents the original learning style test result, triangles stand for S, squares for M, and circles for Bal. As can be seen from the graph, there were some discrepancies between the clustering result and the original learning style test result. If we regarded the S participants falling into the S circle as matching, the M participants falling into the M circle as matching, and the Bal participants falling into the Bal circle as matching, the matching ratio was 40%.
7.2 About learning style Students’ cognitive traits—learning style, were used to study the viewing behaviors. There was evi-
9
VIEWING BEHAVIORS AFFECTED BY SLIDE FEATURES AND LEARNING STYLE IN SLIDE VIDEO
dents in online courses using data mining and semantic analysis is important for relating the learning style model with the features of the online environment(27). This could be another area of application of this research. By recording the sequences of the viewer, a realtime monitoring; content authoring system might be useful for adaptive learning. Other studies have explored the other dimensions of learning style theory by log files(32). Our present study supplements the literature on learning behaviors as affected by learning style.
dence that different learning style preference students showed different viewing behaviors. Strong visual participants paid more attention to the picture and title parts while moderate visual participants paid more attention to the text and video parts. Well-balanced participants were in between them. The video part included the video images of the lecturer and the lecturer’s voice, moderate and well-balanced participants paid more attention to the video part. It seemed that they received information from both visual and auditory channels simultaneously, while visual participants preferred visual stimulation and paid less attention to the auditory channel. The video part in the slide video contained both auditory and visual channel information. The mixed channel information might trigger different information processing mechanisms among different participants. In this study, well-balanced students paid more attention to the picture part than moderate visual students, which was inconsistent with the basic learning style assumption. We speculated that moderate visual students preferred the video part more than well-balanced and strong visual students, as their attention on the video part was much higher than the other two. More detailed and specific examinations are needed to reveal the interaction mechanism in a multimedia learning context. Also, other characteristics of students rather than learning style such as personality and background knowledge might also contribute to different viewing behaviors. Afterwards, students’ perceived satisfaction was investigated among the three groups. The ANOVA test showed that there was no significant difference among them (p=0.25). Strong visual participants reported a higher satisfaction than moderate and well-balanced participants. The FSLSM is based on tendencies, indicating that participants with a high preference for certain behaviors can also act sometimes differently(25). That might be one reason that the difference among the three group participants was not significant for text, picture and title parts. The ten-minute learning period might be enough time for them to adjust to their favored way for assimilating knowledge and thus the difference might be balanced out. Also, the intersection of the four dimensions of the FSLSM seems to play a role in the viewing behaviors too. A detailed description of learning styles to detect learning styles automatically from the behavior of stu-
7.3 About the result Differing from advertisements and searching tasks, pictures in the slide video were paid attention to at a higher frequency. Slide layout and picture function had an effect on fixation time. Pictures used for explaining the changing process and phenomena attracted the highest attention. More labels in pictures drew more attention than fewer labels embedded in pictures. Pictures for intuitiveness and help in imagining were simply scanned through and paid the least attention. Even though researchers agree that both stimulus and characteristics of students would affect eye movement(4), how and in which way are unanswered questions. In this study we tried to clarify these points in a slide video context. Pictures were paid high attention and how they were designed determined how the attention was paid to them. A large majority of the participants admitted that the lecturer’s voice was helpful for their understanding. Seventy-eight percent of the participants were satisfied with instructor’s teaching. Eighty percent of them suggested that the red colored words used in the slides helped them to pay attention. Some valuable feedback was achieved from the free-comment questionnaire. Suggestions included: to make the main phrase of the text part brief; to add some description for the picture parts; and to use animation. One interesting phenomenon was that students showed a preference corresponding with their learning style in the free-comment. Global learning preference participants wanted to see all the contents at once to have a holistic overview, while sequential learning preference participants tended to want the contents appearing step by step with an animation so they could concentrate on the current part. This provides valuable suggestions for designing an adaptive learning
10
INFORMATION AND SYSTEMS IN EDUCATION, Vol. 12, No. 1 2013
management system when embedding slide video. This study also identified other interesting topics, for example, when multi-modality stimuli (text, picture, voice) are presented simultaneously, how the students with different learning styles process the multimedia information and integrate it into a long-term repository still need more investigation. And of course, this interaction mechanism in multimedia learning might exceed the capabilities of the FSLSM model, and a new model might be needed to clarify the complicated mechanism.
(2) �Liu, H.-C.: “Eye-tracking Viewers’ Processing of Webbased Multimedia Information”, 2009 Joint Conferences on Pervasive Computing (JCPC), IEEE, pp. 699–704 (2009). (3) � Rayner, K.: “Eye Movements and Information Processing: 20 Years of Research”, Psychological Bulletin, Vol. 124, No. 3, pp. 372–422 (1998). (4) �Pan, B., Hembrooke, H. A., Gay, G. K. et al.: “The determinants of web page viewing behavior: an eye-tracking study”, in ETRA 2004 Proc. of the Eye Tracking Research and Application Symposium March 22–24, 2004, San Antonio, Texas, USA, eds. Duchowski, A. T. and Vertegaal, R., pp. 147–154 (2004). Bates, A. W.: “Using Video in Higher Education”, Institute (5) � of Educational Technology, Paper on Broadcasting No. 243, 21 June (1985). (6) � Davis, B.: “Image Learning: Higher Education and Interactive Video Disc”, Teachers College Record, Vol. 89, No. 3, pp. 352–59 (1988). (7) � Schwan, S.: “Getting Interactive Media into Schools”, IFIP International Federation for Information Processing, Vol. 182, pp. 95–102 (2005). (8) �Stark, L. W. and Ellis, S. R.: “Scanpaths Revisited: Cognitive Models Direct Active Looking”, in Eye Movements: Cognition and Visual Perception, eds. Fisher, D. F. et al., pp. 193–226. Lawrence Erlbaum Associates, New Jersey (1981). (9) � Jacob, R. J. K. and Karn, K. S.: “Eye Tracking in Human—Computer Interaction and Usability Research: Ready to Deliver the Promises”, in The Mind’s Eye: Cognitive and Applied Aspects of Eye Movement Research, eds. Hyona, J., Radach, R. and Deubel, H., pp. 573–605. North-Holland, Amsterdam (2003). (10) �Noton, D. and Stark, L. W.: “Scanpaths in Saccadic Eye Movements While Viewing and Recognizing Patterns”, Vision Research, Vol. 1, pp. 929–942 (1971). (11) � Rayner, K., Rotello, C. M., Stewart, A. J. et al.: “Integrating Text and Pictorial Information: Eye Movements When Looking at Print Advertisements”, J. of Experimental Psychology: Applied, Vol. 7, No. 3, pp. 219–226 (2001). (12) �Hughes, A., Wilkens, T., Wildemuth, B. M. et al.: “Text or Pictures? An Eyetracking Study of How People View Digital Video Surrogates”, Image and Video Retrieval, Lecture Notes in Computer Science, Vol. 2728, pp. 271– 280 (2003). (13) �Faraday, P. and Sutcliffe, A.: “Making Contact Points between Text and Images”, Proc. of the Sixth ACM
8. Conclusion We investigated students’ viewing behaviors by eye-tracking based on slide features and FelderSoloman learning style theory. Pictures in slide video had more attention paid to them compared with pictures in advertisements or a retrieval system. Slide layout and picture function had an effect on fixation time. Careful picture selection, concise texts, and adaptive presentation ways are suggested for better slide video design. We investigated viewing behaviors on each element of the slide. Scanpath analysis was used to examine the transition probability of viewing behaviors among students with different learning styles. Generally, all three groups paid more attention to the text part, which was consistent with previous research studies(11, 12). Globalsequential and active-reflective learning preferences were also confirmed by viewing behaviors. Participants adopted different viewing strategies without affecting their learning performance. When constructing an adaptive content authoring and exhibition system, better understanding of students’ learning style preference would be helpful for better participants’ modeling. Acknowledgement Gratitude goes to the professors at Tokyo Institute of Technology who cooperated with lecture design and distribution, to all the students who took part in the experiment, and the anonymous reviewers who gave precious advice.
References (1) �De Boer, J., Kommers, P. A. M. and de Brock, B.: “Using Learning Styles and Viewing Styles in Streaming Video”, Computers & Education, Vol. 56, No. 3, pp. 727–735 (2011).
11
VIEWING BEHAVIORS AFFECTED BY SLIDE FEATURES AND LEARNING STYLE IN SLIDE VIDEO
in Proc. 2003 Annual ASEE Conference, pp. 1–5 (2003). (26) �Graf, S., Viola, S. R., Leo, T. et al.: “In-Depth Analysis of the Felder-Silverman Learning Style Dimensions”, J. of Research on Technology in Education, Vol. 40, No. 1 (2007). (27) �Graf, S. and Liu, T.-C.: “Identifying Learning Styles in Learning Management Systems by Using Indications from Students’ Behaviour”, in Eighth IEEE International Conference on Advanced Learning Technologies, pp. 482–486 (2008). (28) �Mayer, R. E.: Multimedia learning, Cambridge University Press, Cambridge (2006). (29) �West, J. M., Haake, A. R., Rozanski, E. P. et al.: “eyePatterns: Software for identifying Patterns and Similarities across Fixation Sequences”, in ETRA 2006 Proc. of the 2006 Symposium on Eye Tracking Research and Applications, eds. Raiha, K-J. and Duchowski, A. T., pp. 149–154 (2006). (30) � Holmes, M. E.: “Optimal Matching Analysis of Negotiation Phase Sequences in Simulated and Authentic Hostage Negotiations”, Communication Reports, Vol. 10, No. 1, pp. 1–8 (1997). (31) �Abbott, A. and Forest, J.: “Optimal Matching Sequences for Historical Sequences”, J. of Interdisciplinary History, Vol. 16, pp. 471–494 (1986).
International Conference on Multimedia. Bristol, UK, pp. 29–37 (1998). (14) � Josephson, S. and Holmes, M.E.: “Visual Attention to Repeated Internet Images: Testing the Scanpath Theory on The World Wide Web”, in ETRA 2002 Proc. of the Eye Tracking Research & Application Symposium, eds. Duchowski, A. T., Vertegaal, R. and Senders, J. W., pp. 43–49 (2002). (15) �Lewenstein, M., Edwards, G., Tatar, D. et al.: “Stanford Poynter Project” (2000). See http://www.poynter.org/ eyetrack2000/index.htm (16) �Goldberg, J. H., Stimson, M., Lewenstein, M. et al.: “Eye Tracking in Web Search Tasks: Design Implications” in ETRA 2002 Proc. of the Eye Tracking Research & Application Symposium, eds. Duchowski, A. T., Vertegaal, R. and Senders, J. W., pp. 51–58 (2002). (17) �Mayer, R. E., Sobko, K. and Mautone, P. D.: “Social Cues in Multimedia Learning: Role of Speaker’s Voice”, J. of Educational Psychology, Vol. 95, No. 2, pp. 419–425 (2003). (18) � Atkinson, R. K., Mayer, R. E. and Merrill, M. M.: “Fostering Social Agency in Multimedia Learning: Examining the Impact of an Animated Agent’s Voice”, Contemporary Educational Psychology, Vol. 30, No. 1, pp. 117–139 (2005). (19) �Brandt, S. A. and Stark, L. W.: “Spontaneous Eye Movements During Visual Imagery Reflect the Content of the Visual Scene”, J. of Cognitive Neuroscience, Vol. 9, No. 1, pp. 27–38 (1997). (20) �Salvucci, D. D. and Anderson, J. R.: “Automated EyeMovement Protocol Analysis”, Human–Computer Interaction, Vol. 16, No. 1, pp. 39–86 (2001). (21) �Dunn, R.: “Rita Dunn Answers Questions on Learning Styles”, Educational Leadership, Vol. 48, pp. 15–19 (1990). (22) �Felder, R. M. and Soloman, B. A.: “Index of Learning Styles Questionnaire” (1997). http://www.engr.ncsu.edu/ learningstyles/ilsweb.html (23) �Felder, R. M. and Spurlin, J.: “Reliability and Validity of the Index of Learning Styles: a Meta-analysis”, Int. J. of Engineering Education, Vol. 21, No. 1, pp. 103–112 (2005). (24) �Kraus, L., Reed, W. and Fitzgerald, G.: “The Effects of Learning Style and Hypermedia Prior Experience on Behavioral Disorders Knowledge and Time on Task: A Case-Based Hypermedia Environment”, Computers in Human Behavior, Vol. 17, pp. 125–140 (2001). (25) �Zywno, M. S.: “A Contribution of Validation of Score Meaning for Felder-Soloman’s Index of Learning styles”,
Jianxia Cao is a Ph.D. candidate in Education Technology of Human Science system in Tokyo Institute of Technology. Her research interests include eye tracking, learning style, e-learning and life-long learning.
Akinori Nishihara received his Dr. Eng. degree in electronics from Tokyo Institute of Technology in 1978. Since 1978 he has been with Tokyo Institute of Technology, where he is now Professor of the Department of Human System Science. His main research interests are in signal processing, and its application to educational technology. He is a Fellow of IEEE, a Fellow of IEICE, and a member of AACE, APSIAP, and Japan Society for Educational Technology. 12