tetramethyl-p-phenylenediamine (1 mM) in the presence of 5 mM ascorbate, 2 µM myxothiazol and 0.25 µM CCCP to obtain a fully uncoupled state [26]. State 3 ...
519
Biochem. J. (1997) 325, 519–525 (Printed in Great Britain)
Inhibition of glycerol metabolism in hepatocytes isolated from endotoxic rats Pascale LECLERCQ, Ce! line FILIPPI, Brigitte SIBILLE, Sarah HAMANT, Christiane KERIEL and Xavier M. LEVERVE* Laboratoire de Bioe! nerge! tique Fondamentale et Applique! e, Universite! Joseph Fourier, Ba# timent 72 Biologie, BP 53X, 38041 Grenoble-Cedex 09, France
Sepsis or endotoxaemia inhibits gluconeogenesis from various substrates, the main effect being related to a change in the phosphoenolpyruvate carboxykinase transcription rate. In addition, sepsis has been reported to affect the oxidative phosphorylation pathway. We have studied glycerol metabolism in hepatocytes isolated from rats fasted and injected 16 h previously with lipopolysaccharide from Escherichia coli. Endotoxin inhibited glycerol metabolism and led to a very large accumulation of glycerol 3-phosphate ; the cytosolic reducing state was increased. Furthermore glycerol kinase activity was increased by
33 % (P ! 0.01). The respiratory rate of intact cells was significantly decreased by sepsis, with glycerol or octanoate as exogenous substrates, whereas oxidative phosphorylation (ATPto-O ratio or respirations in state 4, state 3 and the oligomycininsensitive state as well as the uncoupled state) was unchanged in permeabilized hepatocytes. Hence the effect on energy metabolism seems to be present only in intact hepatocytes. An additional important feature was the observation of a significant increase in cellular volume in cells from endotoxic animals, which might account for the alterations induced by sepsis.
INTRODUCTION
hepatocyte isolation. As already reported [16], a plasma urea concentration above 6 mM is a good indicator of the endotoxic state ; in our model, the mean plasma urea concentrations were 4.2³0.9 (range 3.9–5.5) and 10.6³6 (range 7.2–30) mM respectively for controls and endotoxic rats (means³S.E.M.).
Alterations in carbohydrate metabolism are prominent effects of endotoxin and are classically related to inflammatory mediators and hormone release. However, when substrate delivery and hormonal milieu are controlled and standardized as in isolated, perfused systems, the rate of gluconeogenesis is still significantly depressed [1]. An inhibition of gluconeogenesis at the level of phosphoenolpyruvate carboxykinase has been largely recognized [2–5], although other effects on the gluconeogenic pathway are not excluded, for instance at the level of fructose 1,6bisphosphate}fructose 6-phosphate [6–8]. Besides its effect on the gluconeogenic pathway, an endotoxic state is also reported to affect cellular energy metabolism and particularly mitochondrial oxidative phosphorylation [9–12]. This led us to investigate the effects of endotoxin on glycerol metabolism because this gluconeogenic pathway is mainly controlled by the cellular redox state [13] and therefore depends strongly on mitochondrial function. Additionally, gluconeogenesis from glycerol does not involve phosphoenolpyruvate carboxykinase, enabling us to exclude any sepsis-related effect at the transcriptional level such as that reported recently [2]. We report here that sepsis exerts a strong effect on glycerol metabolism, as reflected by a large accumulation of glycerol 3phosphate.
MATERIALS AND METHODS Animals Male Wistar rats (200–250 g) were injected intraperitoneally at 18 : 00h with either saline (control group) or lipopolysaccharide from Escherichia coli (5 mg}kg body mass) and fasted for 16 h with free access to water. The following day at 10 : 00 h they were anaesthetized intraperitoneally with sodium thiopental (125 mg}kg). Hepatocytes were isolated by the method of Berry and Friend [14] as modified by Groen et al. [15]. In this model of mild endotoxaemia, the reality of the endotoxic state was always assessed by the measurement of plasma urea just before
Incubations in closed vials Hepatocytes (10 mg}ml of dry cells) were incubated in 1.5 ml Krebs bicarbonate buffer saturated with O }CO (19 : 1) con# # taining BSA (2 %, w}v) and Ca#+ ions (2.4 mM). Experiments were performed with or without 2 mM octanoate. At 0 and 15 min, samples were taken, quenched in HClO (0.4 g}l final % concentration) and neutralized with 2 M KOH}0.3 M Mops for the determination of ketone bodies. 3-Hydroxybutyrate and acetoacetate accumulation were measured enzymically as described by Bergmeyer [17]. Another aliquot was taken simultaneously for the fractionation of mitochondrial and cytosolic compartments by using the digitonin method as described by Zuurendonk and Tager [18]. ATP, ADP and AMP were determined in both cytosolic and mitochondrial compartments by HPLC as described previously [19]. Oxygen uptake was measured polarographically at 37 °C with a Clark electrode.
Perifusion of hepatocytes Liver cells (250 mg dry weight of cells in 15 ml) were perifused by the method of van der Meer and Tager [20] as modified by Groen et al. [15,21]. Hepatocytes were perifused at 37 °C at a flow rate of 5 ml}min with continuously gassed Krebs bicarbonate buffer (pH 7.4) saturated with O }CO (19 : 1) and con# # taining Ca#+ ions (1.3 mM). After 40 min, when a steady state had been reached, the cells were titrated with glycerol as indicated in the figures. Samples of perifusate were taken at every steady state for subsequent determinations of glucose, lactate and pyruvate. Proteins in the perifusate were denatured by heating the samples (80 °C for 10 min) before centrifugation [22]. During
Abbreviations used : CCCP, carbonyl cyanide m-chlorophenylhydrazone ; J, rate of metabolic flux. * To whom correspondence should be addressed.
520
P. Leclercq and others
the course of the perifusions, at each steady state, samples of cell suspension were removed from the chambers. Cellular content was separated from the extracellular medium by centrifugation of the cell suspension through a layer of silicone oil as described previously [21]. Another aliquot was taken simultaneously for fractionation of the mitochondrial and cytosolic compartments. The oxygen consumption rate was monitored by measuring the oxygen content of the perifusate with a Clark-type electrode. Glucose, lactate and pyruvate were measured in the perifusate ; dihydroxyacetone phosphate and glycerol 3-phosphate were measured in the cellular fraction. All determinations were made by enzymic procedures [17] with either spectrophotometric or fluorometric determination of NADH. ATP, ADP and AMP were determined in the cytosolic and mitochondrial compartments by HPLC.
trode. State 3 was obtained by the addition of 1 mM ADP ; three successive samples were taken from the chamber at intervals of 30 s for subsequent measurement of adenine nucleotide concentration to calculate the P-to-O ratio. Adenylate kinase flux was subtracted from ATP accumulation by subtracting the AMP net production. The uncoupled respiratory rate was obtained by the addition of 0.25 µM carbonyl cyanide m-chlorophenylhydrazone (CCCP), and the oligomycin-insensitive respiratory rate was measured after the addition of 6.25 µg}ml oligomycin. The cytochrome oxidase activity of permeabilized hepatocytes was obtained by the addition of saturating amounts of N,N,N«,N«tetramethyl-p-phenylenediamine (1 mM) in the presence of 5 mM ascorbate, 2 µM myxothiazol and 0.25 µM CCCP to obtain a fully uncoupled state [26]. State 3, state 4, uncoupled or oligomycin-insensitive respiratory rates were expressed as µmol of oxygen}min per arbitrary unit of cytochrome oxidase activity.
Glycerol kinase activity Liver samples were obtained and immediately frozen in liquid N # and stored at ®80 °C. They were crushed mechanically (Polytron2) and centrifuged at 12 000 g for 60 min. Glycerol kinase (EC 2.7.1.30) activity was determined spectrophotometrically at 25 °C in the supernatant [23]. Protein content was measured by the biuret method with BSA as standard. The activity of glycerol kinase was expressed as µmol}min per g of soluble protein.
Statistics Results are expressed as means³S.E.M. for the indicated sample size. Mean comparisons were obtained by using Student’s t test for unpaired samples. Collagenase A and enzymes were purchased from Boehringer, dihydroxyacetone and glycerol from Merck, and lipopolysaccharide of Escherichia coli serotype 0127 : B8 from Sigma. Rhodorsil silicone oil was purchased from Rho# ne-Poulenc.
Cytosolic glycerol-3-phosphate dehydrogenase (or glycerol-3phosphate oxidase) activity After the same extraction, glycerol-3-phosphate oxidase (EC 1.1.3.21) activity was measured spectrophotometrically at 25 °C in the supernatant and expressed as µmol}min per g of soluble protein.
Volume determination Hepatocytes were isolated as previously described and incubated in 1 ml of Krebs bicarbonate buffer with increasing concentrations of glycerol (0, 2.5, 5, 10, 20 and 40 mM). After 15 min of incubation 600 µl of cell suspension was taken and centrifuged for 3–4 s. The supernatant was completely removed and the pellet weighed (wet mass) before desiccation overnight at 100 °C. From the dry mass, the wet}dry ratio was calculated and the water content of the cell suspension determined.
Mitochondrial glycerol-3-phosphate dehydrogenase activity Glycerol-3-phosphate dehydrogenase (EC 1.1.1.8) activity was determined by measuring the oxygen uptake of isolated uncoupled mitochondria (disrupted by freezing) incubated with glycerol 3-phosphate (10 mM) and rotenone (1.25 µM) in the presence of cytochrome c (8 µM) at 20 °C. Enzyme activity is expressed as ng-atoms of oxygen}min per mg of protein. Protein content was measured by the biuret method.
Measurements of oxidative phosphorylation Hepatocytes were permeabilized by using a digitonin treatment (6 µg}mg of dry matter, 2 min ; 4 °C) as described [24,25]. After washing, cells were resuspended in an incubation medium containing : sucrose (0.25 M), Tris}HCl (20 mM) and EGTA (1 mM), pH 7.2. Cells were incubated at 37 °C in an oxygraph vessel in the same medium supplemented with 5 mM Pi and either (1) 5 mM succinate in the presence of rotenone (0.125 µM) or (2) glutamate}malate (6.25 and 1.25 mM respectively). Oxygen uptake was measured polarographically by using a Clark elec-
RESULTS Endotoxaemia in vivo inhibits glycerol metabolism As shown in Figure 1, injection of E. coli lipopolysaccharide resulted in a marked inhibition of glycerol metabolism in isolated rat hepatocytes. The total flux of glycerol (J glycerol) (Figure 1A) was expressed as 3 carbon equivalents through the summation of 2¬[glucose][lactate][pyruvate] production. In cells from control rats, glycerol metabolism (Figure 1A), gluconeogenesis (Figure 1B) and lactatepyruvate production (Figure 1C) increased when the perifused glycerol concentration was increased from 0 to 1 mM. Glycerol metabolism and the production of glucose and lactatepyruvate were lower in cells from lipopolysaccharide-treated rats than in controls. In contrast with observations in controls, glucose production was not sustained above 1 mM glycerol in the endotoxic group. Measurements of cellular glycerol 3-phosphate concentrations at successive steady states were also obtained to investigate the pathway downstream of glycerol kinase (Figures 1D, 1E and 1F). Results again indicate an inhibitory effect of sepsis leading to a larger increase in glycerol 3-phosphate accumulation contrasting a strong inhibition of the production of glucose as well as that of lactatepyruvate. Findings of group differences in the relationship between glycerol metabolism and glycerol 3-phosphate concentrations necessarily reflects an effect located downstream of glycerol kinase. In contrast, determinations of the relationships between dihydroxyacetone phosphate concentrations and each of the three metabolic fluxes to examine the pathway downstream of the oxidative step revealed an identical relationship in both groups (Figures 1G, 1F and 1H). This observation thus indicates that the major inhibitory effect of sepsis is located at the glycerol-3-phosphate dehydrogenase step, which concurs with the current knowledge on the role of the redox potential on glycerol metabolism. In contrast, the magnitude of the glycerol 3-phosphate accumulation led us to consider also a potential contribution of glycerol kinase.
Glycerol metabolism and endotoxic rats
Figure 1
521
Effect of endotoxin on glycerol metabolism
Hepatocytes (250 mg of dry cells in 15 ml) isolated from 16 h starved control (*) or endotoxin-treated (E) Wistar rats were titrated with glycerol as described in the Materials and methods section. The rate of glycerol metabolism (J glycerol ¯ 2¬[glucose][lactate][pyruvate]) was calculated from the glucose, lactate and pyruvate concentrations in the perifusate (see text for details). Intracellular glycerol 3-phosphate and dihydroxyacetone phosphate concentrations were measured in the neutralized cell fractions. Results are expressed as means³S.E.M. ; n ¯ 5 from five different cell preparations in each group.
Figure 2
Effect of endotoxin on cytosolic redox state indicators
Hepatocytes isolated from control (*) or endotoxin-treated (E) Wistar rats were perifused with increasing glycerol concentrations as described in the legend to Figure 1. Intracellular dihydroxyacetone phosphate and glycerol 3-phosphate concentrations were measured in the neutralized cell fractions ; lactate and pyruvate were determined from the perifusate. Results are expressed as means³S.E.M. ; n ¯ 5 from five different cell preparations in each group.
522 Table 1
P. Leclercq and others Evaluation of the hepatocyte volume by measuring the ratio of wet weight to dry weight
Hepatocytes isolated as previously described were incubated for 15 min in the presence of increasing concentrations of glycerol. Samples were taken to obtain the wet weight of the cells and, after desiccation, the dry weight ; the estimated ratio of wet weight to dry weight is (wet weight®dry weight)/dry weight. The P (t-test) row shows the P values for the differences between endotoxin and control values. Results are means³S.E.M. ; n ¯ 18 for the incubations without substrate and n ¯ 9 for the other conditions from three different animals in each group. (Wet wt.®dry wt.)/dry wt. [Glycerol] (mM) … 0 Control Endotoxic P (t test)
Figure 3
3.55³0.07 4.50³0.24 ! 0.001
2.5
5
10
20
40
3.72³0.08 4.59³0.4 ! 0.05
3.62³0.08 4.87³0.43 ! 0.01
3.67³0.1 4.71³0.34 ! 0.01
3.69³0.21 4.63³0.44 ! 0.05
3.63³0.12 4.72³0.38 ! 0.01
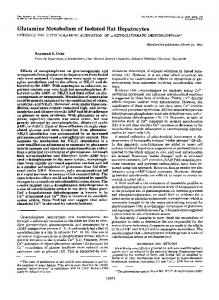
Effect of endotoxin on oxygen uptake, cytosolic and mitochondrial adenine nucleotide sum and ATP-to-ADP ratio
Hepatocytes isolated from control (*) or endotoxin-treated (E) Wistar rats were perifused with increasing glycerol concentrations as described in the legend to figure 1. Oxygen uptake was monitored by measuring the oxygen content of the perifusate with a Clark-type electrode. Cells were fractionated by the digitonin procedure. ATP, ADP and AMP were measured in each compartment by HPLC. Results are expressed as means³S.E.M. ; n ¯ 5 from five different cell preparations in each group.
Change in glycerol kinase activity and in cellular volume induced by sepsis
Effect of sepsis on cytosolic redox potential and glycerol oxidation
Glycerol kinase activity was significantly higher in cells from endotoxic than control rats : 13.3³0.7 compared with 10.4³0.4 mol}min per mg of protein (n ¯ 8 for each group ; P ! 0.01). This increase could explain at least in part the 2–3-fold higher glycerol 3-phosphate accumulations observed in the endotoxic group (Figure 2A). In addition, cellular volume was significantly higher in the endotoxic group than in controls, which could be related to a higher cellular osmolality resulting from the glycerol 3-phosphate accumulation. However, as shown in Table 1, results indicate a significantly larger hepatocyte volume in endotoxic group under baseline conditions that is not affected by increasing glycerol concentrations.
The glycerol 3-phosphate accumulation (Figure 2A) in the endotoxic group was accompanied by a halving of the dihydroxyacetone phosphate concentration (Figure 2B) ; consequently the glycerol 3-phosphate-to-dihydroxyacetone phosphate ratio, an indicator of the cytosolic redox state, was much higher. This is in agreement with an inhibition of glucose production because an increase in the cytosolic reducing state inhibits gluconeogenesis from glycerol [22,27,28]. Plotting the glycerol 3-phosphate-todihydroxyacetone phosphate ratio against J for glycerol indicates different relationships between groups ; for any given ratio, the net flux was nearly 2-fold higher in controls than in endotoxic rats. Moreover, whereas in the endotoxic group ratios of glycerol
523
Glycerol metabolism and endotoxic rats Table 2
Octanoate metabolism in hepatocytes from endotoxic rats
Hepatocytes were isolated as described in the legend to Figure 1 and incubated in closed vials with a medium supplemented with octanoate (2 mM). O2 uptake was obtained after incubation in an oxygraph vessel with a Clark electrode. Ketone body production and the 3-hydroxybutyrate-to-acetoacetate ratio were determined from 3-hydroxybutyrate and acetoacetate accumulation during the 15 min of incubation. After 15 min of incubation, aliquots were removed for rapid separation of mitochondria and cytosol by the digitonin fractionation procedure. ATP and ADP concentrations (µmol/g of dry cells) were measured in each compartment by HPLC. Results are means³S.E.M. ; n ¯ 20 from three different cell preparations. *P ! 0.05.
J O2 ( µmol/min/g) Endogenous metabolism Control 13.7³0.4 Endotoxic 12.8³0.3 Octanoate metabolism Control 29.0³0.9 Endotoxic 25.6³0.5*
β-OH-Butyrate acetoacetate ( µmol/15 min per g)
β-OH-Butyrate/ acetoacetate
Mitochondrial
Cytosolic
[ATP][ADP] intracellular ( µmol/g)
42.7³1.7 38.2³0.8
0.07³0.01 0.08³0.01
2.05³0.09 1.92³0.05
12.4³0.7 12.8³0.8
16.7³0.25 17.5³0.7
124³5.4 114³6.3
0.69³0.04 0.66³0.06
1.63³0.15 1.72³0.11
12.4³0.5 12.5³0.6
16.6³0.22 16.9³0.6
3-phosphate to dihydroxyacetone phosphate as high as 1000 were observed at the peak of glycerol in the perifusate, values in the control group never exceeded 200. Classically, both the lactate-to-pyruvate ratio and the glycerol 3-phosphate-to-dihydroxyacetone phosphate ratio are reported to be at a near-equilibrium state with the cytosolic NADH-toNAD+ ratio and are thus indicators of the cytosolic reducing state [29]. Figure 2(C) shows a rightward shift in the relationship between the lactate-to-pyruvate ratio and J for glycerol in the endotoxic group. Results show that the flux is lower for any given ratio and that, in contrast with results for the ratio of glycerol 3-phosphate to dihydroxyacetone phosphate, the absolute values of this ratio never exceeds those of the control group. The very large accumulation of glycerol 3-phosphate for lower dihydroxyacetone phosphate concentrations in the endotoxic group could result from kinetic constraints secondary to a decrease in glycerol-3-phosphate oxidase activity. However, this seems unlikely because determination of this activity on intact liver (freeze clamped) indicated a slight although significant increase in cells from endotoxic rats when compared with controls (87.6³3.8 compared with 62.5³8.2 units}mg of soluble protein ; P ! 0.05, n ¯ 8 in each group). The determination of mitochondrial glycerol-3-phosphate dehydrogenase activity showed a slight although non-significant difference between control and endotoxic-treated rats (0.92³0.11 compared with 1.25³0.07 natoms of oxygen}min per mg of mitochondrial protein ; n ¯ 8 in each group ; P " 0.05).
Effect of sepsis on hepatocyte energy metabolism The endotoxin-induced increase in cytosolic reducing state could be explained by changes in the oxidative phosphorylation pathway. Figure 3(A) shows a significantly lower respiratory rate of hepatocytes from the endotoxic group perifused with increasing concentrations of glycerol. As shown in Figure 3(B), the mitochondrial ratio of ATP to ADP declined with increasing glycerol concentrations. The mitochondrial ATP-to-ADP ratio and also the sum of ATP, ADP and AMP (Figures 3B and 3C) were not different between groups of cells. Conversely, in the cytosol, cells from the endotoxic group exhibited an ATP-to-ADP ratio and a sum of adenine nucleotides that were significantly lower, the difference between groups becoming larger with increasing glycerol concentration. These changes in the oxidative pathway could be accounted for either by a decrease in the transport of reducing equivalents across the inner mitochondrial membrane, an inhibitory effect on the oxidative pathway or a combination
ATP-to-ADP ratio
Table 3 Effects of endotoxin treatment on oxidative phosphorylation in permeabilized hepatocytes Hepatocytes permeabilized as described in the Materials and methods section were incubated in an oxygraph vessel with a medium supplemented with either 6.25 mM glutamate and 1.25 mM malate or 5 mM succinate and 0.125 µM rotenone. The state 3 respiratory rate was obtained by the addition of 1 mM ADP, the oligomycin-insensitive respiratory rate by the addition of 6.25 µg/ml oligomycin and the uncoupled respiratory rate by the addition of 0.25 µM CCCP. The ATP-to-O ratio was obtained from the simultaneous measurements of net ATP production and oxygen in state 3 (see the text). Respiratory rates were expressed as µmol of oxygen/min per unit of cytochrome oxidase activity, which was obtained by the addition of N,N,N«,N«-tetramethyl-p-phenylenediamine (1 mM) in the presence of myxothiazol (2 µM), ascorbate (5 mM) and CCCP (0.25 µM). Results are means³S.E.M. ; n ¯ 12 from three different cell preparations in each group. Respiratory rate ( µmol of O2/min per cytochrome oxidase arbitrary unit) State 3 Glutamate/malate Control 1.63³0.07 Endotoxic 1.47³0.10 Succinate Control 2.62³0.17 Endotoxic 2.33³0.79
State 4
Oligomycin
CCCP
ATP-to-O ratio
0.71³0.07 0.66³0.04
0.47³0.04 0.47³0.02
1.48³0.11 1.53³0.13
2.76³0.64 2.69³0.63
0.99³0.03 1.01³0.07
0.86³0.06 0.94³0.04
2.71³0.24 2.16³0.12
1.56³0.09 1.41³0.13
of both. Considering that octanoate is a medium-chain fatty acid that is activated and β-oxidized in the mitochondrial matrix, its metabolism can be examined to circumvent the step of mitochondrial transport of reducing equivalents. Table 2 shows that cells from endotoxic rats had a significantly (10 %) lower respiratory rate in the presence of octanoate. Ketone body production and the ketone body ratio were similar in both groups, as were cytosolic and mitochondrial adenine nucleotides.
Effect of sepsis on oxidative phosphorylation Table 3 provides values of oxygen consumption of permeabilized hepatocytes incubated in the presence of the substrates glutamate}malate or succinate. Respiratory rates are expressed as a percentage of cytochrome oxidase activity (see the Materials and methods section). No significant differences in state 3, state 4, oligomycin-insensitive or uncoupled respiratory rates were found between permeabilized liver cells from controls and endotoxin-treated rats, independent of substrate, i.e. glutamate}
524
P. Leclercq and others
malate or succinate. Similarly, the ATP-to-O ratios were identical in both groups, regardless of the substrate.
DISCUSSION Changes in liver metabolism during experimental sepsis have been widely reported by using various experimental models. The use of the intraperitoneal bacterial lipopolysaccharide injection model enables the severity of sepsis to be modulated in a reproducible manner. In the present study we selected the induction of a mild and reversible endotoxic stress to avoid the major haemodynamic effects of severe sepsis during which changes in cellular energy can no longer be attributed to specific characteristics of the endotoxic state. A small number of rats (10–15 %) failed to respond to the endotoxin injection as suggested by the absence of an increase in blood urea, which appears to be the most sensitive indicator of a septic state in this model [7] ; they were therefore eliminated. The marked inhibition of glycerol metabolism found in the present study is in agreement with previous findings [16], although an absence of change has also been reported [6]. This effect is unlikely to be due to a lower cell viability in the endotoxic group because Trypan Blue exclusion determinations before using the cells did not exhibit differences. In addition, no differences in mitochondrial adenine nucleotide content or ATP-to-ADP ratio were observed between groups, which strongly argues against a decrease in cell viability. Under the present experimental conditions the results (Figures 1H and 1I) suggest that the endotoxininduced effect on glycerol metabolism occurs upstream of dihydroxyacetone phosphate. This observation allows us to exclude any major effect on the fructose cycle with glycerol as substrate, which is in accordance with recent results [7] but in contrast with other previous data [6]. The investigation of the glycerol pathway provides the opportunity for investigating several steps of the oxidative pathway of intact cells [14,22,28,30] and allowed us to address our second main finding, the accumulation of glycerol 3-phosphate, which is well established in normal cells [31] but is largely amplified by endotoxin. Glycerol phosphorylation by glycerol kinase is strongly related to the cellular energy state and, as shown by Robinson and Newsholme [32], the activation of this enzyme is completely dependent on the substrate concentration of glycerol and ATP because when ATP is low, glycerol is unable to activate glycerol kinase. This is in contrast with the larger glycerol 3phosphate accumulation found in the endotoxic group despite a decrease in the ATP-to-ADP ratio. This latter effect could be related to an increase in glycerol kinase activity, although a change in glycerol transport across the plasma membrane cannot be excluded. Indeed, it has been shown that tumour necrosis factor α might be responsible for an increase in some amino acid carriers on the plasma membrane of hepatocytes [33,34] ; a similar effect could occur for glycerol although its transport has not been well characterized [35]. The sum and ratio of cytosolic nucleotides (ATP, ADP) were significantly lower in the endotoxic group owing to the larger glycerol 3-phosphate accumulation leading to a decrease in the cytosolic Pi concentration and in turn, in the sum and ratio of adenine nucleotides. A decrease in gluconeogenesis from glycerol is associated with a change in cellular redox state owing to a change in the transfer of reducing equivalents into the matrix or in oxidative phosphorylation, or in both. Because we failed to observe any effect of endotoxin on the respiratory rate or on the ATP-to-O ratio of permeabilized hepatocytes, a disturbance in the oxidative pathway seems unlikely. Considering the existing controversy surrounding the effects of endotoxin on mitochondrial oxidative
phosphorylation this observation seems significant. In addition we have failed to find any effect of endotoxin on oxidative phosphorylation in liver mitochondria isolated from endotoxic rats (results not shown). We chose to study permeabilized hepatocytes because this model allows the investigation of the potential role of the outer membrane, which has been reported to have a role in the regulation of oxidative phosphorylation [24,25,36]. It is of interest to note that the ATP-to-O ratios reported here at 37 °C, both with succinate and glutamate} malate, are not affected by endotoxin but remain very close to the classical values reported in the literature for isolated mitochondria incubated at 25 °C. Hence, although it was reported that the proton leak across the inner mitochondrial membrane might be increased at 37 °C [37] this did not affect the ATP-toO ratio in our state 3 condition. In addition, the use of permeabilized hepatocytes avoids the procedure of mitochondrial isolation, which might be associated with biases owing to differences in selective isolation between groups. Despite the lack of an effect of endotoxin on the mitochondrial oxidative phosphorylation of permeabilized hepatocytes and in spite of a relative discrepancy between indicators, a significantly more reduced cytosolic redox state was observed in the endotoxic group (Figure 2). It is classically admitted that under such experimental conditions lactate dehydrogenase is near equilibrium and hence reflects the cytosolic NADH-to-NAD+ ratio [29]. The glycerol 3-phosphate-to-dihydroxyacetone phosphate ratio also reflects the cytosolic redox state because this step is believed to be near equilibrium state. In theory, the observation of a disturbance in the equilibrium of this step in the endotoxic group could be explained by an increase in the enzymic activity or in the flux of glycerol metabolism, which is contrary to the present findings of an increase in enzyme activity and a decrease in glycerol metabolism. In fact, the glycerol 3-phosphate-todihydroxyacetone phosphate ratio reflects the cytosolic redox state only when glycerol 3-phosphate oxidation is catalysed almost exclusively by the cytosolic glycerol-3-phosphate oxidase. This is indeed true when glycerol 3-phosphate concentration is low because the flux through the mitochondrial membranebound glycerol-3-phosphate dehydrogenase depends on substrate concentration [38] except of course in conditions of hyperthyroidism. However, when the concentration of glycerol 3phosphate rises, as in the presence of glycerol, the ratio, rather than reflecting cytosolic redox state, reflects the steady-state concentration of intermediates resulting from a two-step cycling (i.e. glycerol-3-phosphate oxidase and glycerol-3-phosphate dehydrogenase). Because there is a larger glycerol 3-phosphate accumulation in the endotoxic group than in the control group, it follows that the flux through the mitochondrial enzyme is also further increased. As this step provides reducing equivalents directly to ubiquinone, it is near equilibrium with the redox potential of this mitochondrial complex. Hence the higher the flux through the mitochondrial enzyme with respect to that in the cytosol, the higher the resulting glycerol 3-phosphate-todihydroxyacetone phosphate ratio, which, however, no longer reflects the actual cytosolic redox state. Despite the lack of supporting evidence, it is tempting to hypothesize that the change in cellular volume during sepsis might be related to the effects on cellular energy homoeostasis and to glycerol 3-phosphate accumulation. It is clear that changes in volume of many types of cell including hepatocytes might be related to numerous metabolic effects [39–43] and more specifically to effects on energy metabolism [42,43]. An effect of sepsis on hepatocyte volume similar to that found in the present study has been recently reported [44]. Such an effect of endotoxin was of a similar magnitude to that previously found with
Glycerol metabolism and endotoxic rats exogenous glutamine and was related to various metabolic events [45]. Finally, it has been shown that tumour necrosis factor α is able to stimulate the effect of glucagon on amino acid transport across the plasma membrane [33,44], as can be seen for alanine transport in hepatic membrane vesicles from endotoxin-treated rats [33,46]. The involvement of this mechanism in the cellular swelling of sepsis can thus not be excluded. We thank Dr. Alison Foote and He! le' ne Perrault for help in correcting the manuscript. This work was supported by the University J. Fourier and the region ‘ Rho# nes-Alpes ’.
REFERENCES 1 Filkins, J. P. and Cornell, R. P. (1974) Am. J. Physiol. 227, 778–781 2 Jones, C. J. and Titheradge, M. A. (1993) Biochem. J. 289, 169–172 3 Deutschman, C. S., De Maio, A., Buchman, T. G. and Clemens, M. G. (1993) Circ. Shock 40, 295–302 4 Horton, R. A., Knowles, R. G. and Titheradge, M. A. (1994) Biochem. Biophys. Res. Commun. 204, 659–665 5 Deutschman, C. S., De Maio, A. and Clemens, M. G. (1995) Am. J. Physiol. 269, R584–R591 6 Knowles, R. G., McCabe, J. P., Beevers, J. and Pogson, C. I. (1987) Biochem. J. 242, 721–728 7 Ceppi, E. D., Knowles, R. G., Carpenter, K. M. and Titheradge, M. A. (1992) Biochem. J. 284, 761–766 8 Miller, B. C., Ishikawa, E., Uyeda, K. and Cottam, G. L. (1989) Biochem. Biophys. Res. Commun. 165, 1072–1078 9 Mela, L., Miller, L. D., Diaco, J. F. and Sugerman, H. J. (1970) Surgery 68, 541–549 10 Gitomer, W. L., Miller, B. C. and Cottam, G. L. (1995) Metabolism 44, 1170–1174 11 Lancaster, J. R., Laster, S. M. and Gooding, L. R. (1989) FEBS Lett. 248, 169–174 12 Jacobson, D. and Singer, M. (1996) in Yearbook of Intensive Care and Emergency Medicine (Vincent, J. L., ed.), pp. 263–274, Springer, Berlin 13 Berry, M. N., Kun, E. and Werner, H. V. (1973) Eur. J. Biochem. 33, 407–417 14 Berry, M. N. and Friend, D. S. (1969) J. Cell Biol. 43, 506–520 15 Groen, A. K., Sips, H. J., Vervoorn, R. C. and Tager, J. M. (1982) Eur. J. Biochem. 122, 87–93 16 Horton, R. A., Ceppi, E. D., Knowles, R. G. and Titheradge, M. A. (1994) Biochem. J. 299, 735–739 17 Bergmeyer, H. U. (ed.) (1974) in Methods in Enzymatic Analysis, pp. 1196, 1314, 1415, 1446, 1464, 1836–1843, Academic Press, New York Received 24 October 1996/20 February 1997 ; accepted 20 March 1997
525
18 Zuurendonk, P. F. and Tager, J. M. (1974) Biochim. Biophys. Acta 333, 393–399 19 Argaud, D., Roth, H., Wiernsperger, N. and Leverve, X. M. (1993) Eur. J. Biochem. 213, 1341–1348 20 van der Meer, R. and Tager, J. M. (1976) FEBS Lett. 67, 36–40 21 Groen, A. K., Vervoorn, R. C., van der Meer, R. and Tager, J. M. (1983) J. Biol. Chem. 258, 14346–14353 22 Leverve, X. M., Verhoeven, A. J., Groen, A. K., Meijer, A. J. and Tager, J. M. (1986) Eur. J. Biochem. 155, 551–556 23 Hogeboom, G. H. (1955) Methods Enzymol. 1, 16–19 24 Saks, V., Belikova, Y., Vasileya, E., Kuznetsov, A., Fontaine, E., Keriel, C. and Leverve, X. (1995) Biochem. Biophys. Res. Commun. 208, 919–926 25 Fontaine, E., Keriel, C., Lantuejoul, S., Rigoulet, M., Leverve, X. and Saks, V. (1995) Biochem. Biophys. Res. Commun. 213, 138–146 26 Murphy, P. M. and Brand, M. D. (1988) Eur. J. Biochem. 173, 645–651 27 Taylor, W. M., Reinhart, P. H. and Bygrave, F. L. (1983) Biochem. J. 212, 555–556 28 Leverve, X. M., Groen, A. K., Verhoeven, A. J. and Tager, J. M. (1985) FEBS Lett. 181, 81–84 29 Williamson, D. H., Lund, P. and Krebs, H. A. (1967) Biochem. J. 103, 514–527 30 Piquet, M. A., Fontaine, E., Sibille, B., Filippi, C., Keriel, C. and Leverve, X. M. (1996) Biochem. J. 313, 667–674 31 Lin, E. C. C. (1977) Annu. Rev. Biochem. 46, 765–795 32 Robinson, J. and Newsholme, E. A. (1969) Biochem. J. 112, 455–464 33 Pacitti, A. J., Augsten, T. R. and Souba, W. W. (1991) J. Surg. Res. 51, 46–53 34 Widnell, C. C., Baldwin, S. A., Davies, A., Martin, S. and Pasternak, C. A. (1990) FASEB J. 4, 1634–1637 35 Li, C. C. and Lin, E. C. C. (1975) Biochem. Biophys. Res. Commun. 67, 677–682 36 Saks, V., Khuchua, Z. A., Vasilyeva, E. V., Belikova, O. Y. and Kuznetsov, A. V. (1994) Mol. Cell. Biochem. 133/134, 155–192 37 Canton, M., Luvisetto, S., Schmehl, I. and Azzone, G. F. (1995) Biochem. J. 310, 477–481 38 Meijer, A. J. and Van Dam, K. (1974) Biochim. Biophys. Acta 346, 215–244 39 Ha$ ussinger, D., Lang, F. and Gerok, W. (1994) Am. J. Physiol. 267, E343–E355 40 Meijer, A. J., Baquet, A., Gustafson, L., van Woerkom, G. and Hue, L. (1992) J. Biol. Chem. 267, 5823–5828 41 Baquet, A., Maisin, L. and Hue, L. (1991) Biochem. J. 278, 887–890 42 Halestrap, A. P. and Dunlop, J. L. (1986) Biochem. J. 239, 559–565 43 Devin, A., Guerin, B. and Rigoulet, M. (1996) Biochim. Biophys. Acta 1273, 13–20 44 Qian, D. and Brosnan, J. T. (1996) Biochem. J. 313, 476–486 45 Ha$ ussinger, D. and Lang, F. (1990) Biochim. Biophys. Acta 1071, 331–350 46 Warren, R. S., Donna, D. B., Starnes, J. F. and Brennan, M. F. (1987) Proc. Natl. Acad. Sci. U.S.A. 84, 8619–8622