Initial versus Delayed Acute Renal Failure in the Intensive Care Unit A Multicenter Prospective Epidemiological Study CLAUDE GUERIN, RAPHAELE GIRARD, JEAN-MARC SELLI, JEAN-PIERRE PERDRIX, and LOUIS AYZAC for the Rhône–Alpes Area Study Group on Acute Renal Failure Service de Réanimation Médicale et Assistance Respiratoire, Hôpital de la Croix-Rousse, Lyon, France; and Service d’Hygiène Hospitalière et d’Épidémiologie, Service de Réanimation Médicale, Service de Réanimation Polyvalente, and Centre de Coordination de la Lutte contre les Infections Nosocomiales Sud-Est, Pierre Benite, France
We performed a prospective study in the 28 multidisciplinary intensive care units (ICUs) in the Rhône– Alpes area in France to investigate the role of initial versus delayed occurrence of acute renal failure (ARF) in patient outcome. ARF was defined as a serum creatinine concentration ⬎ 300 mol/L, urine output ⬍ 500 ml/24 h (or ⬍ 180 ml/8 h), or hemodialysis requirement. Over the 1-yr study period, 1,086 patients presented with ARF on ICU admission or during the first 2 d of ICU stay (Group A; 736 patients), from Day 3 to Day 6 (Group B; 202 patients), or from Day 7 (Group C; 148 patients). The overall hospital mortality rate was 66% (61% in Group A, 71% in Group B, and 81% in Group C; p ⬍ 0.0001). Logistic regression analysis of a random sample of 510 patients showed that SAPS II score on ICU admission, number of ARF episodes, previous health status, absence of oliguria, absence of hemodialysis, and absence of ischemic acute tubular necrosis were predictive of patient survival. This model was tested and validated on the basis of the remaining patients. Thus, in this population, late ARF was not a predictive factor for patient outcome. Guerin C, Girard R, Selli J-M, Perdrix J-P, Ayzac L, for the Rhône–Alpes Area Study Group on Acute Renal Failure. Initial versus delayed acute renal failure in the intensive care unit: a multicenter prospective epidemiological study. AM J RESPIR CRIT CARE MED 2000;161:872–879.
(Received in original form September 14, 1998 and in revised form June 29, 1999) Members of the Rhône–Alpes Area Study Group on Acute Renal Failure: Participating Centers (ICUs listed in order of the number of patients enrolled): Medical ICU Grenoble Hospital: M. C. Herault; Medical ICU Croix-Rousse Hospital Lyon: D. Dorez, L. Heyer; Medical ICU Edouard Herriot Hospital Lyon: Y. Bouffard; General Hospital Roanne: P. Beuret; Medical ICU Lyon Sud Hospital: J. Bohé; General Hospital Annecy: M. Sirodot; Medical ICU Saint-Etienne Hospital: P. Gery; General Hospital Valence: J. Persico; Clinique du Tonkin Villeurbanne: Ph. Gaussorgues; Polyvalent ICU Lyon Sud Hospital: J. P. Perdrix; Saint Joseph Hospital Lyon: S. Rosselli; Polyvalent ICU Saint Etienne: R. Jospé; Hôpital d’Instruction des Armées Lyon: J. P. Straboni; Surgical ICU Hôpital Cardiologique Lyon: O. Bastien; Polyvalent ICU Grenoble Hospital: J. Duret, M. Durand; Surgical ICU Edouard Herriot Hospital Lyon: I. Mohamedi; General Hospital Chambery: J. Fogliani; General Hospital Annonay: B. Bedock; Surgical ICU Grenoble Hospital: P. Lavagne: Saint Luc Hospital Lyon: C. Pommier; General Hospital Romans: G. Bonnefoy; General Hospital Bourg en Bresse: G. Demingeon, L. Holzapfel; General Hospital Belley: D. Anki, P. Mermet; General Hospital Villefranche: D. Peillon, C. Combe; Clinique Mutualiste Saint Etienne: B. Stiemmesse, E. Ezingeard; General Hospital Aubenas: P. Michel, P. Fernandez; General Hospital Montbrison: J. P. Chaussinand; General Hospital Firminy: P. Mathern. Steering Committee: O. Bastien, D. Dorez, R. Girard, C. Guérin, R. Jospé, J. P. Perdrix, J. M. Selli. Coordinating Center: Service d’Hygiène Hospitalière et d’Epidémiologie Lyon Sud Hospital: R. Girard. Sponsor: Hospal France: G. Richallet. Cosponsor: Association pour la Recherche Biomédicale Hôpital Saint-Eugénie Lyon. Supported by a grant from Hospal France and cosponsored by the Association pour la Recherche Biomédicale Hôpital Sainte-Eugénie Lyon, France. Correspondence and requests for reprints should be addressed to Claude Guerin, M.D., Service de Réanimation Médicale et Assistance Respiratoire, Hôpital de la Croix-Rousse, 103 grande rue de la Croix-Rousse, 69004 Lyon, France. E-mail:
[email protected] Am J Respir Crit Care Med Vol 161. pp 872–879, 2000 Internet address: www.atsjournals.org
Acute renal failure (ARF), which is a syndrome rather than a disease, may have numerous causes and can be observed in a wide range of clinical settings. The mortality associated with ARF is high (about 50 to 60%) and stable over time (1). This high mortality rate is still observed despite marked advances in hemodialysis techniques. Controlled studies have shown that the nature of hemodialysis membranes can affect the mortality rate in ARF (2–4). More accurate identification of the factors associated with outcome in patients with ARF is, therefore, a crucial issue. A review of the literature shows that there are some methodological problems with published epidemiological studies. For example, the definition of ARF differs, from different levels of increase in serum creatinine to dialysis requirement (1). The causes of ARF are important predictors of survival. A single nephrotoxic insult usually has a good prognosis, whereas for ARF in multiple organ dysfunction syndrome (MODF) the prognosis is poor. The causes of ARF currently observed in intensive care units (ICUs) are generally combined insults, such as hypotension, sepsis, and toxic exposure. The manner in which renal replacement therapy is used in ICUs has also changed. At present, we do not know the extent to which these changes have affected patient outcome. Some information is available from a few prospective multicenter epidemiological studies that applied multivariate analysis to data from a reasonable number of patients (5–7). However, the effect of ARF that is present at ICU admission or that develops during the ICU stay has been only scantly investigated. In a one prospective multicenter French
873
Guerin, Girard, Selli, et al.: Initial versus Delayed ARF in the ICU
study the delayed occurrence of ARF was identified by multivariate analysis as an independent predictive factor of in-hospital death (7). However, ARF was considered as being delayed when it occurred after the first day of the ICU stay. Some patients are admitted to the ICU with an ARF episode, but because not all the definition criteria are present initially, the patients are classified as having delayed ARF when they fulfill the criteria later. They should be classified as having ARF on admission. In the present study we aimed to improve the description of the time course of occurrence of ARF in a large number of patients and to test the hypothesis that acquired ARF is associated with a poorer prognosis than ARF present on ICU admission.
lar obstruction (thrombosis or emboli of the large renal artery). For each episode of ARF, the beginning and end dates, the renal function outcome, and the use of hemodialysis were recorded. The criteria for renal replacement therapy were not defined by a uniform protocol because the various centers had different practices. However, when hemodialysis was not performed, we determined whether this was due to the absence of indication, a rapid fatal issue for the patient, or a do-not-resuscitate order. The end of each ARF episode was defined as the disappearance of the three diagnostic criteria for ARF (8).
Patient Follow-up After inclusion, the patients were prospectively monitored up to hospital discharge on a regular basis. At discharge they were classified as dead or alive, and the data were used to calculate the in-hospital mortality rate.
METHODS This prospective, uncontrolled observational study was conducted from March 1, 1996 to the end of May 1997. The study involved a 12mo inclusion period and an additional 3-mo follow-up period.
Population All adult patients (age, ⬎ 18 yr) admitted to 1 of the 28 medical or medical–surgical ICUs in the Rhône-Alpes area of France between March 1, 1996 and February 28, 1997 with ARF present at the time of admission or occurring during the stay in the unit were included. These 28 ICUs represent all the multidisciplinary ICUs of the RhôneAlpes area (southeastern France), which is the second-largest area of France in terms of population. These ICUs had a total capacity of 313 active beds. During the study period there were 4,485,147 inhabitants over 18 yr of age in the area. Two specialized renal ICUs were excluded from the survey, because it was thought that the population would be different in these ICUs compared with the others. The 28 ICUs that participated in the study were located in 20 hospitals (12 general hospitals, 4 private hospitals, 3 university-teaching hospitals, and 1 military hospital). ARF was defined by the criteria of Fagon and coworkers (8), as a serum creatinine concentration ⬎ 300 mol/L, or a urine output ⬍ 500 ml/24 h (or ⬍ 180 ml/8 h), or the need for hemodialysis. Patients with chronic renal failure were included if their serum creatinine concentrations increased by more than 100% from their baseline values. Patients undergoing chronic dialysis were excluded, as were those transferred from another ICU.
Data Collection At time of ICU admission, the following variables were recorded: age, sex, identification of center, date of admission, Simplified Acute Physiology Score II (SAPS II) (9), MacCabe Scale of previous chronic health status (10) (level 0, no fatal disease; level 1, underlying disease expected to be fatal between 1 and 5 yr; and level 2, underlying disease expected to be fatal in less than 1 yr), main diagnosis, number and type of organ dysfunction (ODF) (8), infection (8), need for mechanical ventilation, origin (home, hospital, emergency room), and indication (medical, scheduled surgery, or emergency surgery) for ICU admission. According to Fagon and coworkers (8), infection was defined as the presence of one or more of the following criteria associated with clinical evidence of infection: two or more positive blood cultures or presence of gross pus in closed space or source of infection determined during hospitalization, or at autopsy in case of death within the 24 h. At time of ARF the following variables were recorded: date, SAPS II, number and type of ODF, including infection (8), need for mechanical ventilation, oliguria (daily diuresis ⬍ 500 ml) or nonoliguria (daily diuresis ⭓ 500 ml). The following variables, which are either possible mechanisms or etiologies of ARF, were also recorded: prerenal ARF (increase in urine output after volume expansion and/or diuretic therapy), shock (8), sepsis (8), toxic exposition, disseminated intravascular coagulation (DIC), hemolysis, acute pancreatitis, rhabdomyolysis, postrenal ARF (acute obstruction of the urinary tract), and vascu-
Statistical Analysis Definition of groups. Patients were grouped on the basis of the time delay to ARF occurrence: Group A. Criteria for ARF present on ICU admission or during the first two d of ICU stay Group B. Criteria for ARF present from Day 3 to 6 (inclusive) of ICU stay, with the suspected cause of the ARF episode not present on ICU admission Group C. Criteria for ARF present from Day 7 of ICU stay or after Patients were classified into the following five etiological categories on the basis of the suspected mechanisms of ARF: Prerenal ARF. Increase in urine output after volume expansion and/ or diuretic therapy without any other recognized cause Vascular obstruction. Thrombosis or emboli of a/the large renal artery(ies) without any other recognized cause Postrenal ARF. Acute obstruction of the urinary tract without any other recognized cause Acute tubular necrosis (ATN). ATN was subdivided into toxic exogenous ATN (exposure to antibiotic, contrast medium, or other nephrotoxic injury); toxic endogenous ATN (hemolysis, rhabdomyolysis); ischemic ATN (resulting from shock, DIC, or sepsis); and mixed ATN (resulting from both toxic and ischemic renal insults). Undertermined. The remaining cases were considered as having an undetermined etiology Analysis. Univariate comparisons were performed to compare patients in Groups A, B, and C, to compare survivors and nonsurvivors at hospital discharge. In the latter analysis, the time course of ARF occurrence was classified as early (definition for Group A, above) or late (definition for Group B or C, above). Because ischemic ARF was prevalent in our population, we defined two groups depending on the absence or presence of ischemic ATN. Univariate statistical analyses were performed by 2 tests for comparing proportions and by analysis of variance (ANOVA) for comparing means. We used a 2 test for linear trend analyses (extension of Mantel) to take into account the inherent order among the categories of ARF. Multivariate logistic regression analysis was performed, taking survival at hospital discharge as a dependent variable, and the variables found to be significant in the univariate analyses (p up to 0.10) for survivors and nonsurvivors as independent variables. In an initial phase, we applied the logistic regression model to a sample of 510 patients obtained computer-derived randomization (11). The ability of the subset of variables obtained from the logistic regression model to predict in-hospital survival was then tested in the 576 remaining patients. The power of the equation to predict in-hospital mortality was studied in this second set of patients by a receiver operating characteristic (ROC) curve. The odds ratios were used to estimate the association between the covariates and the dependent variable. The values are expressed as means ⫾ SD unless otherwise stated. A p value ⬍ 0.05 was considered significant (two-tailed). The data were analyzed with EPIInfo (version 5; Centers for Disease Control, Atlanta, GA) and SPSS software (version 7.5 for Microsoft Windows 95; SPSS, Chicago, IL).
874
AMERICAN JOURNAL OF RESPIRATORY AND CRITICAL CARE MEDICINE TABLE 1 CHARACTERISTICS OF PATIENTS WITH ARF AT ICU ENTRY Whole Population Group A Group B Group C (n ⫽ 1,086) (n ⫽ 736) (n ⫽ 202) (n ⫽ 148)
Variable* Age (yr), mean ⫾ SD Male, % MacCabe Scale, % 0 1 2 Reason for admission, % Medical Scheduled surgery Emergency surgery Origin of admission, % Home Hospital Emergency room
64 ⫾ 15 68
64 ⫾ 16 65
62 ⫾ 14 73†
65 ⫾ 13 73
44 40 16
44 42 14
43 37 20
46 35 19
65 10 25
70‡ 7 23§
57 17 26
51 17 32
15 67 18
16 66 18
15 69 15
11 68 21
Definition of abbreviations: ARF ⫽ acute renal failure; ICU ⫽ intensive care unit. * Percentages are relative to the number of patients in each group. † p ⬍ 0.05 versus Group A. ‡ p ⬍ 0.0001 versus Group B and versus Group C. § p ⬍ 0.05 versus Group C.
RESULTS Whole Population at ICU Entry
During the study period, 14,116 patients entered the 28 ICUs, and the overall mortality rate in the study period was 15% (95% confidence interval [CI], 8–22%). Among these patients, 1,086 (736 men) presented the criteria of ARF, either on admission or during the ICU stay, giving an overall incidence rate for ARF of 7.7% during the study period. The number of patients with ARF included by each center ranged from 2 to 102. Sixty-two patients had more than one ARF episode during the same ICU stay: 57 patients had 2 episodes, 3 patients had 3 episodes, and the remaining 2 had 4 episodes. The mean number
Time of ARF Occurrence
On the basis of the time of ARF occurrence in relation to ICU entry, 736 (68%) patients were classified as Group A, 202 (19%) patients as Group B, and 148 (13%) patients as Group C. Table 1 shows the distribution of age, sex, MacCabe Scale score, clinical indication for ICU admission, and origin of admission. Patients in Group A were less often male and more frequently admitted for a medical indication than those of the two other groups. The severity of patient illness at time of both ICU admission and ARF is shown in Table 2. At the time of ICU admission, the patients in Group A were more severely ill than those in the other two groups. The mean SAPS II score and the number of ODFs (including renal dysfunction) were significantly greater in Group A than in either of the other groups. The incidence of cardiovascular dysfunction was higher in Group A than in the other groups, and this significantly decreased across the groups. Similar findings were observed for hepatic, hematological, and neurological dysfunctions, although the difference was significant only between Groups A and C. Opposite results were found for respiratory dysfunction and the need for mechanical ventilation, which were less frequent in Group A, with the incidence significantly increasing from Group A to Group C. Infection was present in 36% of the entire population and its incidence was lower in Group A than in Group C. Except for the incidence of infection, Groups B and C were quite similar (Table 2). At time of ARF, the mean values of SAPS II were not different between the three groups. Between ICU admission and ARF occurrence, the mean values of SAPS II were unchanged in Group A but increased significantly in Groups B and C (p ⬍ 0.01). At the time of ARF, there were significantly more ODFs in Groups
TABLE 2
Variable*
Group A (n ⫽ 736)
2000
of ARF episodes per patient was not different between Groups A, B, and C. Mechanical ventilation, either invasive or noninvasive, was necessary for 806 (74%) patients.
SEVERITY OF PATIENT ILLNESS AT ICU ADMISSION AND AT TIME OF FIRST EPISODE OF ARF Whole Population (n ⫽ 1,086)
VOL 161
p Value
Group B (n ⫽ 202)
Group C (n ⫽ 148)
A versus B
A versus C
B versus C
SAPS II† Cardiovascular dysfunction, % Respiratory dysfunction, % Hepatic dysfunction, % Hematological dysfunction, % Neurological dysfunction, % Mechanical ventilation, % Number of organ dysfunctions†,‡ Infection, %
54 ⫾ 21 58 78 12 18 31 74 2.5 ⫾ 1.3 36
ICU Admission 59 ⫾ 22 45 ⫾ 15 61 53 75 83 13 11 20 18 33 26 71 79 2.9 ⫾ 1.3 1.9 ⫾ 1.0 36 32
42 ⫾ 14 49 85 7 10 25 85 1.8 ⫾ 0.9 46
⬍ 0.00001 ⬍ 0.05 ⬍ 0.01 NS NS NS ⬍ 0.05 ⬍ 0.00001 ⬍ 0.05
⬍ 0.00001 ⬍ 0.01 ⬍ 0.01 ⬍ 0.05 ⬍ 0.01 ⬍ 0.05 ⬍ 0.01 ⬍ 0.00001 ⬍ 0.05
NS NS NS NS NS NS NS NS ⬍ 0.01
SAPS II† Cardiovascular dysfunction, % Respiratory dysfunction, % Hepatic dysfunction, % Hematological dysfunction % Neurological dysfunction, % Mechanical ventilation, % Number of organ dysfunctions†,‡ Infection, %
59 ⫾ 21 58 78 12 18 31 74 2.5 ⫾ 1.3 37
First Episode of ARF 60 ⫾ 23 56 ⫾ 18 62 74 74 88 13.5 17 18 24 33 32 71 87 3.0 ⫾ 1.3 3.3 ⫾ 1.1 36 47
58 ⫾ 17 79 94 26 15 32 94 3.5 ⫾ 1.1 63
NS ⬍ 0.01 ⬍ 0.0001 ⬍ 0.001 NS NS ⬍ 0.0001 ⬍ 0.01 ⬍ 0.01
NS ⬍ 0.0001 ⬍ 0.00001 NS NS NS ⬍ 0.0001 ⬍ 0.0001 ⬍ 0.0001
NS NS NS NS NS NS ⬍ 0.05 NS ⬍ 0.01
Definition of abbreviations: ARF ⫽ acute renal failure; NS ⫽ not significant; SAPS II ⫽ Simplified Acute Physiology Score II. * Percentages are relative to the number of patients in each group. † Mean ⫾ SD. ‡ Including renal dysfunction.
875
Guerin, Girard, Selli, et al.: Initial versus Delayed ARF in the ICU TABLE 3 DIAGNOSTIC CRITERIA AND SEVERITY OF THE FIRST EPISODE OF ACUTE RENAL FAILURE Whole Population (n ⫽ 1,086)
Group A (n ⫽ 736)
Diagnostic criteria (alone or in combination), %* Serum creatinine 54 55 Oliguria 67 72 Hemodialysis† 37 34 Severity, %* Oliguria 72 73 Hemodialysis† 54 51
Group B (n ⫽ 202)
Group C (n ⫽ 148)
59 54 36
39 60 48
66 58
76 64
B, and C, respectively (p ⬍ 0.0001 between Groups A, B, and C). The mean duration of hospital stay was 22 ⫾ 25 d for the whole population, and 18 ⫾ 22, 24 ⫾ 26, and 39 ⫾ 31 d for Groups A, B, and C, respectively (p ⬍ 0.0001 between Groups A, B, and C). In-hospital Mortality
* Percentages are relative to the number of patients in each group. † p ⬍ 0.01 (2 for linearity trend).
B and C than in Group A. Between ICU admission and ARF, the mean number of ODFs was unchanged in Group A but increased significantly in Groups B and C (p ⬍ 0.01). Cardiovascular dysfunction was significantly more frequent in Groups B and C than in Group A. The criteria used for diagnosing the first episode of ARF are given in Table 3. Oliguria was the most frequent criterion used to define ARF, followed by serum creatinine and hemodialysis requirement. Only hemodialysis requirement was significantly different between Groups A, B, and C; the later the ARF, the more frequently hemodialysis requirement used as the diagnostic criterion for ARF. The mean values of serum creatinine at the time of ARF were 350 ⫾ 272 mol/L in Group A, 277 ⫾ 105 mol/L in Group B, and 238 ⫾ 107 mol/L in Group C (Group A versus B and Group A versus C, p ⬍ 0.0001; Group B versus C, p ⬍ 0.001). The occurrence of oliguria was similar in the three groups. Hemodialysis was more frequently required the later the ARF occurred after ICU admission. Hemodialysis was not undertaken in 517 patients for the following reasons: judged to be unnecessary by the attending physician in 316 patients (61%); do-not-resuscitate order in 113 patients (22%); and rapid death of the remaining 88 patients (17%). The etiological factors implicated in the first episode of ARF are listed in Table 4. The majority (83%) were due to ATN, with this being ischemic ATN most frequently. The second, but far less frequent, factor involved was prerenal mechanism. Ischemic ATN was more frequent in delayed ARF, whereas prerenal ARF was more frequent in earlier ARF. The average length of ICU stay was 16 ⫾ 21 d for the whole population, and 11 ⫾ 15, 19 ⫾ 20, and 37 ⫾ 29 d for Groups A,
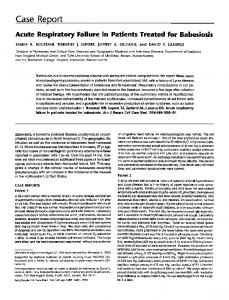
For all patients the in-hospital mortality rate was 66% (716/ 1,086); it was 61% (450 of 736) for Group A, 71% (144 of 202) for Group B, and 82% (122 of 148) for Group C (p ⬍ 0.0001 in a 2 test for linear trend between the three groups). Among the 517 patients who did not receive hemodialysis, the mortality rate was 61% (314 of 517), which is not significantly different from that for the overall population. However, all patients who did not receive hemodialysis because of a do-not-resuscitate order died. ARF was more frequently oliguric (82 versus 53%, p ⬍ 0.001), more frequently treated with hemodialysis (58 versus 46%, p ⬍ 0.001), more frequently delayed (37 versus 23%, p ⬍ 0.001), and more frequently due to ischemic ATN (66 versus 31%, p ⬍ 0.001) in nonsurvivors than in survivors (Table 5). Nonsurviving patients were older and had more severe illness than did survivors. Nonsurvivors were more frequently stage 1 or 2 on the MacCabe Scale and had transferred to the ICU from the hospital (Table 5). We randomly selected a sample of 510 patients from the total population. This sample did not differ from the overall population for the variables listed in Tables 1 to 4. The in-hospital mortality rate was 67% in the sample versus 66% in the overall population. Between sample and population, the mortality rates were 65 versus 68%, 22 versus 19% and 13 versus 13% (p ⫽ NS) in Groups A, B, and C, respectively. The differences between nonsurvivors and survivors were similar in the sample and the overall population, except for the origin of admission (Tables 5 and 6), thus confirming that the random sample was representative of the entire population. The covariates associated with in-hospital survival of the 510 patients are shown in Table 7. The probability of patient survival was reduced with increasing age, increasing values of SAPS II on ICU admission, increasing number of ARF episodes, and underlying rapid fatal illness (stage 2 of the MacCabe Scale). In contrast, the absence of oliguria, the absence of hemodialysis, and the absence of ischemic ATN were predictive of an increased survival probability. The model was tested and validated in the remaining 576 patients (Figure 1). The area under the ROC curve was 0.769 (95% CI ⫽ 0.732–0.803, SEM ⫽ 0.02).
TABLE 4 ETIOLOGICAL FACTORS OF THE FIRST EPISODE OF ACUTE RENAL FAILURE
Factor* Prerenal ARF, % Renal artery thrombosis, % Obstructive ARF, % Acute tubular necrosis Ischemic, % Endogenous toxic, % Exogenous toxic, % Mixed, % Undetermined, %
Group B (n ⫽ 202)
Group C (n ⫽ 148)
p Value
Whole Population (n ⫽ 1,086)
Group A (n ⫽ 736)
12 1 2
14 1 3
7 2 1
6 0 0
0.008 NS NS
0.006 NS 0.02
54 4 4 21 3
49 5 5 21 3
62 3 0 23 2
69 1 3 19 2
0.0005 NS 0.003 NS NS
0.000006 NS NS NS NS
Definition of abbreviations: ARF ⫽ acute renal failure; ATN ⫽ acute tubular necrosis; NS ⫽ not significant. * Percentages are relative to the number of patients in each group.
A versus B
A versus C
876
AMERICAN JOURNAL OF RESPIRATORY AND CRITICAL CARE MEDICINE
VOL 161
2000
TABLE 5
TABLE 6
SIGNIFICANT UNIVARIATE COMPARISONS BETWEEN SURVIVORS AND NONSURVIVORS AT TIME OF HOSPITAL DISCHARGE IN THE WHOLE POPULATION
UNIVARIATE COMPARISONS BETWEEN SURVIVORS AND NONSURVIVORS AT TIME OF HOSPITAL DISCHARGE IN 510 RANDOMLY SELECTED PATIENTS
Variable Age (yr), mean ⫾ SD* MacCabe Scale, n† 0 1 2 Origin of admission, n* Home Hospital Emergency room SAPS II, mean score ⫾ SD ICU admission† First ARF episode† Serum creatinine (mol/L), mean ⫾ SD ICU admission† First ARF episode† Number of ARF episodes* Number of organ dysfunctions, mean ⫾ SD‡ ICU admission† First ARF episode† Cardiovascular dysfunction, yes/no ICU admission† First ARF episode† Respiratory dysfunction, yes/no ICU admission† First ARF episode† Hepatic dysfunction, yes/no ICU admission† First ARF episode† Hematological dysfunction, yes/no ICU admission† First ARF episode† Neurological dysfunction, yes/no ICU admission† First ARF episode† Mechanical ventilation, yes/no ICU admission† First ARF episode† Infection, yes/no ICU admission§ First ARF episode† Oliguria, yes/no† Hemodialysis, yes/no† Early versus late ARF† Ischemic ATN, yes/no†
Nonsurvivors (n ⫽ 716)
Survivors (n ⫽ 370)
65 ⫾ 15
62 ⫾ 16
265 315 136
216 118 36
104 505 107
61 222 87
59 ⫾ 23 65 ⫾ 21
44 ⫾ 15 46 ⫾ 15
217 ⫾ 168 278 ⫾ 175 1.1 ⫾ 0.3
338 ⫾ 326 400 ⫾ 306 1.0 ⫾ 0.2
2.8 ⫾ 1.3 3.5 ⫾ 1.1
2.1 ⫾ 1.1 2.4 ⫾ 1.1
475/241 572/144
149/221 154/216
612/104 631/85
234/136 227/143
106/610 148/568
20/350 24/346
156/560 172/544
39/331 35/335
258/458 283/433
75/295 74/296
593/123 624/92
213/157 214/156
293/421 339/376 585/131 418/298 450/266 471/245
102/268 111/259 197/173 169/201 286/84 115/255
Variable Age (yr), mean ⫾ SD* MacCabe Score, n† 0 1 2 Origin of admission, n Home Hospital Emergency room SAPS II, mean score ⫾ SD ICU admission† First ARF episode† Serum creatinine (mol/L), mean ⫾ SD ICU admission† First ARF episode† Number of ARF episodes, mean ⫾ SD* Number of organ dysfunctions, mean ⫾ SD‡ ICU admission† First ARF episode† Cardiovascular dysfunction, yes/no ICU admission† First ARF episode† Respiratory dysfunction, yes/no ICU admission† First ARF episode† Hepatic dysfunction, yes/no ICU admission§ First ARF episode† Hematological dysfunction, yes/no ICU admission† First ARF episode† Neurological dysfunction, yes/no ICU admission§ First ARF episode† Mechanical ventilation, yes/no ICU admission† First ARF episode† Infection, yes/no ICU admission* First ARF episode* Oliguria, yes/no† Hemodialysis, yes/no§ Early versus late ARF* Ischemic ATN, yes/no†
Nonsurvivors (n ⫽ 343)
Survivors (n ⫽ 167)
64 ⫾ 15
61 ⫾ 17
126 150 67
102 47 18
53 231 59
30 97 40
59 ⫾ 23 65 ⫾ 20
45 ⫾ 15 47 ⫾ 16
214 ⫾ 181 279 ⫾ 185 1.1 ⫾ 0.3
299 ⫾ 261 380 ⫾ 238 1.0 ⫾ 0.2
2.8 ⫾ 1.3 3.5 ⫾ 1.1
2.1 ⫾ 1.2 2.5 ⫾ 1.2
235/108 284/59
80/87 81/86
294/49 301/42
112/55 108/59
57/286 74/269
11/156 13/154
77/266 87/256
17/150 17/150
118/225 124/219
35/132 35/132
280/63 295/48
102/65 102/65
148/194 159/183 273/70 194/149 213/130 225/118
52/115 55/112 88/79 74/93 121/46 49/118
Definition of abbreviations: ARF ⫽ acute renal failure; ATN ⫽ acute tubular necrosis; ICU ⫽ intensive care unit; SAPS II ⫽ Simplified Acute Physiology Score II. * p ⬍ 0.01. † p ⬍ 0.001 between survivors and nonsurvivors. ‡ Including renal dysfunction. § p ⬍ 0.05.
Definition of abbreviations: ARF ⫽ acute renal failure; ATN ⫽ acute tubular necrosis; ICU ⫽ intensive care unit; SAPS II ⫽ Simplified Acute Physiology Score II. * p ⬍ 0.05. † p ⬍ 0.001 between survivors and nonsurvivors. ‡ Including renal dysfunction. § p ⬍ 0.01.
DISCUSSION
mission was 4.5% (638 patients of 14,116 admissions) as compared with 26.4% of 1,070 consecutive admissions studied by Fagon and coworkers (8) between October 1, 1987 and March 1, 1990. This marked difference may be explained by differences in case mix, since our study was performed in 28 ICUs, and the Fagon and coworkers study was performed in 1 ICU (8). The overall incidence of ARF in ICUs was 242 cases per million in our study, a value that is relatively close to that of 209 cases per million reported in the Madrid area in 13 tertiary-care hospitals using, however, a different definition of ARF (13).
The results of our study, which is to date the largest multicenter prospective cohort of ICU ARF cases (12), showed the following in our sample: (1) the incidence of ARF in ICUs was 8% per year; (2) the in-hospital mortality rate was high (66%) and increased as ARF occurred later relative to ICU admission; and (3) after controlling for confounding factors, however, the time of occurrence of ARF was not predictive of patient outcome. Incidence of ARF
We used the definition of ARF introduced by Fagon and colleagues to build a new severity-of-disease classification model to predict ICU outcome (8). With the same definition, we found that the prevalence of ARF during the first 24 h after ICU ad-
Time of Occurrence of ARF
In our ARF population, failure was present in two-thirds of the patients at the time of ICU admission and occurred during
877
Guerin, Girard, Selli, et al.: Initial versus Delayed ARF in the ICU TABLE 7 RESULTS OF LOGISTIC REGRESSION ANALYSIS OF HOSPITAL SURVIVAL FOR THE 510 RANDOMLY SELECTED PATIENTS Variable Age ICU admission SAPS II Number of ARF epidsodes MacCabe Scale MacCabe level 2 MacCable level 0 Oliguria (absence of) Hemodialysis (absence of) Ischemic ATN (absence of) Constant

SE
Wald
OR
95% CI OR
p Value
⫺0.023 ⫺0.029 ⫺1.227
0.009 0.014 0.536
0.978 0.972 0.293
0.961–0.995 0.946–0.998 0.103–0.838
⫺0.329 0.571 0.548 0.581 1.162 ⫺2.083
0.395 0.279 0.281 0.271 0.289
6.699 4.479 5.241 7.401 0.696 4.186 3.805 4.583 16.180
0.720 1.770 1.729 1.788 3.197
0.332–1.559 1.024–3.058 0.997–2.999 1.050–3.043 1.815–5.632
0.0096 0.0343 0.0221 0.0247 0.4041 0.0408 0.0511 0.0323 0.0001
Definition of abbreviations: ARF ⫽ acute renal failure; ATN ⫽ acute tubular necrosis;  ⫽ regression coefficient; CI ⫽ confidence interval; ICU ⫽ intensive care unit; SE ⫽ standard error of ; OR ⫽ odds ratio; SAPS II ⫽ Simplified Acute Physiology Score II.
the ICU stay in the remaining third. Acquired ARF represented 2.5% of the 14,116 patients admitted to ICUs during the study period, which is somewhat lower that the previously published prevalence rates for acquired ARF: 14.9% (14) and 6.6% (15) in ICU; and 4.9% (16) in hospital. Differences in the definition of ARF, case mix, or sample size may explain these differences (14–16). Hypotension, sepsis, and toxic renal injury are well-recognized risk factors for hospital- or ICU-acquired ARF (14–18). Ischemic ATN was the major cause of ARF in our study, involving more than half of the patients. ATN was not biopsyproven in our study, but was, rather, a differential diagnosis; ischemic ATN was, nevertheless, significantly more frequent in late ARF than in early ARF. The data in Table 2 show clearly that this stems from the combined effect of shock and infection, since cardiovascular dysfunction and infection are more frequent in late ARF than in early ARF. Thus, it would seem that late ARF is related to nosocomial infection and septic shock. The ARF severity was different between early and late ARF. The serum creatinine level was significantly higher in early ARF than in late ARF, a finding already observed by Brivet and coworkers (7). This may be explained by a greater muscle mass in patients at the time of ICU admission, or con-
versely, by denutrition, or sepsis-induced protein breakdown, or dilution of extracellular fluid in patients with late ARF. Oliguria was as frequent in early as in late ARF in our study, whereas Brivet and coworkers (7) observed that the incidence of oliguria was 88 versus 52% in early and late ARF, respectively, an important difference that was reported not to be significant. However, by using the data provided in Table 2 in the report by Brivet and colleagues (7), we found that this difference was highly significant (2 ⫽ 41.68, p ⬍ 0.0000001). In our study, the need for hemodialysis was significantly higher in late ARF than in early ARF, although in late ARF the serum creatinine value was lower and the occurrence of oliguria was similar in both. Brivet and coworkers (7) observed opposite findings, with 86% of patients requiring hemodialysis in early ARF versus 45% in late ARF. Although the difference was reported as being not significant, when we recalculated using their data, we found a significant result (2 ⫽ 47.85, p ⬍ 0.0000001). In our study, the patients in Groups B and C had a poorer prognosis than those in Group A. This is due to two phenomena. First, by definition, the patients in Groups B and C were developing ARF during their ICU stay, and so their condition worsened. Second, they presented cardiovascular dysfunction and infection more frequently than did the patients in Group A. There was fewer differences in terms of other organ dysfunctions, and hence the total number of organ dysfunctions increased by twofold in patients in Groups B and C and was higher than that for patients in Group A, an observation that is in complete opposition to what was observed at the time of ICU admission. Therefore, the clinical condition of patients with late ARF declined after ICU admission, probably as a result of nosocomial infection in the majority of cases. It is, therefore, understandable that patients with late ARF died more often than those with early ARF. Similarly, Brivet and colleagues (7) showed that SAPS (19), APACHE II (20), and number of organ dysfunctions (21) increased from the time of ICU admission to ARF occurrence in patients with late ARF. However, at the time of ARF, the number of organ dysfunctions was not different, on average, between early and late ARF, suggesting that the increase in organ dysfunctions was due only to the occurrence of ARF. Consistently, in late ARF, the mean number of organ dysfunctions was lower than in our study (1.8 versus more than 3).
Figure 1. ROC curve of equation obtained by logistic regression of data collected from 510 randomly selected patients and tested in the remaining 576 patients.
Patient Outcome
The mortality rate was high in our study (66%) compared with that of 15% for the total admissions during the study period.
878
AMERICAN JOURNAL OF RESPIRATORY AND CRITICAL CARE MEDICINE
VOL 161
2000
TABLE 8 PROGNOSIS FACTORS FOR ACUTE RENAL FAILURE IN ICUs IN RECENT PUBLICATIONS AND IN THE PRESENT STUDY Ref.
Definition of ARF
Patients (n)
22
Dialysis
23 24
SCr ⬎ 280 mol/L or ↑ SCr by 100% if CRF Dialysis
25
CrCl , 50 ml/min
26
Dialysis
132
27
SCr ⬎ 150 mol/L
220
29
Dialysis
238
SCr ⭓ 310 mol/L ⫾ BUN ⭓ 36 mol/L Or ↑ 100% of SCr or BUN if previous SCr ⭓ 150 mol/L Present study SCr ⬎ 300 mol/L or urine output ⬍ 500 ml/d or ⬍ 180 ml/8 h Or need for hemodialysis or peritoneal dialysis 7
134 78 363 69
360
1,086
Study Design; Statistical Analysis
Mortality Rate
P, one center; LD R, one center; LR P, multicenter; multivariate R, one center; univariate R, one center; LR R, one center; univariate R, one center; prediction models P, multicenter; LR
56.7% ICU 63% ICU 79% ICU 78% ICU 70% hospital 54.5% hospital 76% hospital 58% hospital
P, multicenter; LR
66% hospital
Dialysis Use (%) 100 63 100 28 100 29 100
Predictors of Mortality Mechanical ventilation, low blood pressure Cardiovascular DF after ARF, pulmonary DF before ARF, cardiovascular DF before ARF, comnide therapy, age, CRF Number of ODF, APACHE II, preexisting chronic liver disease, number of days from ICU admission to institution of dialysis Septic severity score Mechanical ventilation, malignancy, nonrespiratory ODF Sepsis, heart failure APACHE III, severity index of ARF
48
Age, altered previous health status, hospitalization before ICU admission, delayed occurrence, sepsis, oliguria, severity of illness
54
Age, SAPS II on ICU admission, number of ARF episodes, previous health status, oliguria, hemodialysis, ischemic acute tubular necrosis
Definition of abbreviations: ARF ⫽ acute renal failure; BUN ⫽ blood urea nitrogen; CrCl ⫽ creatinine clearance; CRF ⫽ chronic renal failure; LD ⫽ linear discriminant analysis; LR ⫽ logistic regression analysis; ODF ⫽ organ dysfunction; P ⫽ prospective; R ⫽ retrospective; SCr ⫽ serum creatinine.
However, this level is in the range of that reported in the most recent studies conducted in ICUs (56.7 to 79%; Table 8). There are many mortality risk factors with interaction, so that multivariate analysis is required to take into account any confounding variables. In our study seven significant predictors of in-hospital survival were selected by the logistic regression analysis in the representative sample of 510 patients. Stage 2 of the MacCabe Scale and oliguria did not reach a significant difference. These covariates have previously been reported several times as risk factors (22–27). Many general scores assessing patient severity have been used to predict patient outcome in the event of ARF, such as SAPS, APACHE II, or APACHE III (28). To our knowledge, SAPS II has not been previously studied in this situation. We found that a high value for SAPS II at the time of ICU admission, but not at the time of ARF, predicted a low in-hospital survival. In the study by Brivet and colleagues (7), SAPS at the time of ARF, but not at the time of ICU admission, predicted a high in-hospital mortality. In their study, APACHE II was not predictive of patient outcome either at the time of ICU admission or at the time of ARF occurrence. We have suggested an explanation for these discrepant results for SAPS and SAPS II between the two studies. The power of APACHE II to predict mortality in ARF is controversial (22, 24, 26). Nevertheless, in light of the higher value of serum creatinine in the nonsurvivors than in survivors observed in our study, it may not be surprising that APACHE II does not predict outcome in ARF. Unlike SAPS and SAPS II, APACHE II includes serum creatinine, which has an increasing contribution to patient death as its value increases. Previous health status was found to be a significant contributing factor to patient outcome in our study. This was mainly due to the Level 0 score of the MacCabe scale, which significantly predicted patient survival. Previous health status, as assessed by another index, was also predictive of patient outcome in the study by Brivet and coworkers (7).
We found that no hemodialysis was a significant predictor of patient survival, as observed in the univariate analysis (i.e., mortality of 72% in patients who were dialyzed versus 62% in those who were not [2 ⫽ 6.76, p ⫽ 0.009, odds ratio 1.64, 95% CI 1.11–2.42]). This result was obtained despite the fact that hemodialysis was not offered to 64 patients owing to a do-notresuscitate order, all of whom died, and that 44 patients died rapidly, before hemodialysis could be performed. When these patients were excluded from the analyses, similar results were obtained. This observation raises the question of how to use renal replacement therapy in ICU. Does this finding suggest that hemodialysis performed in ICUs may be detrimental? Or does it mean that hemodialysis is not offered to the patients with less severe illness? This latter possibility is unlikely because the variable absence of hemodialysis is thought to predict patient outcome independently of the other covariates, particularly SAPS II. Brivet and coworkers (7) reported that the need for hemodialysis had an effect on mortality but only in their univariate analysis. None of the more recent studies on ARF has reported an effect of renal replacement therapy on patient outcome in multivariate analysis. In all of the centers involved in our study, biocompatible membranes were used, essentially polyacrylonitrile membranes. We are currently analyzing our data for the dialyzed patients. Delayed occurrence of ARF was not a risk factor for patient outcome after adjusting for confounding variables. Thus, although the mortality rate was higher when the onset of ARF was most delayed, late-onset ARF was not the sole factor explaining the outcome. This is in opposition to the results in the study by Brivet and colleagues (7), who found by logistic regression analysis that delayed ARF was a risk factor. Differences in definitions for ARF itself, or for late and early ARF, and in patient severity may explain this discrepancy. Finally, in our study, ischemic ATN was the most powerful prognosis factor with the highest odds ratio. This is not surprising since our etiological classification resulted in ischemic
Guerin, Girard, Selli, et al.: Initial versus Delayed ARF in the ICU
ATN being the most frequent cause of ARF. Moreover, ischemic ATN, as defined in our study, included shock and sepsis, which are well-recognized risk factors for mortality in ARF (17). Since ischemic ATN was highly correlated with cardiovascular dysfunction and infection, it is not surprising that these two other variables were not in our final model. One strength of our study is that our model has been validated internally. As shown in Figure 1, the ROC curve obtained in the test group was excellent. Douma and coworkers (29) retrospectively compared different models of outcome prediction in 238 patients with ARF treated by hemodialysis in a single ICU. Seven general prediction models, i.e., APACHE II, APACHE III, SAPS, SAPS extended (30), SAPS reduced (30), a sickness scoring model (31), and a mortality prediction model (32), and four specific prediction models for ARF (5, 6, 22, 33) were tested. APACHE III and the specific index of Liano and colleagues (6) were the most likely to identify the subgroup of patients with a quasi-100% in-hospital mortality despite dialysis. The area under the curve in our study was close to those obtained with APACHE III and the Liano equation (6) in the study of Douma and coworkers (29). In conclusion, our prospective multicenter study confirmed the consistently high mortality rate associated with ARF in ICUs in the late 1990s. Delayed occurrence of ARF during the ICU stay affected patient outcome only in univariate analysis. A model was developed on the basis of a random representative sample from our population, by logistic regression analysis, and this model was validated internally on the remaining patients. This model included the following factors: age, SAPS II on ICU admission, number of ARF episodes, MacCabe Scale, oliguria, hemodialysis, and ischemic ATN. Acknowledgment : The authors thank Ms. Margaret Haugh for reviewing the English in this article.
References 1. Druml, W. 1996. Prognosis of acute renal failure. 1975–1995. Nephron 73:8–15. 2. Schiffl, H., S. M. Lang, A. König, T. Strasser, M. C. Haider, and E. Held. 1994. Biocompatible membranes in acute renal failure: prospective case-controlled study. Lancet 344:570–572. 3. Hakim, R. M., R. L. Wigard, and R. A. Parker. 1994. Effect of dialysis membrane in the treatment of patients with acute renal failure. N. Engl. J. Med. 331:1338–1342. 4. Himmekfarb, J., N. Tolkoff-Rubin, P. Chandran, R. A. Parker, R. L. Wingard, and R. M. Hakim. 1998. A multicenter comparison of dialysis membranes in the treatment of acute renal failure requiring dialysis. J. Am. Soc. Nephrol. 9:257–266. 5. Rasmussen, H. H., E. A. Pitt, L. S. Ibels, and D. R. McNeil. 1985. Prediction of outcome in acute renal failure by discriminant analysis of clinical variables. Arch. Intern. Med. 145:2015–2018. 6. Liano, F., A. Gallego, J. Pascual, F. Garcia-Martin, J. L. Teruel, R. Marcén, L. Orofino, M. Rivera, N. Gallego, C. Quereda, and J. Ortuno. 1993. Prognosis of acute tubular necrosis: an extended prospective contrasted study. Nephron 63:21–31. 7. Brivet, F. G., D. J. Kleinknecht, P. Loirat, P. J. M. Landais, and the French Study Group on Acute Renal Failure. 1996. Acute renal failure in intensive care units–causes, outcome, and prognosis factors of hospital mortality: a prospective, multicenter study. Crit. Care Med. 24:192–198. 8. Fagon, J. Y., J. Chastre, A. Novara, P. Medioni, and C. Gibert. 1993. Characterization of intensive care unit patients using a model based on the presence or absence of organ dysfunctions and/or infection: the ODIN model. Intensive Care Med. 19:137–144. 9. Le Gall, J. R., S. Lemeshow, and F. Saunier. 1993. A new simplified acute physiology score (SAPS II) based on a European–North American multicenter study. J.A.M.A. 270:29057–29068. 10. MacCabe, W. R., and G. G. Jackson. 1962. Gram negative bacteremia, etiology and ecology. Arch. Intern. Med. 110:845.
879 11. Hosmer, D. W., and S. Lemeshow. 1989. Applied Regression Analysis. John Wiley & Sons, New York. 12. DuBose, T. D., D. G. Warnock, R. L. Metha, J. V. Bonventre, M. R. Hammerman, B. A. Molitoris, M. S. Paller, N. J. Siegel, J. Scherbenske, and G. E. Striker. 1997. Acute renal failure in the 21st century: recommendation for management and outcomes assessment. Am. J. Kidney Dis. 29:793–799. 13. Liano, F., and J. Pascual. 1996. Epidemiology of acute renal failure: a prospective, multicenter, community-based study. Kidney Int. 50:811– 818. 14. Menashe, P. I., S. A. Ross, and J. E. Gottlieb. 1988. Acquired renal insufficiency in critically ill patients. Crit. Care Med. 16:1106–1109. 15. Jochimsen, F., J.-J. Schäfer, A. Maurer, and A. Distler. 1990. Impairment of renal function in medical intensive care: predictability of acute renal failure. Crit. Care Med. 18:480–485. 16. Hou, S. H., D. A. Bushinsky, J. A. Wish, J. J. Cohen, and J. T. Harrington. 1983. Hospital-acquired renal insufficiency: a prospective study. Am. J. Med. 74:243–248. 17. Shusterman, N., B. L. Strom, T. G. Murray, G. Morrison, S. L. West, and G. Maislin. 1987. Risk factors and outcome of hospital-acquired acute renal failure. Am. J. Med. 83:65–71. 18. Neveu, H., D. Kleinknecht, F. Brivet, P. Loirat, and P. Landais. 1996. Prognostic factors in acute renal failure due to sepsis: results of a prospective multicentre study. The French Study Group on Acute Renal Failure. Nephrol. Dial. Transplant. 11:293–299. 19. LeGall, J. R., P. Loirat, A. Alperovitch, P. Glaser, C. Granthil, D. Mathieu, P. Mercier, R. Thoams, and D. Villers. 1984. A Simplified Acute Physiology Score for ICU patients. Crit. Care Med. 12:975–977. 20. Knaus, W. A., E. A. Draper, D. P. Wagner, and J. E. Zimmerman. 1985. A severity of disease classification system. Crit. Care Med. 13:818–829. 21. Knauss, W. A., E. A. Draper, D. P. Wagner, and J. E. Zimmerman. 1985. Prognosis in acute organ system failure. Ann. Surg. 202:685–693. 22. Schaefer, J. H., F. Jochimsen, F. Keller, K. Wegscheider, and A. Distler. 1991. Outcome prediction of acute renal failure in medical intensive care. Intensive Care Med. 17:19–24. 23. Groeneveld, A. B. J., D. D. Tran, J. van der Meulen, J. J. P. Nauta, and L. G. Thijs. 1991. Acute renal failure in the medical intensive care unit: predisposing, complicating factors and outcome. Nephron 59: 602–610. 24. Cosentino, F., C. Chaff, and M. Piedmonte. 1994. Risk factors influencing survival in ICU acute renal failure. Nephrol. Dial. Transplant. 9:S179–S182. 25. Størset, P., N. Smith-Erichsen, and P. Vaagenes. 1995. Organ function during early acute renal failure does not predict survival in long–term intensive care. Intensive Care Med. 21:797–801. 26. Chertow, G. M., C. L. Christiansen, P. D. Cleary, C. Munro, and M. Lazarus. 1995. Prognostic stratification in critically ill patients with acute renal failure requiring dialysis. Arch. Intern. Med. 155:1505–1511. 27. Rialp, G., A. Roglan, A. J. Betbese, M. Perez-Marquez, J. Ballus, G. Lopez Verlade, J. A. Santos, E. Bak, and A. Net. 1996. Prognostic indexes and mortality in critically ill patients with acute renal failure treated with different dialytic techniques. Renal Failure 18:667–675. 28. Knauss, W. A., D. P. Wagner, E. A. Draper, J. E. Zimmerman, M. Bergner, P. G. Bastos, C. A. Cirio, D. J. Murphy, T. Lotring, A. Damiano, and F. E. Harrell, Jr. 1991. The APACHE III prognostic system: risk prediction of hospital mortality for critically ill hospitalized adults. Chest 100:1619–1636. 29. Douma, C. E., W. K. Redekop, J. H. van der Meulen, R. W. van Olden, J. Haeck, D. G. Struijk, and R. T. Krediet. 1997. Predicting mortality in intensive care patients with acute renal failure treated with dialysis. J. Am. Soc. Nephrol. 8:111–117. 30. Viviand, X., J. Gouvernet, C. Granthil, and G. Francois. 1991. Simplification of the SAPS by selecting independent variables. Intensive Care Med. 17:164–168. 31. Bion, J. F., T. C. Aitchison, S. A. Edlin, and I. M. Ledingham. 1988. Sickness scoring and response to treatment as predictors of outcome from critical illness. Intensive Care Med. 14:167–172. 32. Lemeshow, S., D. Teres, H. Pastides, J. Spitz Avrunin, and J. S. Steingrub. 1985. A method for predicting survival and mortality of ICU patients using objectively derived weights. Crit. Care Med. 13:519–525. 33. Lohr, J. W., M. J. MacFarlane, and J. J. Grantham. 1988. A clinical index to predict survival in acute renal failure pateints requiring dialysis. Am. J. Kidney Dis. 11:254–259.