MOLECULAR AND CELLULAR BIOLOGY, Mar. 2005, p. 2498–2510 0270-7306/05/$08.00⫹0 doi:10.1128/MCB.25.6.2498–2510.2005 Copyright © 2005, American Society for Microbiology. All Rights Reserved.
Vol. 25, No. 6
Insulin Hypersensitivity and Resistance to Streptozotocin-Induced Diabetes in Mice Lacking PTEN in Adipose Tissue Christine Kurlawalla-Martinez,1 Bangyan Stiles,2* Ying Wang,2 Sherin U. Devaskar,1 Barbara B. Kahn,3 and Hong Wu2* Department of Pediatrics, Division of Neonatology,1 and Department of Molecular and Medical Pharmacology,2 David Geffen School of Medicine at UCLA, Los Angeles, California, and Division of Endocrinology, Diabetes and Metabolism, Beth Israel Deaconess Medical Center, and Department of Medicine, Harvard Medical School, Boston, Massachusetts3 Received 17 August 2004/Returned for modification 15 September 2004/Accepted 1 December 2004
In adipose tissue, insulin controls glucose and lipid metabolism through the intracellular mediators phosphatidylinositol 3-kinase and serine-threonine kinase AKT. Phosphatase and a tensin homolog deleted from chromosome 10 (PTEN), a negative regulator of the phosphatidylinositol 3-kinase/AKT pathway, is hypothesized to inhibit the metabolic effects of insulin. Here we report the generation of mice lacking PTEN in adipose tissue. Loss of Pten results in improved systemic glucose tolerance and insulin sensitivity, associated with decreased fasting insulin levels, increased recruitment of the glucose transporter isoform 4 to the cell surface in adipose tissue, and decreased serum resistin levels. Mutant animals also exhibit increased insulin signaling and AMP kinase activity in the liver. Pten mutant mice are resistant to developing streptozotocin-induced diabetes. Adipose-specific Pten deletion, however, does not alter adiposity or plasma fatty acids. Our results demonstrate that in vivo PTEN is a potent negative regulator of insulin signaling and insulin sensitivity in adipose tissue. Furthermore, PTEN may be a promising target for nutritional and/or pharmacological interventions aimed at reversing insulin resistance. tein phosphatases that inhibit the insulin/PI3K pathway, such as PTP1B, have been targets for intervention therapies (26). Disruption of the PTP1B gene in mice has proven to be beneficial in the regulation of insulin sensitivity and body adiposity as well as energy metabolism (14). Similar to PTP1B, phosphatase and a tensin homolog deleted from chromosome 10 (PTEN) (also known as MMAC1 or TEP1) (35) inhibits insulin signaling and antagonizes PI3K-mediated signaling by dephosphorylating phosphatidylinositol-3,4,5-triphosphate (PIP3), the product of PI3K (39). A common result of insulin stimulation and elevated PIP3 levels is the phosphorylation and activation of serine-threonine protein kinase B (PKB/AKT). Activated AKT plays a significant role in glycolysis, gluconeogenesis, protein synthesis, and adipogenesis (7, 13). Mice lacking Akt2, an isoform highly expressed in adipose tissue, demonstrate insulin resistance, hyperglycemia, and hyperlipidemia, findings characteristic of T2DM (10, 19). AKT activation is a hallmark of PTEN loss and elevated PIP3 levels (22, 47, 52, 62). Previously, we targeted disruption of the Pten gene in hepatocytes and demonstrated that a lack of PTEN in liver improves insulin sensitivity and alters lipid metabolism in mutant mice (63). Partial attenuation of PTEN activity by expressing an antisense oligonucleotide in adipose tissue and liver also reverses hyperglycemia in ob/ob mice and suppresses hyperglycemia in db/db mice (8). In addition, increased Pten expression was observed in the soleus muscles of diabetic obese Zucker rats (37). Adipose tissue is increasingly viewed as an active endocrine organ with a high metabolic activity. Adipocytes produce and secrete several proteins, collectively called adipocytokines. These adipocytokines act as veritable hormones responsible for the regulation of insulin sensitivity as well as energy intake and expenditure. These include resistin, adiponectin, leptin, tu-
Insulin controls metabolism by modulating the uptake and utilization of glucose and lipids in target organs, such as adipose tissue, skeletal muscle, and liver. Glucose homeostasis is, in part, regulated by the insulin-stimulated uptake of glucose in adipose tissue (1, 30, 41, 56). Aberrant glucose uptake due to insulin resistance is a key pathogenic feature of type 2 diabetes mellitus (T2DM). In order to understand glycemic control and the molecular mechanisms responsible for T2DM, significant focus has been placed on the study of insulin signaling. Signaling of insulin through its cell surface receptor (insulin receptor [IR]) and downstream substrates (IRS isoforms) has been highlighted in recent genetically engineered mouse models (5). These studies emphasize the importance of insulin signaling in the control of glycemia and demonstrate the intricacies involved in glucose metabolism. In order to compensate for some of the developmental defects and complications of whole-body disruptions of insulin signaling (2, 29, 31, 60, 66, 73), deletions of IR, IRS isoforms, glucose transporter isoform 4 (GLUT4), and other key glucose-metabolic genes have been studied (for a review, see reference 46). These studies suggest that the disruption of insulin signaling in certain organs is detrimental to the control of glycemia but that in other organs this disruption may be compensated for. The binding of insulin to IR leads to the activation of the phosphatidylinositol 3⬘-kinase (PI3K) pathway. Defects in PI3K signaling have been demonstrated in T2DM (9, 28). Pro* Corresponding author. Mailing address: Department of Molecular and Medical Pharmacology, David Geffen School of Medicine at UCLA, 23-234 CHS, 650 Charles E. Young Dr. South, Los Angeles, California, 90095. Phone: (310) 825-5160. Fax: (310) 267-0242. E-mail for Hong Wu:
[email protected]. E-mail for Bangyan Stiles:
[email protected]. 2498
VOL. 25, 2005
INSULIN HYPERSENSITIVITY AND RESISTANCE TO DIABETES
mor necrosis factor alpha (TNF-␣), interleukin 6 (IL-6), angiotensinogen, and plasminogen activator inhibitor 1 (18). Leptin is one of the first adipocytokines identified from adipose tissue and affects feeding behavior (24, 50). Adiponectin is suggested to play a role in energy balance by regulating AMP kinase, which converts AMP to ATP (74). The levels of leptin and adiponectin are positively and negatively correlated with adipose tissue mass, respectively. Resistin is one of the newest members in this growing family of adipose hormones (61). The level of resistin is positively correlated with insulin resistance. It is, however, not clear how resistin may cause insulin resistance. In this study, we generated an adipose tissue-specific Pten knockout mouse to investigate the functional role of PTEN in insulin signaling in vivo. Our data suggest that PTEN deficiency in adipose tissue leads to decreased production of resistin. The reduction in resistin may be the major signal leading to changes observed in the liver in our adipose tissue-specific Pten deletion mice. MATERIALS AND METHODS Generation and maintenance of adipose tissue-specific Ptenⴚ/ⴚ mice. Targeted deletion of Pten in adipose tissue was achieved by crossing PtenloxP/loxP mice (34) with adipose tissue-specific fatty acid binding protein (aP2-Cre) transgenic mice (1). F1-generation compound heterozygous animals were backcrossed with PtenloxP/loxP mice to produce F2-generation experimental animals. Animals were genotyped by standard genomic PCR techniques (34). Animals were housed in a temperature-, humidity-, and light-controlled room (with a cycle of 12 h of light and 12 h of dark) and allowed free access to a standard rodent chow diet containing 6% fat and water. All experiments were performed on 3-monthold males and were conducted according to the research guidelines of the UCLA Chancellor’s Animal Research Committee. Glucose and insulin tolerance tests. After overnight fasting, mice were injected intraperitoneally (i.p.) with either 2 mg of 30% D-glucose (Sigma, St. Louis, Mo.) per kg of body weight or 1 U of Humulin (Eli Lilly, Greenfield, Ind.) per kg of body weight. Blood glucose concentrations were measured as previously described (63). Plasma assays. After overnight fasting, mice were sacrificed and blood was sampled by intracardiac puncture. Plasma insulin, leptin, adiponectin, resistin, TNF-␣, and IL-6 concentrations were measured by the respective enzyme-linked immunosorbent assays (ELISAs) (insulin ELISA developed by Alpco, Windham, N.H.; leptin ELISA developed by Crystal Chem, Downers Grove, Ill.; adiponectin ELISA developed by B-Bridge International, Inc., Sunnyvale, Calif.; resistin ELISA developed by BioVendor Laboratory Medicine, Inc., Brno, Czech Republic; TNF-␣ ELISA developed by Assay Designs, Inc., Ann Arbor, Mich.; and IL-6 ELISA developed by R&D Systems, Inc., Minneapolis, Minn.). Plasma triglyceride and nonesterified fatty acid (NEFA) concentrations were determined using colorimetric assays provided by Sigma and Wako Chemicals (Richmond, Va.), respectively. Total body fat analysis. Regional fat distribution was assessed by gross dissection of individual fat pads (mesenteric, retroperitoneal, inguinal, and epididymal). Paired fat pads were weighed, and the adiposity index [adiposity index ⫽ total fat pad weight/(body weight ⫺ total fat pad weight)] (21) was calculated. Body mass index (body mass index ⫽ body weight/squared body length) (17) was also determined. Noninvasive assessment of body fat composition was performed using a whole-body nuclear magnetic resonance (NMR) spectroscopy live-mouse analyzer (44) (Bruker Optics, Woodland, Tex.). Western blot analysis. Mesenteric fat pads, liver, and muscle were homogenized in 3 volumes of RIPA buffer (1⫻ phosphate-buffered saline, 1% Igepal, 0.5% sodium deoxycholate, 0.1% sodium dodecyl sulfate) containing protease inhibitors. Protein concentrations were determined by the Bradford assay. Blots were probed with PTEN, glycogen synthase kinase 3␣/ (GSK3␣/), FOXO, phospho-AKT (Ser473), phospho-GSK3␣/, phospho-FOXO, and phosphoAMP kinase antibodies from Cell Signaling (Beverly, Mass.), insulin receptor  (IR-), IRS 1 and IRS 2 from Upstate Biotech, and GLUT4 antibody from Calbiochem (San Diego, Calif.). The same membranes were probed with -actin from Sigma-Aldrich (St. Louis, Mo.) as loading controls. Densitometry of the specific protein bands was performed by VersaDoc imaging system and Quantity One software (Bio-Rad Laboratories).
2499
Immunohistochemistry. Briefly, animals were euthanized with an overdose of inhaled isofluorane followed by cervical dislocation. Tissues were dissected and fixed in formalin overnight. Formalin-fixed tissues were sectioned and used for immunohistochemistry and immunofluorescence studies according to a standard antigen retrieval method using citric buffer (pH 6.0). Antibodies against PTEN (26H9) and phospho-AKT (Ser473) (Cell Signaling Technology), GLUT4 (Calbiochem), and insulin were used for the analysis. Insulin and PTEN were detected with secondary antibody conjugated to horseradish peroxidase, followed by the addition of a chromogen substrate. Detection of GLUT4 and P-AKT on the plasma membrane was further amplified with TSA Cye3 fluorescence systems (Perkin Elmer, Boston, Mass.) after addition of secondary antibodies. Sections were counterstained with hematoxylin and DAPI (4⬘,6⬘-diamidino-2-phenylindole) for immunohistochemistry and immunofluorescence, respectively. Insulin signaling in vivo. After overnight fasting, mice were injected i.p. with insulin at 2 U/kg of body weight in saline with 0.1% bovine serum albumin or a vehicle control (23). At 5 min postinjection, animals were sacrificed and the mesenteric fat pads and right quadriceps muscles were quickly dissected, flash-frozen in liquid N2, and stored at ⫺80°C until Western blot analysis was performed. Subcellular fractionation of GLUT4 compartments. Plasma membrane (PM) and low-density microsome (LDM) fractions from adipose tissue and skeletal muscle were obtained by differential ultracentrifugation procedures (68). Briefly, for adipose tissue, 1 g of mesenteric adipose was homogenized in 30 ml of ice-cold sucrose buffer (250 mM sucrose, 20 mM HEPES-Tris, 1 mM EDTA, 100 M phenylmethylsulfonyl fluoride, pH 7.4), crushed on dry ice, homogenized using a Polytron device (setting 3; 30 s), and then subjected to 15 strokes of homogenization in a glass Teflon pestle. After centrifugation (16,000 ⫻ g for 30 min at 4°C), the top fat layer was discarded and the pellet was saved for preparation of the PM-enriched fraction. The supernatant was centrifuged (48,000 ⫻ g for 30 min at 4°C), and the resulting supernatant was centrifuged again (250,000 ⫻ g for 30 min at 4°C) to yield the pelleted LDM-enriched fraction. The initial pellet was resuspended in 2 ml of the sucrose buffer, applied to a 1.12 M sucrose cushion (20 mM HEPES 䡠 Tris and 1 mM EDTA, pH 7.4), and centrifuged (100,000 ⫻ g for 60 min at 4°C) to obtain the interface, which was resuspended in 10 ml of the sucrose buffer and centrifuged (48,000 ⫻ g for 30 min at 4°C) to obtain the pellet containing PM. For fractionation of skeletal muscle, 1 g of flash-frozen quadriceps tissue was thawed in 30 ml of ice-cold sucrose buffer, minced with scissors, and homogenized with a Polytron device (setting 3; 30 s). This homogenate was filtered through two layers of cheesecloth to remove residual connective tissue and centrifuged (3,000 ⫻ g for 10 min at 4°C). The pellet was saved for preparation of the PM-enriched fraction. The supernatant was centrifuged (48,000 ⫻ g for 30 min at 4°C), and the resulting supernatant was further subjected to a second centrifugation (250,000 ⫻ g for 1 h at 4°C) to yield the final LDM subfraction. The original saved pellet was resuspended in 10 mM Tris 䡠 HCl (pH 8.0) and centrifuged again. The resulting pellet was washed twice, resuspended in 10 mM Tris 䡠 HCl (ratio of 30 ml to 1 g [wt/vol] of the original skeletal muscle), and homogenized using a Teflon pestle. The suspension was transferred to a glass beaker, a 9- by 25-mm-diameter Teflon-coated magnet was added to the beaker, and the beaker was covered with Parafilm and stored at 4°C for 16 h. Thereafter, 50 mM lithium bromide (LiBr; 200 l/10 ml of the suspension) was added to the beaker and magnetically stirred (setting 3; 2.5 h) to extract all contractile elements. The LiBr-treated suspension was transferred to a centrifuge tube, diluted in 20 ml of 10 mM Tris 䡠 HCl, and centrifuged (10,000 ⫻ g for 10 min at 4°C). The pellet was resuspended in 10 ml of the 10 mM Tris 䡠 HCl and centrifuged (6,000 ⫻ g for 10 min at 4°C). The pellet obtained was resuspended in 25% potassium bromide (KBr; 15 ml per 1 g [wt/vol] of muscle), followed by centrifugation (10,000 ⫻ g for 30 min at 4°C). The KBr-treated pellet was washed once with 250 mM sucrose buffer and was recentrifuged (17,000 ⫻ g for 20 min at 4°C) to obtain the final PM-enriched pellet. All final tissue subfractions were resuspended in 500 l of sucrose buffer and stored at ⫺80°C until Western blot analysis was performed. We monitored LDM for potential contamination with PM using a PM marker, p21ras. STZ-induced diabetes. Three-month-old male mice were injected i.p. with multiple subdiabetogenic doses of streptozotocin (STZ) (36, 48) (50 mg of streptozotocin per kg of body weight daily for five consecutive days; Sigma). Animals were tested for the development of diabetes (defined as persistent blood glucose level of ⬎180 mg/dl and random blood glucose of ⬎300 mg/dl in fasting mice) beginning 7 days after the initial injection. Resistance to the development of diabetes was defined as failure to meet these criteria by 21 days after the STZ injection. Statistical analysis. All data are presented as means ⫾ standard errors of the means (SEM). All data were subjected to analysis with multivariate analysis of variance using Statsdirect. A HOC test was conducted whenever differences were noticed by using the Newman-Keuls multiple-comparison test, with a P of ⱕ0.05 being considered statistically significant. Differences between two groups were
2500
KURLAWALLA-MARTINEZ ET AL.
MOL. CELL. BIOL.
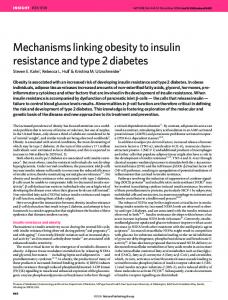
FIG. 1. Targeted deletion of Pten is adipose tissue specific. (A) PCR analysis performed on tissues from a PtenloxP/loxP aP2-Cre⫹/⫺ mouse. LoxP alleles (1,100 bp) flanking exon 5 of the Pten locus were detected in all tissues except WAT and BAT. The ⌬5 band (450 bp) appeared only in WAT, BAT, and skin, which has an adipose component. (B) Western blot analysis of protein extracts from mesenteric fat pads. Blots were hybridized with anti-PTEN (54 kDa, top panel) and anti-actin (40 kDa, bottom panel) antibodies. (C) Immunohistochemical (IHC) staining for PTEN in paraffinembedded WAT (right panels). Arrows indicate blood vessels. Loss of PTEN status did not disturb the gross morphology of WAT as seen by hematoxylin and eosin (H&E) staining (left panels). Scale bar ⫽ 50 m. Sk muscle, skeletal muscle; Con, control; Mut, mutant; ␣-PTEN, PTEN antibody.
analyzed by Student’s t test, with two-tailed P values of less than 0.05 being considered statistically significant.
RESULTS Targeted deletion of Pten is adipose tissue specific. Adipose tissue-specific inactivation of Pten was achieved by breeding PtenloxP/loxP aP2-Cre⫺/⫺ mice (control) with aP2-Cre transgenic mice (1). PCR analysis of genomic DNA isolated from different tissues of PtenloxP/loxP aP2-Cre⫹ mice (mutant) confirmed efficient adipose tissue-specific Pten deletion, as indicated by the loss of loxP bands and the presence of the exon 5 deletion (⌬5) band (34) in both white (WAT) and brown (BAT) adipose tissue (Fig. 1A). Skin, the only other tissue in which the Pten deletion was detected, was most likely due to the presence of sebaceous glands and subcutaneous fatty tissues. Western blot analyses were performed on mesenteric fat pad protein lysates from four knockout mice; all showed a ⬎70% reduction in the PTEN protein level (Fig. 1B). The residual amount of
PTEN observed in mutant adipose tissue lysate was likely due to contamination from cell types other than adipocytes. We further confirmed Pten deletion by immunohistochemical staining of paraffin-embedded adipose tissues with an antiPTEN antibody (Fig. 1C, right panels). Both nuclear and cytoplasmic staining of PTEN was observed in control tissue (Fig. 1C, top right panel). No PTEN immunoreactivity could be detected in mutant adipocytes (Fig. 1C, bottom right panel). Therefore, expression of aP2-Cre in adipose tissue led to efficient tissue-specific Pten deletion, resulting in a functional loss of PTEN protein. Animals with adipose tissue-specific Pten deletion survived to adulthood with a normal Mendelian distribution (data not shown). Grossly mutant mice were phenotypically indistinguishable from their control and heterozygous littermates. Histological analysis of BAT (data not shown) and WAT revealed no gross morphological difference between controls and mutants (Fig. 1C, left panels). The morphologies of other insulin
VOL. 25, 2005
INSULIN HYPERSENSITIVITY AND RESISTANCE TO DIABETES
2501
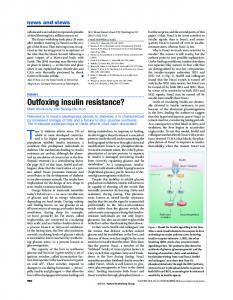
FIG. 2. Pten deletion in adipose tissue led to an increase in AKT signaling. (A) Western blot analyses of mesenteric fat pad protein extracts. Blots were probed with anti-P-AKT, IR-, P-GSK3, P-FOXO1, and P-FOXO3. (B) Immunofluorescent staining of control (Con) and mutant (Mut) WAT sections with P-AKT antibody (␣-pAKT). Scale bar ⫽ 50 m.
target organs, such as skeletal muscle and liver, were also unaltered as a result of adipose tissue-specific Pten deletion (data not shown). Adipose tissue-specific Pten deletion led to increased insulin signaling in adipose tissue. We observed a 1.8-fold increase in P-AKT levels determined by Western blot analysis and enhanced P-AKT staining in the mutant adipose tissues compared to levels in controls (Fig. 2). To further establish that the AKT pathway is activated, we determined the levels of phospho-GSK3 and FOXO, substrates of AKT kinase activity, in the adipose tissues. Compared to the adipose tissues of control animals, the Pten mutant adipose tissue exhibited 2.5- and 3-fold increases in phospho-GSK3 and phospho-FOXO1 levels, respectively. The level of phospho-FOXO3 level increased by as much as 11.6-fold in the mutant adipose tissue compared to levels in control animals (Fig. 2A). The FOXO family transcriptional factors have been shown to regulate energy metabolism synergistically with PGC-1, a key regulator of thermogenesis (54). No difference was observed with upstream signaling molecules such as IR- (Fig. 2A). Thus, Pten adipose-
specific deletion leads to activation of the PI3K/AKT pathway without perturbing their upstream signaling molecules. Adipose tissue-specific Pten deletion does not alter body fat content or lipid metabolism. Contrary to what we had expected, the increase in insulin signaling in adipose tissues of Pten mutant mice did not lead to increases in adipose tissue mass. Figure 3A shows that no changes in body weight can be detected in the mutant mice. Gross fat pad dissection revealed no difference in individual fat pad weights, total fat pad weights, adiposity indices (21), and body mass indices (17) between control and mutant animals (Fig. 3B, left panel, and Table 1). When measured by NMR spectroscopy, no significant difference in body fat content was noted between the genotypes, although Pten mutants demonstrated a trend towards a higher body adiposity level (13.8% ⫾ 1.7% and 11.9% ⫾ 1.3% for mutant and control mice, respectively; P ⫽ 0.43) (Fig. 3B, right panel). The absence of a difference in total body fat content was reflected by a similarity in plasma leptin concentrations (3.02 ⫾ 0.52 and 2.75 ⫾ 0.39 ng/ml in control and mutant mice, respectively) (Fig. 3C, left panel) and adiponec-
FIG. 3. Pten mutant mice retained normal body weight and fat mass. (A) Body weights of control (Con) and mutant (Mut) mice at 3 weeks, 1 month, and 3 months of age. (B) Fat pad morphology and fat mass. (Left panel) Gross fat pad dissection; (right panel) percent total body fat content, as assessed by NMR spectroscopy (9 control mice and 11 mutant mice). (C) Mean plasma leptin (left panel) and adiponectin (right panel) levels for 12 mice. (D) Plasma triglyceride (left panel) (16 control mice and 18 mutant mice) and NEFA (right panel) (13 control mice and 12 mutant mice) concentrations. Data are presented as means ⫾ SEM. 2502
VOL. 25, 2005
INSULIN HYPERSENSITIVITY AND RESISTANCE TO DIABETES
TABLE 1. Body content characteristics of control and Pten mutant micea Value for: P value
Parameter Control mice
Mutant mice
Body wt (g) at: Weaning 1 mo 3 mo
12.48 ⫾ 0.65 20.58 ⫾ 1.41 29.89 ⫾ 0.78
11.99 ⫾ 0.62 19.63 ⫾ 0.74 31.01 ⫾ 0.42
0.59 0.56 0.22
Fat pad wt (g) at 3 mo Mesenteric Retroperitoneal (paired) Inguinal (paired) Epididymal (paired) Total
0.086 ⫾ 0.013 0.096 ⫾ 0.012 0.269 ⫾ 0.019 0.303 ⫾ 0.035 0.753 ⫾ 0.014
0.095 ⫾ 0.010 0.120 ⫾ 0.012 0.247 ⫾ 0.016 0.295 ⫾ 0.016 0.757 ⫾ 0.037
0.61 0.18 0.42 0.84 0.46
Adiposity index (%)
2.604 ⫾ 0.168
2.505 ⫾ 0.095
0.62
0.624 ⫾ 0.033
0.664 ⫾ 0.012
0.27
2
BMI (g/cm ) a
Total body weights were assessed longitudinally at weaning (age 21 days) and at 1 month and 3 months of age. At 3 months of age, individual fat pads were dissected and weighed. With these data, adiposity indices and body mass indices (BMI) were calculated as described in Materials and Methods. No significant difference in any of the characteristics examined was found between control and mutant mice. Each value represents a mean ⫾ SEM. Ten mice of each genotype were used.
2503
tin concentrations (56.3 ⫾ 3.9 in controls versus 60.5 ⫾ 9.8 g/ ml in mutant mice) (Fig. 3C, right panel). Additionally, between fasting control and mutant animals, serum triglyceride levels (85.05 ⫾ 3.19 and 83.16 ⫾ 7.77 mg/dl, respectively; P ⫽ 0.41) (Fig. 3D, left panel) and NEFA levels (1.09 ⫾ 0.09 and 1.23 ⫾ 0.05 mEq/liter, respectively; P ⫽ 0.22) (Fig. 3D, right panel) did not differ. Pten mutant mice exhibit enhanced glucose tolerance and insulin sensitivity. During the i.p. glucose tolerance test (GTT), Pten mutant mice showed a blunted elevation of blood glucose compared to levels in controls (Fig. 4A, left panel). The mean peak increase in blood glucose (normalized as a percentage of the initial level) of mutant mice was 19% lower than that of controls (323% ⫾ 13% versus 399% ⫾ 32%; P ⱕ 0.05). If we extrapolate from the GTT curve, mutants are expected to return to the baseline glucose level at 131 ⫾ 10 min, compared to 173 ⫾ 21 min for the controls (P ⱕ 0.05). Mutant animals were also more sensitive to insulin challenge (insulin tolerance test [ITT]), experiencing 24% lower blood glucose (normalized as a percentage of the initial level) at 60 min postinjection (19% ⫾ 2% in mutant mice versus 25% ⫾ 2% in control mice; P ⱕ 0.05) (Fig. 4A, right panel). At this time point, all mutants
FIG. 4. Metabolic indices and glucose and insulin tolerance tests. (A) Intraperitoneal GTT indicated that Pten mutant mice (Mut) (n ⫽ 12) were more tolerant of glucose challenge than controls (Con) (n ⫽ 11). ITT revealed that mutant mice (n ⫽ 13) were more sensitive to insulin challenge than controls (n ⫽ 12) and became seriously hypoglycemic (arrows). Data are normalized as percentages of initial blood glucose levels in fasting mice. (B) Blood glucose concentrations in fasting mice (12 control mice; 12 mutant mice) and plasma insulin levels and glucose/insulin ratios in fasting mice (there were 14 mice of each genotype for each assay). Data are presented as means ⫾ SEM. *, P ⱕ 0.05.
2504
KURLAWALLA-MARTINEZ ET AL.
MOL. CELL. BIOL.
TABLE 2. Insulin resistance indices of control and Pten mutant micea Mice
AUC by GTT
AUC by ITT
IR index
Control Mutant
3,293 ⫾ 347 2,515 ⫾ 295
642 ⫾ 78 457 ⫾ 22
2.11 ⫾ 0.48 1.15 ⫾ 0.20*
a Shown are insulin resistance (IR) indices for animals from each genotype, calculated as the product of the AUC of the GTT and the ITT. Each value is a mean ⫾ SEM. *, P ⬍ 0.05 compared with values for control mice.
showed overt signs of hypoglycemia, and 8 of the 13 animals studied could not be rescued by glucose administration (Fig. 4A). The insulin resistance index calculated from the area under curve (AUC) in GTTs and ITTs was 1.9-fold lower for mutants than for controls (1.20 ⫾ 0.20 versus 2.11 ⫾ 0.48; P ⱕ 0.05) (Table 2). Pten mutant mice did not exhibit significant fasting hypoglycemia, (68 ⫾ 4 versus 75 ⫾ 6 mg/dl for mutant versus control mice) (Fig. 4B, left panel). Interestingly, we observed that fasting mutants had a 2.1-fold decrease in plasma insulin levels compared to levels in controls (0.17 ⫾ 0.02 versus 0.36 ⫾ 0.01 ng/ml, respectively; P ⬍ 0.001) (Fig. 4B, right panel), indicating increased insulin sensitivity. Deletion of Pten in adipose tissue leads to decreased resistin levels and increased insulin signals in the liver. To determine whether Pten deletion in adipose tissue might lead to changes in the hormonal factors involved in metabolism, we measured the circulating levels of various adipocytokines. Similar to leptin and adiponectin levels, levels of TNF-␣ and IL-6 did not change significantly (data not shown). Interestingly, we observed 36%-lower serum resistin concentrations in mutant mice (19.8 ⫾ 3.4 ng/ml in mutant mice versus 30.9 ⫾ 2.1 ng/ml
in control mice; P ⱕ 0.05) (Fig. 5A, left panel) as well as a marked reduction of white adipose tissue resistin protein levels in the mutant mice compared to levels in the control mice (Fig. 4A, lower panel). Resistin is an adipocytokine released by adipocytes to act on hepatocytes, adipocytes, and myocytes to regulate glucose metabolism. It is not clear how resistin may signal in these cells, since a receptor for resistin has not been identified. One of the signaling molecules regulated by resistin is postulated to be AMP kinase. Down-regulation of AMP kinase was observed in mice overexpressing resistin (55). To determine whether deleting Pten in adipose tissue led to insulin and AMP kinase signaling changes in the liver, we measured molecules involved in insulin signaling as well as AMP kinase activation/phosphorylation status. In the liver, insulin signaling is significantly enhanced in mutant animals regardless of insulin stimulation (Fig. 4B). A moderate but significant increase in P-AMP kinase levels was also observed in the mutants compared to levels in the controls (Fig. 5B). Collectively, Pten deletion in adipose tissues leads to reduced serum insulin and resistin levels that may synergistically control insulin sensitivity and AMPK activity in the liver. Adipose tissue-specific Pten deletion leads to recruitment of GLUT4 to the cell surfaces of adipocytes and skeletal muscle cells. In order to understand how Pten deletion in adipose tissue led to improved insulin sensitivity, we treated control and mutant animals with insulin for 5 min and observed the insulin-stimulated transportation of GLUT4 in muscle and adipose tissue, two of the initial responding organs. At the basal stage, total and PM and LDM compartment-associated GLUT4
FIG. 5. Pten deletion in aP2-expressing cells decreased resistin in adipose tissue and increased insulin and AMP kinase signaling in liver. (A, top panel) Serum resistin concentrations were significantly lower in Pten mutants (Mut) (n ⫽ 7) than in controls (Con) (n ⫽ 9). (A, bottom left panels) Western blot analysis of mesenteric fat pad protein extracts. Blots were probed with antiresistin (12.5 kDa, top panel) and antiactin (40 kDa, bottom panel) antibodies. (A, bottom right panel) Densitometry data of resistin Western blot analysis. Resistin levels in control samples were considered to be 1 (three mice). (B) Western analysis of insulin signaling and AMP kinase activity in liver protein extracts. WT, wild type.
VOL. 25, 2005
INSULIN HYPERSENSITIVITY AND RESISTANCE TO DIABETES
2505
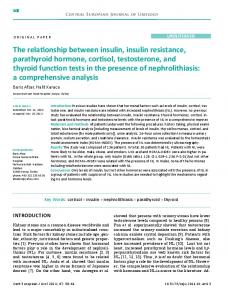
FIG. 6. Pten deletion in adipose tissue alters GLUT4 membrane localization in both WAT and skeleton muscles. (Top panels) Western blots of GLUT4 subcellular fractions (total protein, LDM, and PM; 80 g of protein/lane; run on the same gel) from adipose tissue (A) and skeletal muscle (B). (Bottom three panels) Densitometry data of GLUT4 levels from Western analysis in WAT (A) and skeletal muscle (B). The relative density of control samples at the basal stage is considered to be 1 in all cases. Three mice were used. WT, wild type; Mut, mutant mice; con, control mice.
2506
KURLAWALLA-MARTINEZ ET AL.
MOL. CELL. BIOL.
VOL. 25, 2005
INSULIN HYPERSENSITIVITY AND RESISTANCE TO DIABETES
levels were all higher in the mutant adipose tissue than in the control tissues (Fig. 6A). Strikingly, the level of the membrane fraction of GLUT4 was six times higher in the mutant than in the control adipose tissues (Fig. 6A, lanes PM). In contrast, the mutant muscle had threefold-lower GLUT4 levels on the PM than that in the control animals (Fig. 6B). These results suggest that the muscle and adipose tissues respond reciprocally to maintain euglycemia in the animals at steady state. Upon insulin stimulation, a threefold increase in GLUT4 level was observed in the mutant adipose tissue PM compartment, similar to what occurred in the control animals (Fig. 6A). In the muscle, we observed a sixfold insulin stimulation in mutant mice, higher than the fourfold stimulation of PM GLUT4 localization seen in the control animals (Fig. 6B). Together, these data suggest that insulin signaling in muscle and adipose tissue are closely linked and need to be considered together. As a control for subcellular fractionation, we probed the same blots with anti-p21ras antibody, a known PM-enriched protein. The signals for p21ras in the LDM fraction (optical density per milligram of membrane protein) were 35 and 30% of those in the PM of adipose tissue and skeletal muscle, respectively (data not shown), indicating limited cross-contamination of internal membranes with PM in both tissues. Adipose tissue-specific Pten deletion protects mice from developing streptozotocin-induced diabetes. To determine whether the insulin hypersensitivity demonstrated by Pten mutant mice could compensate for hyperglycemia induced in metabolic syndromes, we induced hyperglycemia in control and mutant animals by STZ treatment. Animals were treated daily with low-dose STZ (50 mg/kg). The effectiveness of STZ treatment at achieving an only partial loss of -cells was confirmed at 21 days postinjection by an approximately 40% decrease in plasma insulin levels in fasting mice (Fig. 7A, left panel) and an increased glucose/insulin ratio (Fig. 7A, right panel) in both control and mutant groups. Histological and immunohistochemical evaluation of pancreatic islets of Langerhans cells revealed similar levels of atrophy and markedly decreased insulin immunoreactivity in STZ-treated controls and mutants, compared to levels in normal islets seen in vehicle-treated animals (Fig. 7B). This result suggests that Pten adipose tissuespecific deletion has no effect on the response of  cells to chemically induced injuries. However, while all STZ-treated control mice developed clinical and metabolic signs of diabetes by 14 days postinjection, as indicated by elevated blood glucose levels (Fig. 7C, left), mutant mice maintained normal glycemia and remained resistant to the development of hyperglycemia (Fig. 7C, left panel). While both control and mutant animals experienced an approximately 40% decrease in insulin levels (40% for control and 38% for mutant mice), the mutant animals maintained improved responsiveness to glucose challenge with a downshifted GTT curve compared to that of the con-
2507
trols (Fig. 7C, right panel). Neither the control nor mutant mice injected with vehicle alone developed hyperglycemia (data not shown). DISCUSSION This study was designed to ascertain the in vivo relationship between loss of Pten in adipose tissue and insulin sensitivity. Impaired insulin sensitivity is a key pathogenic feature of T2DM, and deciphering the molecular mechanisms involved in insulin signaling is of high clinical relevance. Adipose tissue plays a critical role in the development of insulin resistance via secretion of NEFA and adipocytokines. Emerging biochemical and genetic evidence suggests that insulin resistance can potentially be treated via modulation of the PI3K/AKT pathway by targeting its up- or downstream modulators (28). IR and PI3K have intrinsic kinase activities, and both protein tyrosine phosphatases (14) and lipid phosphatases (12) negatively regulate insulin signaling and insulin sensitivity in vivo. Here, we created a novel mouse model to study the physiological relevance of the phosphatase PTEN in insulin signaling. In this study, we observed that disrupting the Pten gene in aP2-expressing cells led to increased insulin sensitivity and better glucose tolerance. This increased insulin sensitivity paralleled a decrease in circulating insulin and resistin levels, with no significant differences in body weight and fat storage. Our data also suggest that the decreased insulin and resistin levels may signal the liver to respond by increasing AMP kinase activity and insulin signaling, respectively. PTEN and adipose tissue. It has been suggested that endogenous PTEN plays a limited role in the regulation of adipocyte glucose transport (43, 49). However, in vitro study demonstrated that overexpression of PTEN significantly inhibited insulin-induced GLUT4 translocation and glucose uptake in adipocytes (45). Our in vivo study strongly suggests that negative regulators of the PI3K/AKT pathway, such as PTEN, are critical for modulating insulin sensitivity in adipose tissues. Adipose tissue-specific Pten deletion leads to improved systemic glucose tolerance and insulin sensitivity, associated with decreased insulin levels in fasting mice, increased recruitment of GLUT4 in adipose tissue, and decreased serum resistin levels. Our Pten knockout mice exhibit physiologic and metabolic features similar to those of PTP-1B knockout mice and SHIP2 heterozygous knockout mice (12, 14). PTP-1B mutant mice show enhanced insulin sensitivity, as evidenced by their lower blood glucose and insulin concentrations and improved performance as determined by GTT and ITT. The function of SHIP2 parallels that of PTEN in that it acts as a lipid phosphatase and dephosphorylates PIP3 to PIP2 (3). Although the results of Ship2 deletion may be complicated by the parallel deletion of Phox2 (11), mice with this mutation also display
FIG. 7. Pten deletion protects mutants from developing STZ-induced diabetes. (A, left panels) Insulin levels in fasting mice. WT, wild-type mice. (A, right panels) Glucose/insulin ratios in control (Con) and mutant (MUT) mice. (B) Hematoxylin and eosin (H&E) staining of paraffin-embedded pancreas (top panels). After the STZ treatment, islets of Langerhans cells are damaged (arrows) and insulin immunoreactivity is markedly reduced (bottom panels; red stain). (C) Blood glucose concentrations of fasting mice (left panel) measured 14 days after STZ treatment demonstrated hyperglycemia in controls and normal glycemia in Pten mutants. The GTT (right panel) measured glucose 14 days after STZ treatment. Scale bar ⫽ 50 m. Each value represents a mean ⫾ SEM. *, P ⬍ 0.05; **, P ⬍ 0.001, compared with values for control mice. For all experiments, 13 control and 4 mutant mice were used.
2508
KURLAWALLA-MARTINEZ ET AL.
improved glucose tolerance and insulin sensitivity, associated with increased AKT activity and the recruitment of GLUT4 in skeletal muscle, phenotypes consistent with deletion of a PIP3 phosphatase, which is similar to our findings (12). Improved insulin sensitivity and decreased fasting insulin levels seem to be common phenotypes in phosphatase-deficient mice. The 2.1-fold reduction in plasma insulin concentrations in fasting Pten mutant mice is similar to the phenotypes observed in PTP-1B and Ship2 mice as well as in adiponectin-expressing cell Pten deletion mice (32). Systemic treatment with PTEN antisense oligonucleotide also dramatically reduced insulin concentrations in ob/ob mice (8). This relative hypoinsulinemia indicates that the Pten mutants are insulin hypersensitive and therefore require less systemic insulin to maintain euglycemia. This observation may also explain why Pten mutant mice are protected from developing STZinduced diabetes. Additionally, systemic injection of PTEN antisense oligonucleotide leads to increased insulin-stimulated AKT phosphorylation in murine hepatocytes, normalized blood glucose concentrations in ob/ob mice, and an improved performance of db/db mice upon ITT (8). We suspect that crossing our Pten mutant mice with ob/ob or db/db mice may prevent or attenuate the development of insulin resistance and hyperglycemia in offspring. PTEN and GLUT4 translocation. At the basal and insulinstimulated stages, Pten mutant mice displayed increased GLUT4 levels in adipocyte PMs compared to levels in controls. This finding is consistent with the increased basal and insulin-stimulated GLUT4 translocation seen in 3T3-L1 adipocytes when they are microinjected with an anti-PTEN antibody (45). Interestingly, Pten mutants have reduced levels of PM-associated GLUT4 in skeletal muscle in the basal state, with a normal response to insulin stimulation. This reciprocal response of muscle might explain why a moderate improvement in glucose-tolerant insulin sensitivity is observed during GTT or ITT even though insulin levels are significantly lower in fasting Pten mutant mice. Our data are complementary to those showing that downregulation of GLUT4 protein in adipose tissue in G4A⫺/⫺ mice leads to insulin resistance (1). Increased GLUT4 levels in Pten null adipose tissue may also explain why mutant mice demonstrate insulin hypersensitivity and are protected from developing STZ-induced diabetes. This notion is supported by the previous report indicating that selective overexpression of GLUT4 in adipose tissue alleviates insulin resistance in STZdiabetic mice (69). Resistin expression is modulated by murine PTEN in vivo. A more likely explanation for the insulin hypersensitivity observed in the Pten mutants is the significantly decreased expression of the adipocyte-derived protein resistin. Resistin is a secretory protein that plays a key role in the development of insulin resistance in vivo (61) and is regulated by a variety of hormones and mediators, including insulin (15, 16, 25, 57, 72). The phenotype of the resistin knockout mouse implicates resistin in regulating normal glucose homeostasis (4). In the present study, we show that the loss of adipocyte PTEN results in decreased resistin protein expression and reduced circulating resistin levels. These findings complement previous studies of 3T3-L1 adipocytes, in which resistin expression is markedly suppressed by overexpression of PI3K and AKT (59). Con-
MOL. CELL. BIOL.
versely, overexpression of both wild-type and myristoylated PTEN induces a significant increase in resistin (59). The major effect of resistin deficiency on systemic glucose metabolism is believed to be impairment of hepatic gluconeogenesis (4). However, resistin has also been shown to impair glucose transport in cultured adipocytes (61, 75) and myocytes (42, 53). In muscle, resistin, or factors regulated by resistin, suppress insulin-stimulated glucose metabolism (42). Our results suggest that up-regulation of AMP kinase activity as a result of reduced resistin levels in Pten mutant animals may be one of the mechanisms by which liver (and skeletal muscle) responded to adipose tissue Pten deletion. Chronic overexpression of resistin has been shown to down-regulate AMP kinase activities in not only liver, but also muscle and adipose tissue (55). The phosphatase studies, including the PTP-1B, Ship2, and Pten deletion studies have highlighted the importance of energy balance and thermogenesis in glucose homeostasis. AMP kinase, which converts AMP to ATP, is the key enzymes involved in energy metabolism. We have provided a mechanism by which these phosphatases may affect energy balance not only locally but also systemically. Although the precise mechanism is currently not clear, our results further confirm that the PI3K/AKT cascade is responsible, at least in part, for the negative regulation of resistin expression in the murine model. The effects of this lowered resistin on liver may partially explain the insulin sensitivity phenotype observed in Pten mutant mice. Nonessential role of PTEN in adipose tissue development and maintenance. Animal growth, adiposity, and plasma triglyceride and fatty acid levels are unaffected by Pten deletion in adipose tissue. This finding is surprising because it has previously been shown that tissue-specific Pten loss leads to cell proliferation, increased cell size, and organomegaly in brain, heart, thymus, liver, endometrium, prostate, and skin (22, 33, 62, 64, 65, 71, 76), suggesting that PTEN may control cell growth in a tissue- or lineage-specific manner. Moreover, it is well known that insulin signaling in adipose tissue plays an important role in lipid storage, as has been demonstrated for mice with a fat-specific deletion of the insulin receptor gene (6). Our observations, however, correlate with the normal growth and adipose deposition seen in G4A⫺/⫺ mice, despite their markedly impaired levels of adipocyte insulin-stimulated glucose uptake (1). While this paper was under review, Komazawa et al. described phenotypes associated with Pten adipose tissue-specific deletion (32). Although using a different Cre line, their observation and conclusion are not significantly different from ours, except with regard to body weight and fat storage. Komazawa et al. demonstrated decreased body weight and fat storage (32), while we did not observe any significant change. This discrepancy may be due to differentially regulated, either temporally or spatially, Cre transgene expression by two independent promoters. The study of Komazawa et al., however, supported our findings that PTEN deficiency does not increase body adiposity, possibly due to the increased energy metabolism shown by Komazawa et al. (32). Nonetheless, both studies suggest that PTEN function in adipose tissue is critical for insulin sensitivity. While there may be species-specific differences in the roles that PTEN and resistin play in metabolic regulation, it is worth noting that a patient with Cowden disease, resulting from a
VOL. 25, 2005
INSULIN HYPERSENSITIVITY AND RESISTANCE TO DIABETES
heterozygous PTEN germ line mutation leading to reduced PTEN activity, exhibited insulin hypersensitivity during a euglycemic hyperinsulinemic clamp test (27). Mutations of the AKT2 gene, a downstream signaling molecule of PTEN, have been mapped in a pedigree of familial diabetes patients (20). Additionally, epidemiological studies provide evidence suggesting an interaction between resistin polymorphisms and the effect of obesity on the risk of insulin resistance and T2DM in certain populations (38, 40, 51, 58, 67, 70). Our Pten knockout mouse model will be useful for further exploring the mechanisms by which insulin signaling in adipose tissue regulates systemic insulin sensitivity. ACKNOWLEDGMENTS We thank Richard Davis for assistance with the NMR spectroscopy studies. This work was supported by National Institutes of Health grants T32-HD07549 (to C.K.-M.), HD41230 and HD25024 (to S.U.D.), and DK43051 and DK60839 (to B.B.K.) and Department of Defense grants DAMD17-01-1-0182 (to B.S.) and PC991538 (to H.W.). REFERENCES 1. Abel, E. D., O. Peroni, J. K. Kim, Y. B. Kim, O. Boss, E. Hadro, T. Minnemann, G. I. Shulman, and B. B. Kahn. 2001. Adipose-selective targeting of the GLUT4 gene impairs insulin action in muscle and liver. Nature 409: 729–733. 2. Accili, D., J. Drago, E. J. Lee, M. D. Johnson, M. H. Cool, P. Salvatore, L. D. Asico, P. A. Jose, S. I. Taylor, and H. Westphal. 1996. Early neonatal death in mice homozygous for a null allele of the insulin receptor gene. Nat. Genet. 12:106–109. 3. Backers, K., D. Blero, N. Paternotte, J. Zhang, and C. Erneux. 2003. The termination of PI3K signalling by SHIP1 and SHIP2 inositol 5-phosphatases. Adv. Enzyme Regul. 43:15–28. 4. Banerjee, R. R., S. M. Rangwala, J. S. Shapiro, A. S. Rich, B. Rhoades, Y. Qi, J. Wang, M. W. Rajala, A. Pocai, P. E. Scherer, C. M. Steppan, R. S. Ahima, S. Obici, L. Rossetti, and M. A. Lazar. 2004. Regulation of fasted blood glucose by resistin. Science 303:1195–1198. 5. Baudry, A., L. Leroux, M. Jackerott, and R. L. Joshi. 2002. Genetic manipulation of insulin signaling, action and secretion in mice. Insights into glucose homeostasis and pathogenesis of type 2 diabetes. EMBO Rep. 3:323–328. 6. Bluher, M., M. D. Michael, O. D. Peroni, K. Ueki, N. Carter, B. B. Kahn, and C. R. Kahn. 2002. Adipose tissue selective insulin receptor knockout protects against obesity and obesity-related glucose intolerance. Dev. Cell 3:25–38. 7. Brazil, D. P., and B. A. Hemmings. 2001. Ten years of protein kinase B signalling: a hard Akt to follow. Trends Biochem. Sci. 26:657–664. 8. Butler, M., R. A. McKay, I. J. Popoff, W. A. Gaarde, D. Witchell, S. F. Murray, N. M. Dean, S. Bhanot, and B. P. Monia. 2002. Specific inhibition of PTEN expression reverses hyperglycemia in diabetic mice. Diabetes 51: 1028–1034. 9. Cantley, L. C. 2002. The phosphoinositide 3-kinase pathway. Science 296: 1655–1657. 10. Cho, H., J. Mu, J. K. Kim, J. L. Thorvaldsen, Q. Chu, E. B. Crenshaw III, K. H. Kaestner, M. S. Bartolomei, G. I. Shulman, and M. J. Birnbaum. 2001. Insulin resistance and a diabetes mellitus-like syndrome in mice lacking the protein kinase Akt2 (PKB beta). Science 292:1728–1731. 11. Clement, S., U. Krause, F. Desmedt, J. F. Tanti, J. Behrends, X. Pesesse, T. Sasaki, J. Penninger, M. Doherty, W. Malaisse, J. E. Dumont, Y. Le Marchand-Brustel, C. Erneux, L. Hue, and S. Schurmans. 2004. The lipid phosphatase SHIP2 controls insulin sensitivity. Nature 431:878. (Erratum.) 12. Clement, S., U. Krause, F. Desmedt, J. F. Tanti, J. Behrends, X. Pesesse, T. Sasaki, J. Penninger, M. Doherty, W. Malaisse, J. E. Dumont, Y. Le Marchand-Brustel, C. Erneux, L. Hue, and S. Schurmans. 2001. The lipid phosphatase SHIP2 controls insulin sensitivity. Nature 409:92–97. 13. Cross, D. A., P. W. Watt, M. Shaw, J. van der Kaay, C. P. Downes, J. C. Holder, and P. Cohen. 1997. Insulin activates protein kinase B, inhibits glycogen synthase kinase-3 and activates glycogen synthase by rapamycininsensitive pathways in skeletal muscle and adipose tissue. FEBS Lett. 406: 211–215. 14. Elchebly, M., P. Payette, E. Michaliszyn, W. Cromlish, S. Collins, A. L. Loy, D. Normandin, A. Cheng, J. Himms-Hagen, C. C. Chan, C. Ramachandran, M. J. Gresser, M. L. Tremblay, and B. P. Kennedy. 1999. Increased insulin sensitivity and obesity resistance in mice lacking the protein tyrosine phosphatase-1B gene. Science 283:1544–1548. 15. Fasshauer, M., J. Klein, S. Neumann, M. Eszlinger, and R. Paschke. 2001. Isoproterenol inhibits resistin gene expression through a G(S)-protein-coupled pathway in 3T3-L1 adipocytes. FEBS Lett. 500:60–63.
2509
16. Fasshauer, M., J. Klein, S. Neumann, M. Eszlinger, and R. Paschke. 2001. Tumor necrosis factor alpha is a negative regulator of resistin gene expression and secretion in 3T3-L1 adipocytes. Biochem. Biophys. Res. Commun. 288:1027–1031. 17. Fernandez-Moreno, C., J. G. Pichel, V. Chesnokova, and F. De Pablo. 2004. Increased leptin and white adipose tissue hypoplasia are sexually dimorphic in Lif null/Igf-I haploinsufficient mice. FEBS Lett. 557:64–68. 18. Fruhbeck, G., J. Gomez-Ambrosi, F. J. Muruzabal, and M. A. Burrell. 2001. The adipocyte: a model for integration of endocrine and metabolic signaling in energy metabolism regulation. Am. J. Physiol. Endocrinol. Metab. 280: E827–E847. 19. Garofalo, R. S., S. J. Orena, K. Rafidi, A. J. Torchia, J. L. Stock, A. L. Hildebrandt, T. Coskran, S. C. Black, D. J. Brees, J. R. Wicks, J. D. McNeish, and K. G. Coleman. 2003. Severe diabetes, age-dependent loss of adipose tissue, and mild growth deficiency in mice lacking Akt2/PKB beta. J. Clin. Investig. 112:197–208. 20. George, S., J. J. Rochford, C. Wolfrum, S. L. Gray, S. Schinner, J. C. Wilson, M. A. Soos, P. R. Murgatroyd, R. M. Williams, C. L. Acerini, D. B. Dunger, D. Barford, A. M. Umpleby, N. J. Wareham, H. A. Davies, A. J. Schafer, M. Stoffel, S. O’Rahilly, and I. Barroso. 2004. A family with severe insulin resistance and diabetes due to a mutation in AKT2. Science 304:1325–1328. 21. Gregoire, F. M., Q. Zhang, S. J. Smith, C. Tong, D. Ross, H. Lopez, and D. B. West. 2002. Diet-induced obesity and hepatic gene expression alterations in C57BL/6J and ICAM-1-deficient mice. Am. J. Physiol. Endocrinol. Metab. 282:E703–E113. 22. Groszer, M., R. Erickson, D. D. Scripture-Adams, R. Lesche, A. Trumpp, J. A. Zack, H. I. Kornblum, X. Liu, and H. Wu. 2001. Negative regulation of neural stem/progenitor cell proliferation by the Pten tumor suppressor gene in vivo. Science 294:2186–2189. 23. Gum, R. J., L. L. Gaede, S. L. Koterski, M. Heindel, J. E. Clampit, B. A. Zinker, J. M. Trevillyan, R. G. Ulrich, M. R. Jirousek, and C. M. Rondinone. 2003. Reduction of protein tyrosine phosphatase 1B increases insulin-dependent signaling in ob/ob mice. Diabetes 52:21–28. 24. Halaas, J. L., K. S. Gajiwala, M. Maffei, S. L. Cohen, B. T. Chait, D. Rabinowitz, R. L. Lallone, S. K. Burley, and J. M. Friedman. 1995. Weightreducing effects of the plasma protein encoded by the obese gene. Science 269:543–546. 25. Haugen, F., A. Jorgensen, C. A. Drevon, and P. Trayhurn. 2001. Inhibition by insulin of resistin gene expression in 3T3-L1 adipocytes. FEBS Lett. 507: 105–108. 26. Hoffman, B. T., M. R. Nelson, K. Burdick, and S. M. Baxter. 2004. Protein tyrosine phosphatases: strategies for distinguishing proteins in a family containing multiple drug targets and anti-targets. Curr. Pharm. Des. 10:1161– 1181. 27. Iida, S., A. Ono, K. Sayama, T. Hamaguchi, H. Fujii, H. Nakajima, M. Namba, T. Hanafusa, Y. Matsuzawa, and K. Moriwaki. 2000. Accelerated decline of blood glucose after intravenous glucose injection in a patient with Cowden disease having a heterozygous germline mutation of the PTEN/ MMAC1 gene. Anticancer Res. 20:1901–1904. 28. Jiang, G., and B. B. Zhang. 2002. Pi 3-kinase and its up- and down-stream modulators as potential targets for the treatment of type II diabetes. Front. Biosci. 7:d903–d907. 29. Joshi, R. L., B. Lamothe, N. Cordonnier, K. Mesbah, E. Monthioux, J. Jami, and D. Bucchini. 1996. Targeted disruption of the insulin receptor gene in the mouse results in neonatal lethality. EMBO J. 15:1542–1547. 30. Kahn, B. B., and J. S. Flier. 2000. Obesity and insulin resistance. J. Clin. Investig. 106:473–481. 31. Kido, Y., D. J. Burks, D. Withers, J. C. Bruning, C. R. Kahn, M. F. White, and D. Accili. 2000. Tissue-specific insulin resistance in mice with mutations in the insulin receptor, IRS-1, and IRS-2. J. Clin. Investig. 105:199–205. 32. Komazawa, N., M. Matsuda, G. Kondoh, W. Mizunoya, M. Iwaki, T. Takagi, Y. Sumikawa, K. Inoue, A. Suzuki, T. W. Mak, T. Nakano, T. Fushiki, J. Takeda, and I. Shimomura. 2004. Enhanced insulin sensitivity, energy expenditure and thermogenesis in adipose-specific Pten suppression in mice. Nat. Med. 10:1208–1215. 33. Kwon, C. H., X. Zhu, J. Zhang, L. L. Knoop, R. Tharp, R. J. Smeyne, C. G. Eberhart, P. C. Burger, and S. J. Baker. 2001. Pten regulates neuronal soma size: a mouse model of Lhermitte-Duclos disease. Nat. Genet. 29:404–411. 34. Lesche, R., M. Groszer, J. Gao, Y. Wang, A. Messing, H. Sun, X. Liu, and H. Wu. 2002. Cre/loxP-mediated inactivation of the murine Pten tumor suppressor gene. Genesis 32:148–149. 35. Li, D. M., and H. Sun. 1997. TEP1, encoded by a candidate tumor suppressor locus, is a novel protein tyrosine phosphatase regulated by transforming growth factor beta. Cancer Res. 57:2124–2129. 36. Like, A. A., and A. A. Rossini. 1976. Streptozotocin-induced pancreatic insulitis: new model of diabetes mellitus. Science 193:415–417. 37. Lo, Y. T., C. J. Tsao, I. M. Liu, S. S. Liou, and J. T. Cheng. 2004. Increase of PTEN gene expression in insulin resistance. Horm. Metab. Res. 36: 662–666. 38. Ma, X., J. H. Warram, V. Trischitta, and A. Doria. 2002. Genetic variants at the resistin locus and risk of type 2 diabetes in Caucasians. J. Clin. Endocrinol. Metab. 87:4407–4410.
2510
KURLAWALLA-MARTINEZ ET AL.
39. Maehama, T., and J. E. Dixon. 1998. The tumor suppressor, PTEN/MMAC1, dephosphorylates the lipid second messenger, phosphatidylinositol 3,4,5trisphosphate. J. Biol. Chem. 273:13375–13378. 40. McTernan, C. L., P. G. McTernan, A. L. Harte, P. L. Levick, A. H. Barnett, and S. Kumar. 2002. Resistin, central obesity, and type 2 diabetes. Lancet 359:46–47. 41. Minokoshi, Y., C. R. Kahn, and B. B. Kahn. 2003. Tissue-specific ablation of the GLUT4 glucose transporter or the insulin receptor challenges assumptions about insulin action and glucose homeostasis. J. Biol. Chem. 278: 33609–33612. 42. Moon, B., J. J. Kwan, N. Duddy, G. Sweeney, and N. Begum. 2003. Resistin inhibits glucose uptake in L6 cells independently of changes in insulin signaling and GLUT4 translocation. Am. J. Physiol. Endocrinol. Metab. 285: E106–E115. 43. Mosser, V. A., Y. Li, and M. J. Quon. 2001. PTEN does not modulate GLUT4 translocation in rat adipose cells under physiological conditions. Biochem. Biophys. Res. Commun. 288:1011–1017. 44. Mystkowski, P., E. Shankland, S. A. Schreyer, R. C. LeBoeuf, R. S. Schwartz, D. E. Cummings, M. Kushmerick, and M. W. Schwartz. 2000. Validation of whole-body magnetic resonance spectroscopy as a tool to assess murine body composition. Int. J. Obes. Relat. Metab. Disord. 24:719–724. 45. Nakashima, N., P. M. Sharma, T. Imamura, R. Bookstein, and J. M. Olefsky. 2000. The tumor suppressor PTEN negatively regulates insulin signaling in 3T3-L1 adipocytes. J. Biol. Chem. 275:12889–12895. 46. Nandi, A., Y. Kitamura, C. R. Kahn, and D. Accili. 2004. Mouse models of insulin resistance. Physiol. Rev. 84:623–647. 47. Neshat, M. S., I. K. Mellinghoff, C. Tran, B. Stiles, G. Thomas, R. Petersen, P. Frost, J. J. Gibbons, H. Wu, and C. L. Sawyers. 2001. Enhanced sensitivity of PTEN-deficient tumors to inhibition of FRAP/mTOR. Proc. Natl. Acad. Sci. USA 98:10314–10319. 48. O’Brien, B. A., B. V. Harmon, D. P. Cameron, and D. J. Allan. 1996. Beta-cell apoptosis is responsible for the development of IDDM in the multiple low-dose streptozotocin model. J. Pathol. 178:176–181. 49. Ono, H., H. Katagiri, M. Funaki, M. Anai, K. Inukai, Y. Fukushima, H. Sakoda, T. Ogihara, Y. Onishi, M. Fujishiro, M. Kikuchi, Y. Oka, and T. Asano. 2001. Regulation of phosphoinositide metabolism, Akt phosphorylation, and glucose transport by PTEN (phosphatase and tensin homolog deleted on chromosome 10) in 3T3-L1 adipocytes. Mol. Endocrinol. 15: 1411–1422. 50. Pelleymounter, M. A., M. J. Cullen, M. B. Baker, R. Hecht, D. Winters, T. Boone, and F. Collins. 1995. Effects of the obese gene product on body weight regulation in ob/ob mice. Science 269:540–543. 51. Pizzuti, A., A. Argiolas, R. Di Paola, R. Baratta, A. Rauseo, M. Bozzali, R. Vigneri, B. Dallapiccola, V. Trischitta, and L. Frittitta. 2002. An ATG repeat in the 3⬘-untranslated region of the human resistin gene is associated with a decreased risk of insulin resistance. J. Clin. Endocrinol. Metab. 87: 4403–4406. 52. Podsypanina, K., R. T. Lee, C. Politis, I. Hennessy, A. Crane, J. Puc, M. Neshat, H. Wang, L. Yang, J. Gibbons, P. Frost, V. Dreisbach, J. Blenis, Z. Gaciong, P. Fisher, C. Sawyers, L. Hedrick-Ellenson, and R. Parsons. 2001. An inhibitor of mTOR reduces neoplasia and normalizes p70/S6 kinase activity in Pten⫹/⫺ mice. Proc. Natl. Acad. Sci. USA 98:10320–10325. 53. Pravenec, M., L. Kazdova, V. Landa, V. Zidek, P. Mlejnek, P. Jansa, J. Wang, N. Qi, and T. W. Kurtz. 2003. Transgenic and recombinant resistin impair skeletal muscle glucose metabolism in the spontaneously hypertensive rat. J. Biol. Chem. 278:45209–45215. 54. Puigserver, P., J. Rhee, J. Donovan, C. J. Walkey, J. C. Yoon, F. Oriente, Y. Kitamura, J. Altomonte, H. Dong, D. Accili, and B. M. Spiegelman. 2003. Insulin-regulated hepatic gluconeogenesis through FOXO1-PGC-1alpha interaction. Nature 423:550–555. 55. Satoh, H., M. T. Nguyen, P. D. Miles, T. Imamura, I. Usui, and J. M. Olefsky. 2004. Adenovirus-mediated chronic “hyper-resistinemia” leads to in vivo insulin resistance in normal rats. J. Clin. Investig. 114:224–231. 56. Shepherd, P. R., and B. B. Kahn. 1999. Glucose transporters and insulin action—implications for insulin resistance and diabetes mellitus. N. Engl. J. Med. 341:248–257. 57. Shojima, N., H. Sakoda, T. Ogihara, M. Fujishiro, H. Katagiri, M. Anai, Y. Onishi, H. Ono, K. Inukai, M. Abe, Y. Fukushima, M. Kikuchi, Y. Oka, and T. Asano. 2002. Humoral regulation of resistin expression in 3T3-L1 and mouse adipose cells. Diabetes 51:1737–1744. 58. Smith, S. R., F. Bai, C. Charbonneau, L. Janderova, and G. Argyropoulos. 2003. A promoter genotype and oxidative stress potentially link resistin to human insulin resistance. Diabetes 52:1611–1618.
MOL. CELL. BIOL. 59. Song, H., N. Shojima, H. Sakoda, T. Ogihara, M. Fujishiro, H. Katagiri, M. Anai, Y. Onishi, H. Ono, K. Inukai, Y. Fukushima, M. Kikuchi, H. Shimano, N. Yamada, Y. Oka, and T. Asano. 2002. Resistin is regulated by C/EBPs, PPARs, and signal-transducing molecules. Biochem. Biophys. Res. Commun. 299:291–298. 60. Stenbit, A. E., T. S. Tsao, J. Li, R. Burcelin, D. L. Geenen, S. M. Factor, K. Houseknecht, E. B. Katz, and M. J. Charron. 1997. GLUT4 heterozygous knockout mice develop muscle insulin resistance and diabetes. Nat. Med. 3: 1096–1101. 61. Steppan, C. M., S. T. Bailey, S. Bhat, E. J. Brown, R. R. Banerjee, C. M. Wright, H. R. Patel, R. S. Ahima, and M. A. Lazar. 2001. The hormone resistin links obesity to diabetes. Nature 409:307–312. 62. Stiles, B., V. Gilman, N. Khanzenzon, R. Lesche, A. Li, R. Qiao, X. Liu, and H. Wu. 2002. Essential role of AKT-1/protein kinase B alpha in PTENcontrolled tumorigenesis. Mol. Cell. Biol. 22:3842–3851. 63. Stiles, B., Y. Wang, A. Stahl, S. Bassilian, W. P. Lee, Y. J. Kim, R. Sherwin, S. Devaskar, R. Lesche, M. A. Magnuson, and H. Wu. 2004. Live-specific deletion of negative regulator Pten results in fatty liver and insulin hypersensitivity. Proc. Natl. Acad. Sci. USA 101:2082–2087. 64. Suzuki, A., M. Hayashida, H. Kawano, K. Sugimoto, T. Nakano, and K. Shiraki. 2000. Hepatocyte growth factor promotes cell survival from fasmediated cell death in hepatocellular carcinoma cells via Akt activation and Fas-death-inducing signaling complex suppression. Hepatology 32:796–802. 65. Suzuki, A., S. Itami, M. Ohishi, K. Hamada, T. Inoue, N. Komazawa, H. Senoo, T. Sasaki, J. Takeda, M. Manabe, T. W. Mak, and T. Nakano. 2003. Keratinocyte-specific Pten deficiency results in epidermal hyperplasia, accelerated hair follicle morphogenesis and tumor formation. Cancer Res. 63: 674–681. 66. Tamemoto, H., T. Kadowaki, K. Tobe, T. Yagi, H. Sakura, T. Hayakawa, Y. Terauchi, K. Ueki, Y. Kaburagi, S. Satoh, et al. 1994. Insulin resistance and growth retardation in mice lacking insulin receptor substrate-1. Nature 372: 182–186. 67. Tan, M. S., S. Y. Chang, D. M. Chang, J. C. Tsai, and Y. J. Lee. 2003. Association of resistin gene 3⬘-untranslated region ⫹62G3A polymorphism with type 2 diabetes and hypertension in a Chinese population. J. Clin. Endocrinol. Metab. 88:1258–1263. 68. Thamotharan, M., R. A. McKnight, S. Thamotharan, D. J. Kao, and S. U. Devaskar. 2003. Aberrant insulin-induced GLUT4 translocation predicts glucose intolerance in the offspring of a diabetic mother. Am. J. Physiol. Endocrinol. Metab. 284:E901–E914. 69. Tozzo, E., L. Gnudi, and B. B. Kahn. 1997. Amelioration of insulin resistance in streptozotocin diabetic mice by transgenic overexpression of GLUT4 driven by an adipose-specific promoter. Endocrinology 138:1604–1611. 70. Wang, H., W. S. Chu, C. Hemphill, and S. C. Elbein. 2002. Human resistin gene: molecular scanning and evaluation of association with insulin sensitivity and type 2 diabetes in Caucasians. J. Clin. Endocrinol. Metab. 87:2520– 2524. 71. Wang, S., J. Gao, Q. Lei, N. Rozengurt, C. Pritchard, J. Jiao, G. V. Thomas, G. Li, P. Roy-Burman, P. S. Nelson, X. Liu, and H. Wu. 2003. Prostatespecific deletion of the murine Pten tumor suppressor gene leads to metastatic prostate cancer. Cancer Cell 4:209–221. 72. Way, J. M., C. Z. Gorgun, Q. Tong, K. T. Uysal, K. K. Brown, W. W. Harrington, W. R. Oliver, Jr., T. M. Willson, S. A. Kliewer, and G. S. Hotamisligil. 2001. Adipose tissue resistin expression is severely suppressed in obesity and stimulated by peroxisome proliferator-activated receptor gamma agonists. J. Biol. Chem. 276:25651–25653. 73. Withers, D. J., J. S. Gutierrez, H. Towery, D. J. Burks, J. M. Ren, S. Previs, Y. Zhang, D. Bernal, S. Pons, G. I. Shulman, S. Bonner-Weir, and M. F. White. 1998. Disruption of IRS-2 causes type 2 diabetes in mice. Nature 391: 900–904. 74. Yamauchi, T., J. Kamon, Y. Minokoshi, Y. Ito, H. Waki, S. Uchida, S. Yamashita, M. Noda, S. Kita, K. Ueki, K. Eto, Y. Akanuma, P. Froguel, F. Foufelle, P. Ferre, D. Carling, S. Kimura, R. Nagai, B. B. Kahn, and T. Kadowaki. 2002. Adiponectin stimulates glucose utilization and fatty-acid oxidation by activating AMP-activated protein kinase. Nat. Med. 8:1288– 1295. 75. Yoon, J. C., P. Puigserver, G. Chen, J. Donovan, Z. Wu, J. Rhee, G. Adelmant, J. Stafford, C. R. Kahn, D. K. Granner, C. B. Newgard, and B. M. Spiegelman. 2001. Control of hepatic gluconeogenesis through the transcriptional coactivator PGC-1. Nature 413:131–138. 76. Zhu, X., C. H. Kwon, P. W. Schlosshauer, L. H. Ellenson, and S. J. Baker. 2001. PTEN induces G(1) cell cycle arrest and decreases cyclin D3 levels in endometrial carcinoma cells. Cancer Res. 61:4569–4575.