Modeling. Yimin Yangâ, Daniel Lopezâ, Haiman Tianâ, Samira Pouyanfarâ ..... [2] S.-C. Chen, M. Chen, N. Zhao, S. Hamid, K. Chatterjee, and M. Armella,.
Integrated Execution Framework for Catastrophe Modeling Yimin Yang∗ , Daniel Lopez∗ , Haiman Tian∗ , Samira Pouyanfar∗ Fausto C. Fleites∗ , Shu-Ching Chen∗ and Shahid Hamid† ∗ School
of Computing and Information Sciences † Department of Finance Florida International University, Miami, FL, USA ∗ Email: {yyang010,dlope073,htian005,spouy001,fflei001,chens}@cs.fiu.edu † Email: {hamids}@fiu.edu Abstract—Home insurance is a critical issue in the state of Florida, considering that residential properties are exposed to hurricane risk each year. To assess hurricane risk and project insured losses, the Florida Public Hurricane Loss Model (FPHLM) funded by the states insurance regulatory agency was developed. The FPHLM is an open and public model that offers an integrated complex computing framework that can be described in two phases: execution and validation. In the execution phase, all major components of FPHLM (i.e., data preprocessing, Wind Speed Correction (WSC), and Insurance Loss Model (ILM)) are seamlessly integrated and sequentially carried out by following a coordination workflow, where each component is modeled as an execution element governed by the centralized data-transfer element. In the validation phase, semantic rules provided by domain experts for individual component are applied to verify the validity of model output. This paper presents how the model efficiently incorporates the various components from multiple disciplines in an integrated execution framework to address the challenges that make the FPHLM unique.
I. I NTRODUCTION Hurricanes are one of the most severe natural disasters and cause significant damages. The state of Florida is affected by the tropical or subtropical cyclones more than nine months every year, which is known as the hurricane season. The Labor Day Hurricane of 1935, which crossed the Florida Keys with a pressure of 892 mbar (hPa; 26.35 inHg), is the strongest tropical cyclone; it is also the strongest hurricane on record to strike the United States. Out of the ten most intense landfalling United States hurricanes, four struck Florida at peak strength. Not only did it cause human death but also lead to property losses. Just the hurricanes from the 2004 and 2005 seasons, in addition to Hurricane Andrew in 1992, have accumulated over $115 billon (USD) in total damages. For instance, Hurricane Charley and Frances in 2004, which affected Florida and the southern United States respectively, caused $16 billion and $9.8 (USD) billion in damages and more than 20 human causalities. Such big catastrophic losses need more attention while estimating the effects. The capability of predicting the statistically likely hurricanes directly affect the insurance rate regulations and have effects on protecting the rights and interests of the policyholders. Based on these important factors, the Florida Public Hurricane Loss Model (FPHLM) [1] [2] [3], which is the first and
only open, public hurricane risk model in the country, aims to evaluate the risk of wind damage to insured residential properties. This catastrophe model is developed and maintained by a multidisciplinary team of scientists in the fields of Meteorology, Structural Engineering, Statistics, Actuarial Science, and Computer Science. Since it launched in 2006, the model has been used more than 700 times by the insurance industry and regulators in Florida, as well as for the purpose of processing the Florida Hurricane Catastrophe Fund data. The project includes over 30 researchers and students from Florida International University, Florida Institute of Technology, University of Florida, Florida State University, National Oceanic Administration Hurricane Division, University of Miami, and AMI Risk Consultants. The FPHLM consists of the following different components: (a) a meteorological component, (b) a structure-engineering component, and (c) an actuarial component. The meteorological component focuses on generating stochastic storms based on a seed of historical events simulated over a large number of years. The engineering component links the wind speed data to different physical damage vulnerability curves for each significant type of building structures. The actuarial component estimates expected losses based on the properties’ coordinates, building characteristics, and the stochastic storm set. The last component obtains the input from previous components and generates the required results for exposure loss evaluations. The model runs on an integrated computing framework that consists of two phases: (a) an execution phase that runs the computationally-complex components of the FPHLM and (b) a validation phase that verifies model output via the enforcement of semantic rules. In the execution phase, the framework implements a coordination workflow that sequences and integrates the components of the FPHLM. The coordination workflow models each component as an abstract “execution” element. Execution elements are executed in sequence and the communication between execution elements is governed by the “data-transfer” element. The data-transfer element controls data transformation between components. By providing this execution abstraction, the framework facilitates the integration of the model components and is adaptable
to yearly model changes. To be more specific, it obtains a series of input variables required by each component at the very beginning, for instance, the structure characteristic information for engineering module, the property’s address for wind speed correction, and produces a great amount of intermediate computation results. Every component processes the corresponding input data and generates the required results for each input property portfolio. It is worth mentioning that the framework is complex, as it has to provide interfaces for each model component, which come from different disciplines. Considering the vast amount of sensitive data produced by each component, the framework possesses the capability of intensive computation as well as precise data processing. In the validation phase, the framework enforces semantic rules that identify potential data inconsistencies. These rules are provided by experts and consist of valid relations between policy attribute values and loss output ranges. Based on the specific details of the model components and our previous works, we have identified several key issues that need specific notice to make the whole framework work automatically without any unsolved exception. In this paper, the following problems were addressed: 1. How to guarantee the correctness of the input data? Since the model receives portfolios as input data provided by insurance companies, it is a challenge to validate and identify errors in the data, which are rather common. These data usually come from property assessments and suffer from data-entry errors. Firstly, the standard formats of property assessments would be vary from different companies, which causes some of the inputs cannot be accepted directly. Also, data-entry errors could happen in any manually input step. 2. How to process huge amounts of data efficiently? The largest datasets will be produced in the meteorological component, which contains more than 60 thousand years simulated wind speed results for each specific geographic location. For each required locations (represented by latitude and longitude), wind speed calculation should be done respectively. If the dataset contains a large size of portfolios (e.g., over one million), it will take an extremely long time to produce all the results. 3. How to identify potential data inconsistencies in the model output and ensure the validity of the results to be delivered? By running the entire model consisting of different components, it is expected to obtain a reasonable insurance rate from the input insurance portfolio. On one hand, it would make sure the properties are fully protected by the insurance policies. On the other hand, the insurance industry will be regulated by the modeled results provided by the insurance regulators. Therefore, it is very important to ensure the validity of the results to be delivered to the clients. Detailed discussions and solutions of those issues listed above are presented in the following sections. This work is about the highly integrated framework with the capability of connecting all the critical components and providing automatic process. It guarantees that each portfolio is able to successfully go through each component and get the final formatted results
as fast as possible. There are very few computing platforms supporting catastrophe-modeling components, much less about the complex integrated framework dealing with different disciplines. The remainder of this paper is organized as follows. Section II describes the related work. Section III details each significant component and the issues we solved in the FPHLM and the integration efforts. Section IV presents the validation of some critical data processing results. Finally, section V concludes this work. II. R ELATED WORK Hurricane loss models have attracted considerable attention in both insurance industry and the research community due to the potential damages and human losses caused by hurricanes. Various private loss modeling systems have been developed in order to assist insurance industry in the insurance rate process. Florida Commission on Hurricane Loss Projection Methodology assesses the effectiveness of various methodologies based on the accuracy of projecting insured Florida losses and till 2013, only few of them are approved [4] such as AIR Worldwide Corporation [5], [6], Risk Management Solutions (RMS model) [7] [8], EQECAT Model [9], and Applied Research Associates (ARA Model) [10]. However, all these commercial models are black box and many details of these models are not available for public. Another approved model by Florida Commission is the FPHLM [1], [2], which is the only open and public model in the world. Many meteorologist, engineers, statisticians and insurance researchers have focused on hurricane loss models and applied different components. For example, some researchers have studied on meteorological components such as topography, wind fields, landfall and so on (eg. [11]). Other components including demand surge, loss adjustment expenses, climate condition [12], structural characteristics of the building [12], and variation in model output [13] have also been considered as important factors in hurricane models. The HRD real-time hurricane wind analysis system [14], within the National Oceanic and Atmospheric Administration (NOAA), processes data into a common framework for exposure, height and averaging time. Several products are derived from the analysis wind field and storm track. The HAZUS-MH hurricane model methodology [15], the only existing public system but with limited accessibility, includes five major components to predict loss and damage of buildings subjected to hurricanes: hurricane hazard model, terrain model, wind load model, physical damage model, and loss model. FPHLM model, the first public model in the world, consists of three major components: atmospheric (meteorology), vulnerability (engineering), and insured loss cost (actuarial). Till now, various researches have been done in order to improve FPHLM [2], [16], [17]. Specifically, a Monte Carlo simulation model has been proposed for FPHLM in [1], which estimates the average annual loss of hurricane wind damage to residential properties in the State of Florida. In [16], MapReduce is applied into the FPHLM to integrate the
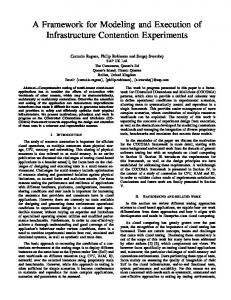
atmospheric components, which resulted in a highly optimized platform capable of efficiently generating stochastic storm sets on a cluster of computers. In [17], a web-based collaboration system that automates some components of the FPHLM insurance data processing has been presented. In this article, all the FPHLM components are integrated as a united computing system which automatically runs the whole process, and provides valid results for regulating insurance rate making process. III. I NTEGRATED E XECUTION F RAMEWORK The insurance data processing framework, is an integrated computing framework, that is able to run computationally complex components from the various disciplines. The framework can be divided into two phases: the execution phase (See Fig. 1) and the validation phase. In the execution phase, the framework implements a coordination workflow that integrates the following components: • Pre-processing Tool • Wind Speed Correction • Insurance Loss Model In the validation phase, the framework sets semantic rules that identify potential inconsistencies in the output results. The aforementioned components of the execution phase will be explained in further detail in the following sections, along with the validation phase. A. Pre-processing The Pre-processing component, known as the Data Preprocessing Tool or DPPT, is a web based application written in Java and hosted on an Apache Tomcat server. The DPPT is designed architecturally to be an event driven and multi-user environment. This signifies that each processor can initiate the pre-processing with just the click of a button, and each pre-processing instance runs in the background. Even with the automation of pre-processing, there are a plethora of challenges that this tool faces. For instance, the input files in most cases contain hundreds of thousand of policies with a large list of attributes, and these usually come with erroneous or missing values. The following is a list (not comprehensive) of common problems that the DPPT faces with the input file: • Missing geographic coordinates. • Missing values for fields such as zip code, county. • The zip code or address for a particular policy is not from the state of Florida. • The policy has the city and county switched. (i.e. Lake Worth as county and Palm Beach as city, when it should be the other way around) Regardless of the complexities, the DPPT attempts to tackle the problems faced with pre-processing and ensures that the input data are processed efficiently. The steps applied by the DPPT are summarized as follows: • Generate data summary file • Perform geocoding • Produce vulnerability matrices
Pre-processing issue notification
Data processing manager
Display problem with troubleshooting tips Processor then resumes normal operation
Processor
Original data
Data Pre-processing
1. Format original data 2. Create necessary directories 3. Create database
1.Precleaning 2.Generate geocoding file
DPPT 1.Generate data summary file 2. Perform geocoding 3. Produce vulnerability matrices
Generate exposure file
WSC error notification
Wind Speed Correction
Data-transfer
Transfer data
Generate WSC WSC files
Insurance Loss Module
ILM error notification
Format final results Generate analysis files WSC PML Files
Execution Phase
Validation Phase
Validate results
Fig. 1.
Semantic rules
Data processing framework
DPPT Running/Continues Pre-processing tasks If fix resolved by DPPT then DPPT doesn't notify processor and DPPT then continues.
If issue resolved DPPT continues where last left off.
DPPT Issue/Error
Attempt fix
Display Problem
SQL editor Human readable format of problem Troubleshooting tips if possible
Processor Processor attempts fix
Fig. 2. Diagram of how the DPPT handles with issues during pre-proceessing.
Geocoding Geocode using ARC Map
DPPT DPPT generates summary file If no issues with summary file, processor can proceed with geocoding.
If issue resolved with summary file, then processor does geocoding.
DPPT
Summary file gets parsed for issues
Display Problem
Display warning Provide a link where processor can view summary file issues
Processor Processor fixes issues with summary file
Fig. 3.
Diagram of how the DPPT handles summary file issues.
The event driven nature of the DPPT allows the pre-processing to run in the background. If during the process, the DPPT cannot fix an issue, it will display the issue to the processor with a set of troubleshooting tips, an editor to run SQL commands, and a button to resume, as shown in Fig. 2. If the issue is resolved, the DPPT will continue like there was never an issue in the first place. Thus, the DPPT pauses, when an issue arises, and displays the issue as human readable as possible, and allows the processor to continue if the processor believes the issue was rectified (Fig. 2). The subsequent sections are going to describe the details and steps the DPPT takes to complete the pre-processing. 1) Generating data summary file: Summary file is a summary note of pre-processing results which includes the basic statistics of all the attributes as well as potential erroneous values. First, the DPPT formats the input data and loads it to the database to generate summary file. The formatting process tends to include the following: • • •
Adding the headers if missing Making sure the number of fields is correct in each row Detecting for coordinates present in the original data
When the formatting of the original data has been done and loaded into the database, the summary file is automatically generated and stored in the root folder of the data set to be processed. The DPPT then parses the summary file for any issues that needs the attention of the processor. Usually, issues can range from NULL zip code, to incorrect county or region (refer to the common issues faced with the input file). If an issue or issues is found in the summary file, the DPPT pauses and displays the issues that are present in the summary file. The user can then click to view the issues associated with the summary file as shown in Figure 3. Once the issue has been resolved the geocoding process can now start.
2) Performing geocoding using Arc MAP: During this stage, the DPPT generates the file necessary to produce geographic coordinates that are needed in the Wind Speed Correction (WSC) component (section III-B). This process is called geocoding and is performed through the use of a third-party software named Arc Map [18]. Additionally, the processor needs to place the geocoding result in the appropriate folder before continuing with pre-processing. Typically no issues arise here, unless the processor places the geocoding result in the incorrect location, or the processor sets the wrong user permissions that cause the DPPT not being able to read the file. If any of those issues occurs, the DPPT will notify the processor, and once the problem is rectified, the processor can then click continue to proceed. It is worth mentioning that the processor can skip this step if the original data contains the coordinates. Then the DPPT will directly create the geocoding output. The automatic generation of the geocoding result is done during the formatting stage. In most cases, the input data does not include the coordinate, which means that geocoding will have to be done most of the time through the use of ARC Map. 3) Producing vulnerability matrices: Vulnerability matrices are generated by the engineering module, which determine external vulnerability of structures based on different combinations of policy attributes, such as the year built, location, and various mitigation properties. Matrices are used as input in the Insurance Loss Model (ILM) component (section III-C step 2.e). It is not practical to provide vulnerability matrices for each combination of policy attributes given the large number of combinations. Thus, the model has a base set of matrices that characterize and cover the basic categories of combination. However there may be missing matrices problem. For example, when there are more than one counties related to the same zipcode and only one of them is used for denoting the matrix, then there will be a problem on linking with the correct matrix if the policy uses a different county name. Once the geocoding process has been completed, the DPPT checks for missing matrices. If missing matrices are presented, the DPPT attempts to fix as many missing matrices as possible to avoid a potential problem when running the subsequent procedure. If some missing matrices are still present, the DPPT displays the missing matrices and the processor can manually fix those remaining missing matrices or delete them. Once resolved or if no problem with the missing matrices were ever present, the DPPT resumes execution. When the run is successful, the exposure data is used for both WSC and ILM, as shown in Fig. 4. B. Wind Speed Correction The WSC component, short for Wind Speed Correction, is derived from the meteorological discipline. This component simulates storm tracks and wind fields over tens of thousand of years based on stochastic algorithms and random historical initial conditions obtained from the historical records of the Atlantic tropical cyclone basin [1].
DPPT
Check missing matrices
DPPT
Fix missing matrices
If after fixing missing matricies, there are still remaining matrices Display Problem If missing matrices, display the matrices that are missing
Processor
Fix or delete remaining missing matricies
If the resumed process ran successfully DPPT
Export exposure data
Fig. 4.
Diagram of how the DPPT checks for missing matrices.
The meteorological component is further divided into Storm Forecast, Wind Field, and Wind Speed Correction subcomponents. The Storm Forecast subcomponent generates the stochastic storm tracks based on initial conditions and probability distribution functions [16]. The Wind Field subcomponent is activated only if the storm is close to Florida within a threshold distance. A wind swath of each storm is generated according to the winds interpolated to 10-minute over a 1km fixed grid, which entirely covers Florida and are stored into several tables for later use. The tables are referred as “tiles”; each of them represents a rectangular geographic area of Florida. These two subcomponents are only executed once for each FPHLM version, since they are independent of the input property portfolio. After the pre-processing steps, the geographic locations (latitude and longitude coordinates) are generated from the original portfolio. They are then used in the WSC component to estimate the exact wind speeds for each input location. The WSC uses roughness information and marine surface winds to calculate the terrain-corrected 3-second gust winds at the street level, which are subsequently used by the actuarial component to estimate the expected insurance losses for each property. In practice, since both Storm Forecast and Wind Field subcomponents are only run once per version, the framework highly optimizes the capability of the WSC component by implementing it as a distributed system utilizing MapReduce technique [19]. The WSC then efficiently generates stochastic storm sets on a computer cluster, which perfectly solved the issue we just pointed out in the introduction. MapReduce is a popular programming model introduced by Google [19], which could develop distributed applications to efficiently process large amounts of data. Hadoop, the open-source implementation, provides a distributed file system named Hadoop Distributed File System (HDFS) as well as
MapReduce. One of the significant features of MapReduce is that programmers could develop distributed application without worrying about fault-tolerance, data distribution and load balancing. A great amount of experiments has been conducted on the response time of WSC component after the new design with MapReduce. It demonstrated that there is a linear relationship between the response time and the number of policies in a portfolio. At the same time, the task capacity has an inverse linear relationship with the response time. For example, without using the new design, one dataset with more than 20 thousand of portfolios takes at lease 24 hours to generate the wind speed results. On the contrary, MapReduce WSC runs the data simultaneously and obtains the same results within one hour or less [16]. It is worth mentioning that this new design by using MapReduce technique is not only applicable for this specific field, but also could be expanded to other catastrophe modeling problems which need to deal with enormous dataset. The output of WSC component consists of wind speeds at different height for each policy location. Those wind speeds results together with the exposure and the engineering vulnerability matrices are used as the input for the next component, i.e., ILM. C. Insurance Loss Model Insurance Loss Model (ILM), which calculates the expected losses during storms, consists of three classes: personal residential (ILM-PR), commercial residential for low-rise policies (ILM-LB), and commercial residential for high-risk policies (ILM-MHB). The input data of ILM includes the wind speeds produced by the WSC component, the exposure and building characteristics of the residential properties (original data), and engineering vulnerability matrices [17]. As briefly introduced in the section III-A3, vulnerability matrices are a set of engineering parameters generated by a Monte Carlo simulation in order to determine the building external vulnerability at different wind speeds and estimate total building damage for each building type [1]. ILM outputs expected annual losses per policy and perevent based on the wind speed probability generated by WSC component and estimates various types of insured losses. Specifically, it produces aggregated losses at a variety of levels using different properties or the combination of them, such as county-level, zip code-level, the combination of county and construction type and so on. It provides a detailed insight into the modeled results, which will serve the purposes of verifying the modelled losses and assisting the decision making process. In addition, Probable Maximum Loss(PML) is another important outputs of ILM. It provides an annual probability, “the aggregate loss that is likely to be exceeded on a particular portfolio of residential exposures in Florida” [4]. In the proposed model, ILM is integrated with both Preprocessing and WSC components, as shown in Fig. 1, to generate expected losses and analysis results which are automatically formatted. Steps of running ILM is listed below:
1) Taking pre-processed data, WSC results and vulnerability matrices as a input of ILM component 2) Changing the following settings: a) FPHLM version b) Program option c) Coordinate source d) Winds files e) Vulnerability matrices f) Other settings 3) Set up ILM environment 4) Running ILM 5) Checking ILM results. If any error happens, a notification will be automatically sent to processor D. Integration FPHLM is an extremely comprehensive project designed and developed by using a series of cutting-edge technologies, software, tools and languages. It is a multidisciplinary project involving meteorology, computer science, statistics, engineering and actuarial, where every module requires different data structures and softwares. Therefore, effective integration of all the components is very critical for ensuring a coherent and effective system. However, utilizing current integration methods such as file transfer, shared database, and so on will not be sufficient [2]. As we described in the previous sections, the proposed computing framework includes two phases: execution and validation. The execution phase consists of three important components: pre-processing, WSC and ILM. In this integrated computing framework, all these components are highly integrated in order to automate the whole system by executing a coordination workflow which arranges and integrates those components. For this purpose, the coordination workflow designs each component as a single execution element and implements them in sequence. In addition, there is another element called data-transfer, which is responsible for communicating between execution elements and model data transformation between components. This framework simplifies integration process and is flexible and extendible to new technologies and yearly model changes. First of all, the original data including exposure and building characteristics is processed by the pre-processing component. Then, the cleaned and formatted data is automatically sent to the WSC by data-transfer element. Finally, WSC execute element generates wind speeds which are the input of ILM component, together with the building properties of the residential properties, as well as the engineering vulnerability matrices. Hence, the whole complicated and computationallycomplex steps of FPHLM from formatting data to generating analysis results are highly integrated and automated by the proposed computing framework. In order to monitor the entire process, we also designed a web-based data processing monitoring system following a three-tier software architecture pattern [17]. The presentation tier where users interact with the system is designed using current best practices such as JavaScripts, CSS and so on. The
logic tier is written in Java and is hosted on an Apache Tomcat server, and finally the data tier is built upon PostgreSQL and RDBMS. E. Semantic Rules After the execution phase, a set of high-level semantic rules is applied to validate the intermediate results from each component as well as the final output. Those rules are described by experts of each discipline and stored inside the model, which is used to detect anomaly and identify data inconsistency. It is not easy to produce all the regulations, since it covers a wide range of concepts related to various components. For example, in engineering component, the “Frame” structure is expected to have higher loss than the “Masonry” structure. If the output loss of a property with masonry construction type is higher than the one with frame, then it is a violation of a valid relationship between policy attribute values and output ranges. In both meteorological and actuarial domponents, these kind of semantic rules are applied to suggest potential problem and ensure the validity of the final output. To fulfill this purpose, experts from respective professional fields are responsible for providing detailed analysis and semantic rules on each possible scenario, which leads to the validation of the final model output. With all the possible high-level semantic rules well defined, the validation phase introduced in the integrated framework successfully supports the correctness of the whole model and provides useful semantic regulation ideas for the issues detected during the validation procedure to improve the whole model in each version iteration. IV. E XPERIMENTAL EVALUATION A set of experiments is conducted to evaluate the correctness of the model output. First of all, since the FPHLM is the only public model, it is difficult to compare every quantitative detail with other black box insurance models. However, qualitative analysis was able to carried out by comparing the model losses with the actual losses. All insurance loss models are tested by the same standard and can be considered at par with each other [2]. The Florida Commission verifies the hurricane loss projection methodology used for each insurance model. It means that FPHLM and all other private models must go through the same procedure committed by the commission to determine the validity of the model. Table I presents a sample of county level comparison results. The numbers show in the first two columns of the table are the total exposure divided by the total losses in the actual and the model run respectively, while the third column shows the difference of the two. These results demonstrate that our integrated computing framework has been successfully validated with historical losses. To view the validation results from another perspective, the actual structure losses are used for the comparison with the model structural losses as shown in Fig. 5. The blue points
TABLE I C OUNTY WISE FOR C OMPANY A AND H URRICANE F RANCES
Lee Sarasota Collier Madison Manatee
Company Actual (Exposure/losses) 0.000019 0.000122 0.000031 0.000865 0.000257
Fig. 5.
Modeled (Exposure/losses) 0.000025 0.000260 0.000081 0.000931 0.000456
Difference -0.000007 -0.000138 -0.000051 -0.000066 -0.000199
Model vs. Actua structural losses.
shown in the figure are all around the red line, which means most of the model results, are as similar as the actual losses. The results achieved by FHPLM have shown that it is possible to use this model with complex input to get the expected output for regulating the insurance rates. V. C ONCLUSIONS AND FUTURE WORK In this paper, we explained how a complex computing framework is able to integrate and execute components from various disciplines, including identifying data inconsistencies and validating model output by using semantic rules. This paper also provided insight into the various challenges facing this project daily and how they were addressed. In the near future, it will be of high priority for machine learning techniques to be incorporated into the DPPT, thus making it intelligible, and reducing the time wasted on fixing issues. The gecoding process will also be integrated into the DPPT, making preprocessing a fully automated process. Lastly, human mistakes will be further reduced by automatically formatting the final results. With a ton of work that still needs to be accomplished in the future, the FPHLM has the potential to be a fully automatic and intelligible system. ACKNOWLEDGMENT This work is partially supported by the Florida Office of Insurance Regulation under the Hurricane Loss Projection Model project. Opinions and conclusions expressed in this paper are those of the authors and do not necessarily reflect those of the Florida Office of Insurance Regulation.
R EFERENCES [1] S. Hamid, G. Kibria, S. Gulati, M. Powell, B. Annane, S. Cocke, J.P. Pinelli, K. Gurley, and S.-C. Chen, “Predicting losses of residential structures in the state of florida by the public hurricane loss evaluation model,” Statistical methodology, vol. 7, no. 5, pp. 552–573, 2010. [2] S.-C. Chen, M. Chen, N. Zhao, S. Hamid, K. Chatterjee, and M. Armella, “Florida public hurricane loss model: Research in multi-disciplinary system integration assisting government policy making,” Government Information Quarterly, vol. 26, no. 2, pp. 285–294, 2009. [3] S.-C. Chen, S. Gulati, S. Hamid, X. Huang, L. Luo, N. Morisseau-Leroy, M. D. Powell, C. Zhan, and C. Zhang, “A web-based distributed system for hurricane occurrence projection,” Software: Practice and Experience, vol. 34, no. 6, pp. 549–571, 2004. [4] “Florida commission on hurricane loss projection methodology: Report of activities as of november 1, 2013. page 13,” http://www.sbafla. com/method/portals/methodology/ReportOfActivities/2013 ROA.pdf, retrieved December 23, 2014. [5] “Air tropical cyclonesl model,” http://www.air-worldwide.com/Models/ Tropical-Cyclones-%28Hurricanes,-Typhoons%29/, retrieved December 20, 2014. [6] T. Lloyd, S. Latchman, and I. Dima, “Incorporating uncertainty in ground motion and local windspeed calculations into loss estimation calculations,” in Vulnerability, Uncertainty, and Risk@ sQuantification, Mitigation, and Management. ASCE, pp. 2207–2216. [7] “Rms u.s. hurricane model,” http://www.rms.com/models/models-cat/ storm-surge, retrieved December 20, 2014. [8] S. Khare, A. Bonazzi, N. West, E. Bellone, and S. Jewson, “On the modelling of over-ocean hurricane surface winds and their uncertainty,” Quarterly Journal of the Royal Meteorological Society, vol. 135, no. 642, pp. 1350–1365, 2009. [9] “Eqecat worldcatenterprise model,” http://www.eqecat.com/, retrieved December 20, 2014. [10] “Ara’s catastrophe model,” http://www.ara.com/hurloss/, retrieved December 20, 2014. [11] Z. Huang, D. V. Rosowsky, and P. R. Sparks, “Long-term hurricane risk assessment and expected damage to residential structures,” Reliability engineering & system safety, vol. 74, no. 3, pp. 239–249, 2001. [12] E. Canabarro, M. Finkemeier, R. R. Anderson, and F. Bendimerad, “Analyzing insurance-linked securities,” Journal of Risk Finance, The, vol. 1, no. 2, pp. 49–75, 2000. [13] E. C. Nordman and R. Piazza, “Catastrophe modeling from a regulatory perspective,” Journal of Insurance Regulation, vol. 15, pp. 360–371, 1997. [14] M. D. Powell, S. H. Houston, L. R. Amat, and N. Morisseau-Leroy, “The hrd real-time hurricane wind analysis system,” Journal of Wind Engineering and Industrial Aerodynamics, vol. 77, pp. 53–64, 1998. [15] P. J. Vickery, J. Lin, P. F. Skerlj, L. A. Twisdale Jr, and K. Huang, “Hazus-mh hurricane model methodology. i: hurricane hazard, terrain, and wind load modeling,” Natural Hazards Review, vol. 7, no. 2, pp. 82–93, 2006. [16] F. C. Fleites, S. Cocke, S.-C. Chen, and S. Hamid, “Efficiently integrating mapreduce-based computing into a hurricane loss projection model,” in Information Reuse and Integration (IRI), 2013 IEEE 14th International Conference on. IEEE, 2013, pp. 402–407. [17] G. Raul, D. Machado, H.-Y. Ha, Y. Yang, S.-C. Chen, and S. Hamid, “A web-based task-tracking collaboration system for the florida public hurricane loss model.” [18] “Arcgis platform,” http://www.esri.com/software/arcgis. [19] J. Dean and S. Ghemawat, “Mapreduce: simplified data processing on large clusters,” Communications of the ACM, vol. 51, no. 1, pp. 107–113, 2008.