Anal Bioanal Chem DOI 10.1007/s00216-014-8169-x
RESEARCH PAPER
Integrated plasma and urine metabolomics coupled with HPLC/QTOF-MS and chemometric analysis on potential biomarkers in liver injury and hepatoprotective effects of Er-Zhi-Wan Weifeng Yao & Haiwei Gu & Jiangjiang Zhu & Gregory Barding & Haibo Cheng & Beihua Bao & Li Zhang & Anwei Ding & Wei Li
Received: 25 June 2014 / Revised: 12 August 2014 / Accepted: 5 September 2014 # Springer-Verlag Berlin Heidelberg 2014
H. Gu Jiangxi Key Laboratory for Mass Spectrometry and Instrumentation, East China Institute of Technology, 330013 Nanchang, Jiangxi, China
(FLL) and Herba Ecliptae (HE). EZW is widely used to prevent and treat various liver injuries through the nourishment of the liver. However, the precise molecular mechanism of hepatoprotective effects has not been comprehensively explored. Here, an integrated metabolomics strategy was designed to assess the effects and possible mechanisms of EZW against carbon tetrachloride-induced liver injury, a commonly used model of both acute and chronic liver intoxication. High-performance chromatography/quadrupole time-of-flight mass spectrometry (HPLC/QTOF-MS) combined with chemometric approaches including principal component analysis (PCA) and partial least squares-discriminant analysis (PLS-DA) were used to discover differentiating metabolites in metabolomics data of rat plasma and urine. Results indicate six differentiating metabolites, tryptophan, sphinganine, tetrahydrocorticosterone, pipecolic acid, L-2-amino-3oxobutanoic acid and phosphoribosyl pyrophosphate, in the positive mode. Functional pathway analysis revealed that the alterations in these metabolites were associated with tryptophan metabolism, sphingolipid metabolism, steroid hormone biosynthesis, lysine degradation, glycine, serine and threonine metabolism, and pentose phosphate pathway. Of note, EZW has a potential pharmacological effect, which might be through regulating multiple perturbed pathways to the normal state. Our findings also showed that the robust integrated metabolomics techniques are promising for identifying more biomarkers and pathways and helping to clarify the function mechanisms of traditional Chinese medicine.
G. Barding Department of Chemistry and Biochemistry, California State Polytechnic University, Pomona, CA 91768, USA
Keywords Integrated metabolomics . Er-Zhi-Wan (EZW) . Hepatoprotective . HPLC/QTOF-MS . Chemometrics
Abstract Metabolomics techniques are the comprehensive assessment of endogenous metabolites in a biological system and may provide additional insight into the molecular mechanisms. Er-Zhi-Wan (EZW) is a traditional Chinese medicine formula, which contains Fructus Ligustri Lucidi
Electronic supplementary material The online version of this article (doi:10.1007/s00216-014-8169-x) contains supplementary material, which is available to authorized users. W. Yao : B. Bao : L. Zhang : A. Ding : W. Li College of Pharmacy, Nanjing University of Chinese Medicine, 210023 Nanjing, Jiangsu, China W. Yao : H. Gu : J. Zhu : G. Barding Northwest Metabolomics Research Center, Department of Anesthesiology and Pain Medicine, University of Washington, Seattle, WA 98109, USA H. Cheng Jiangsu Engineering Laboratory for Research and Industrialization of Empirical Formulae, Nanjing University of Chinese Medicine, 210023 Nanjing, Jiangsu, China B. Bao : L. Zhang (*) : A. Ding (*) Jiangsu Key Laboratory for Traditional Chinese Medicine Formulae Research, Nanjing University of Chinese Medicine, 210023 Nanjing, Jiangsu, China e-mail:
[email protected] e-mail:
[email protected]
W. Yao et al.
Introduction Metabolomics has emerged as a powerful approach in systems biology, focusing on a holistic investigation of the small molecular response of living systems to external stimuli, based on global metabolite profiles in biological samples such as plasma, urine, or tissue [1]. Metabolite profiling has enormous potential for the characterization of pathological states in animals [2] and humans [3], as well as providing diagnostic information and presenting mechanistic insight into biochemical effects of drugs [4, 5]. Metabolomics is also an ideal tool to bridge the gap between traditional Chinese medicine (TCM) and molecular pharmacology, partially shedding light on the interacting mechanism between herbal medicine and organism [6–8]. Several groups reported the application of metabolomics of TCM focused on understanding the pathophysiology and assisting in the liver injury or liver diseases [9, 10]. Er-Zhi-Wan (EZW), a famous traditional Chinese formulation firstly recorded in “Yi Bian” written in the Ming Dynasty, contains two herbs viz. Fructus Ligustri Lucidi (FLL) and Herba Ecliptae (HE). This formulation possesses the actions of tonifying the liver and kidney yin, nourishing body’s essential fluid, and arresting hemorrhage [11]. Pharmacological results indicated that EZW could have the abilities of being hepatoprotective [12], anti-aging [13], activating the estrogenic response [14], and anti-osteoporosis [15]. In our research group, the hepatoprotective property of EZW on the mice liver was determined by the activity determination of serum alanine aminotransferase (ALT) and aspirate aminotransferase (AST), superoxide dismutase (SOD), malondialdehyde (MDA), and the hepatic pathological changes following the treatment [16], indicating the significant recovery action of EZW. In the Pharmacopoeia of the People’s Republic of China [11], the main compounds of EZW, specnuezhenide, wedelolactone, and oleanolic acid, were used to control the quality of FLL, HE, and EZW, respectively. Specnuezhenide is a water-soluble biologically active compound for protecting the natural killer cytotoxicity from inhibition induced by cyclophosphamide and dexamethasone [17]. There was also a report of isolated wedelolactone from HE on suppressing LPS-induced caspase-11 expression by directly inhibiting the IKK Complex, which was tested under in vitro conditions on HeLa cells [18]. Oleanolic acid provides protection against experimental hepatic injury in rats and has been used as an oral remedy for human liver dysfunction [19, 20]. Pretreatment with oleanolic acid also considerably decreases augmentation of serum ALT activity and hepatic centrilobular necrosis induced by chemical hepatotoxicants in mice [21, 22]. However, the action mechanism of the overall effect of EZW has not been studied. To further investigate the hepatoprotective effect and mechanism of EZW, acute liver injury in rats was induced
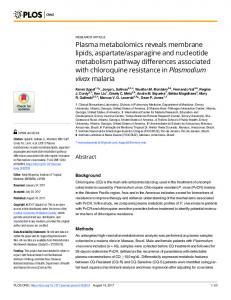
by the hepatoxicant CCl4 that produces acute liver injury in rodents [23–25]. In recent years, many metabolomics investigators have entered the field of hepatobiliary disease and a considerable volume of publications has appeared [26–28]. The aim of the present study was to find metabolite biomarkers to increase the understanding of the hepatoprotective properties of EZW for the first time. Therefore, a novel strategy for integrated plasma and urine metabolomics was described in this paper based on high-performance chromatography/quadrupole time-of-flight mass spectrometry (HPLC/QTOF-MS) and chemometric analysis (Fig. 1).
Materials and methods Chemicals and materials Acetonitrile and formic acid were obtained from Merck (Darmstadt, Germany). Deionized water was purified using a Milli-Q system (Millipore, Bedford, MA, USA). Leucine enkephalin was purchased from Sigma-Aldrich (MO, USA). Carbon tetrachloride (analytical grade) was purchased from Linfeng Chemical Co. (Shanghai, China). Fructus Ligustri Lucidi and Herba Ecliptae was identified by Professor Qinan Wu of Traditional Chinese Medicine Identification at Nanjing University of Chinese Medicine and purchased from Yonggang Decoction Pieces Co. (Bozhou, Anhui, China). Voucher specimens were deposited at the authors’ laboratory. Preparation of EZW sample EZW was prepared as follows: the powder of dry HE (50 g) was immersed in 500 mL of distilled water, decocted by boiling for 1 h and filtered through 16-layers of gauzes. The process above was repeated twice. The extracted solutions were pooled together and concentrated to approximately 0.3 g of HE per milliliter. Finally, the solution was freezedried. Before administration, the powder of dry FLL and freeze-dried HE were dissolved in 0.5 % sodium salt of carboxy methyl cellulose (CMC-Na) solution. One milliliter CMC-Na solution contained approximately 0.6 g of FLL and 0.6 g of HE crude drugs, respectively. For the quality control of EZW, four main compounds, nuezhenide, specnuezhenide, wedelolactone, and oleanic acid, were determined by a HPLCUV system on a C18 column [29]. The HPLC-UV method and chromatograms of standards and EZW sample were shown in Figure S3 of Supplemental material. The content of nuezhenide, specnuezhenide, wedelolactone, and oleanic acid were 0.337, 3.582, 0.109, and 11.536 mg/g, respectively. All the index compounds, specnuezhenide, wedelolactone, and oleanic acid in EZW sample for our metabolomics study exceeded the demands of the Pharmacopoeia of the People’s Republic of China, 2010 Edition.
Potential biomarkers and hepatoprotective effects of EZW
1st day- 6th day
7th day
8th day Liver
Control Vehicle
Vehicle Soybean oil
Liver
Model Vehicle EZW prevention
EZW treatment
LC/MS
LC/MS
Vehicle CCl4
Liver
EZW CCl4
EZW
Integrated Plasma Urine Chemometrics
LC/MS
Liver Vehicle
CCl4 EZW twice
Animal Handling Sample Preparation
Urine Plasma
LC/MS
Pathway analysis Effects of treatment Action mechanism
Pathology Profiling analysis
Chemometrics Pathway analysis
Fig. 1 Overview of the integrated metabolomics strategy. Vehicle, 0.5 % sodium salt of carboxymethyl cellulose (CMC-Na); EZW, FLL and freezedried HE were dissolved in 0.5 % CMC-Na solution; CCl4, 50 % carbon tetrachloride soybean oil solution
Animal handling and sample preparation Male Wistar rats (weighting 200±20 g) were supplied by the Experimental Animal Center of Nanjing University of Chinese Medicine (Jiangsu, China). Animal welfare and experimental procedures were strictly in accordance with the Guide for the Care and Use of Laboratory Animals (US National Research Council 1996, http://www.nap.edu/openbook.php?record_id= 5140&page=R1) and the related ethics regulations of Nanjing University of Chinese Medicine. All animals were fostered in an environmentally controlled breeding room (temperature maintained at about 25 °C and with a 12-h light/12-h dark cycle) for at least 1 week before starting the experiments and fed with standard laboratory food and water ad libitum. All the rats were randomly divided into four groups of seven rats each as follows: control group, model group, EZW-prevented group and EZW-treated group. The EZW-prevented group was orally administrated with EZW solution (1.2 g mL−1, 18 g kg−1 day−1) for 7 days. Meanwhile, the control, model, and EZW-treated groups were given orally with a volume of 0.5 % CMC-Na solution. After 1 h of the last drug administration, rats in the control group were injected intraperitoneally with soybean oil (1.5 mL kg−1), and the model, EZW-prevented and EZWtreated groups were intraperitoneally injected with 50 % carbon tetrachloride soybean oil solution (1.5 mL kg−1). After 2 h of liver injuring, the EZW-treated group was orally administrated with EZW solution (1.2 g mL−1, 18 g kg−1 day−1) twice in 12 h. Then, urine was collected for 24 h from metabolism cages at ambient temperature throughout the procedure and centrifuged (13,000 r min−1) at 5 °C for 15 min. The supernatants were stored frozen at −80 °C for analysis. At the end of 24 h, blood from ophthalmic vein plexus was collected in Eppendorf tube,
diluted with a 10 % disodium-EDTA solution, and centrifuged (13,000 r min−1) for 10 min. The supernatant, plasma, was stored frozen at−80 °C for metabolomics analysis. Lastly, the liver tissue was cut for pathological section diagnosis and electron microscopic observation. Metabolic profiling Plasma metabolite profiling Frozen plasma samples were thawed and the protein in 200 μl of plasma was precipitated by adding 600 μl methanol. The solutions were centrifuged at 13,000 r min−1 for 10 min. The resulting supernatants were dried under vacuum and reconstituted in 0.2 mL acetonitrile/water (80:20). The solution was then filtered by 0.25 μm membrane for injection. A pooled sample, which was a mixture of small random volumes from all 28 samples, was extracted in the same procedure as above. This sample was used as quality control (QC) and analyzed before or after every seven samples. Two microliters of filtrate was analyzed by an Agilent 6520 HPLC-QTOF system (Agilent Technologies, Santa Clara, CA) consisting of an Agilent 1200 SL liquid chromatograph coupled with a time-of-flight (TOF) mass spectrometer. An Agilent Poroshell 120 EC-C18 column (2.1×100 mm, 2.1 μm) with a binary solvent system (solvent A: water with 0.1 % formic acid and solvent B: 0.1 % formic acid in acetonitrile) was utilized. The gradient conditions were linear at 5–60 % B over 0–15 min, 60–90 % B over 15–30 min, and 90 %–100 % B over 30– 40 min. The flow rate was 0.35 mL min−1 and the column temperature was maintained at 30 °C. Electrospray ionization (ESI) was used in positive mode. The MS interface capillary
W. Yao et al.
was maintained at 350 °C, with a sheath gas flow of 8 L min−1. The spray voltage for positive ion injection was 4.0 kV. The instrument was scanned over a range of 50∼1700m/z. Agilent MassHunter Workstation LC-TOF and QTOF Acquisition software (B.02.01) was used for data acquisition. The typical total ion chromatograms of plasma of four groups were shown in Fig. S1 in the Electronic Supplementary Material (ESM). Urinary metabolite profiling Frozen urine samples were thawed, and 500 μl of methanol was added to 500 μl urine. The solutions were centrifuged at 13,000 rpm for 10 min. The resulting supernatants were filtered by 0.25 μm membrane for further analysis. A pooled sample, which was a mixture of small random volumes from all 28 samples, was processed in the same procedure as above. This sample was used as quality control and analyzed before or after every seven samples. LC/MS analysis was performed by the same Agilent 6520 HPLC/QTOF-MS system. The samples were gradient-eluted at 0.35 mL min−1 using (A) 0.1 % formic acid in water and (B) 0.1 % formic acid in acetonitrile (10 % B to 30 % B over 0–5 min, 30 % B to 50 % B over 5–8 min, 50 % B to 60 % B over 8–10 min, 60 % B to 90 % B over 10–13 min). A 5-μL sample aliquot was injected onto a 2.1×100 mm Agilent Poroshell 120 EC-C8 2.7 μm particle column heated to 30 °C. Electrospray ionization (ESI) was used in positive mode. The MS interface capillary was maintained at 350 °C, with a sheath gas flow of 8 L min−1. The spray voltage for positive ion injection was 4.0 kV. The instrument was scanned over a range of 50∼1700 m/z. Agilent MassHunter Workstation LC-TOF and QTOF Acquisition software (B.02.01) was used for data acquisition. The typical total ion chromatograms of urine of four groups were shown in ESM Fig. S2. Pathological evaluation After the blood and urine collection, rats were euthanized and portions of liver were harvested for pathological evaluation. The liver portions were subsequently embedded in paraffin wax and stained with H&E, after which pathological analysis was carried out to assess steatosis, inflammation, and necrosis via light microscopy (Olympus, Japan). Liver pathology was evaluated as described by Nanjiet al [30]. Multivariate data analysis and data processing All chromatographic data from plasma and urine were processed in the same manner by the freely available software package MZmine 2.20 (http://mzmine.sourceforge.net/), which performed peak seeking in an automated and unbiased way using mzdata file from Agilent MassHunter Workstation Data Acquisition. MZmine 2.20 was used for
peak noise removal, peak detection, and alignment. The intensity of each ion was normalized with respect to the total ion count to generate a data matrix that consisted of the retention time, m/z value, and the normalized peak area. The parameters of MZmine 2.20 in this study are listed in ESM Table S1. An overview about the similarity between the data sets can be obtained by calculating their correlation. Matrix correlation is a generalization of variable correlation, and several matrix correlation methods exist [31]. To illustrate the overlap degree of the plasma and urine LC/QTOF-MS data, the random variables (RV) coefficient [32] is the most appropriate for the current situation [33], because it is orientationindependent and easily calculated from the data. LC/QTOFMS datasets were the m-by-n matrices (m the number of samples; n the number of ion peaks) containing values of ion peak area at different retention time and/or m/z. However, directly applying such modality on crude data would result in spurious results due to the high dimensionality of the LC/ QTOF-MS datasets. Therefore, a dimension reduction using principal component analysis (PCA) was performed to reduce the unnecessary information of the data sets. After that, the RV coefficient was calculated to measure the degree of overlap between matrices. One of the goals in metabolomics area of research is to use data obtained from your samples to build an appropriate model for classification and determine the factors leading to differences among the samples. PCA and PLS-DA are often used for this purpose, as these techniques determine orthogonal latent variables that describe the input data and classify the data based on these variables [34]. PCA applied on matrix X—the objective is to recover the total variance from all datasets, but the presence of groups (products) in the data is not explicitly taken into account in the computation of the principal components. Partial least squares (PLS) is a particularly useful algorithm. Simply put, PLS is an extension of PCA, a non-supervised method to maximizing variance explained in X, which instead maximizes the covariance between X and Y (s). Before multivariate data analysis, ANOVA in Matlab software version 6.5 was used to eliminate the nonsignificant variables with the p value>0.05 for the plasma and urine data sets, respectively. For a straightforward and convenient explanation of metabolites, the LC/QTOF-MS data of plasma and urine from the same rat were simply concatenated and processed as a single data set. Then, the combined data set was exported into SIMCA-P software 11.5 (Umetrics AB, Umeå, Sweden) for projections to latent structures discriminate analysis (PLS-DA). Since the scale of metabolite concentrations may be different between plasma and urine, the unit variance (UV) scaling was selected to preprocess the data prior to PLS-DA and leave 1/7 out cross validation was used to determine the optimal model. The purpose of PLS-DA was to calculate models that differentiate between groups or
Potential biomarkers and hepatoprotective effects of EZW
classes. In the PLS-DA modeling, the samples from different groups were sorted into different classes using score plots, and endogenous metabolites that contribute to the classification were found by variable importance in the projection (VIP) values, which showed the importance of each variable to the classification. For measuring the quality of clustering within a PLS-DA scores plot, the degree-of-class-separation (DCS) was calculated between four groups, which was defined as the class-to-class variance divided by the sum of the within class variance on a scores plot using two sample types in the training set [35]. Biomarker identification and metabolic pathway analysis With regard to the identification of biomarkers, the ion spectrum was matched with the structure message of metabolites acquired from available biochemical databases, such as METLIN (http://www.metlin.scipps.edu/) [36], HMDB (http://www.hmdb.ca/) [37] and KEGG (http://www.genome. jp/kegg/) [38]. The pathway analysis of potential biomarkers was performed with MetPA software based on the pathway library of Rattus norvegicus (rat) to identify the metabolic pathways. MetPA is now part of MetaboAnalyst (http:// www.metaboanalyst.ca/MetaboAnalyst/faces/Home.jsp) [39].
Results and discussion Pathological study Figure 2 shows the representative pathological slices of rat livers from the control group (a), model group (b), EZWprevented group (c), and EZW-treated group (d). Typical pathological characteristics of liver injury, such as swollen endothelial cells and thickened endomembrane were observed in CCl4-treated rats (Fig. 2b). For EZW-prevented group and EZW-treated group, similar pathological features of liver injury were still observed; however, these symptoms were less obvious (Fig. 2c, d). Additionally, compared to EZW-treated group, the protective function of EZW was better in EZWprevented group. The above phenomena indicated that the artificial modeling of liver injury in rats was successful and that the pathological condition was improved with administration of EZW. The correlation between plasma and urine metabolomics datasets The RV coefficient takes values between 0 (no overlap) and 1 (total overlap), measuring the closeness of two data set that may each be represented in a matrix. After mean centering, PCA was used to reduce the dimension of plasma and urine
data matrices. Then, the RV coefficient was calculated to measure the degree of overlap (Table 1). The cumulative amounts of explained variation of the principal components in both plasma and urine matrices are larger than 90 % for six to ten principal components, representing the major information in the data sets. After the first seven components, the RV coefficient is 0.26, and it is constant for more components. This means that there is an overlap between the plasma and urine data sets. Hence, it is helpful to combine these two data sets. Chemometric analysis with plasma and urine metabolomics data As a first step in chemometric analysis, PCA, an unsupervised multivariate data analysis technique, was performed to visualize grouping trends and outliers in data. Principal component 1 versus principal component 2 score plots of the plasma and urine data are shown in Fig. 3a, b, respectively. The QC samples clustered tightly in both score plots, illustrating the stability of the LC/MS platform throughout the analysis. To reflect the metabolite difference among control, EZWprevented, EZW-treated, and model groups along with the efficacies of EZW against the liver injury, PLS-DA was employed to construct the model where the variable matrix was made up of LC/MS ion peak areas of plasma and urine metabolite. Generally, the quality of PLS model was evaluated by the relevant R2X (the cumulative fraction of sum of squares of X explained by components), R2Y (the cumulative sum of squares of all the y-variables explained by the extracted components), and Q2Y (the fraction of the total variation of Y (PLS) that can be predicted by the extracted components). Without a high R2Y, it is impossible to obtain a high Q2Y. A Q2Y>0.5 is regarded as good and a Q2Y>0.9 as excellent, but these guidelines are of course heavily application dependent. Differences between R2Y and Q2Y larger than 0.2∼0.3 indicate the presence of many irrelevant model terms or a few outlying data points [40]. Different data pretreatment methods, i.e., centering, autoscaling, and Pareto-scaling, were found to greatly affect the outcome of the data analysis and thus the rank, from a biological point of view, of the most important metabolites [41]. The data pretreatment methods used prior to data analysis were tested in our study (see ESM Table S2), and the “UV (autoscaling)” was selected for further PLS-DA. As shown in Table 2, the values of R2X, R2Y, and Q2Y were also acceptable for single plasma or urine data sets, but the combination of two data sets supplied better results (R2Y=0.985, Q2Y=0.937), indicating an excellent prediction. Compare to the result before ANOVA, the lower latent variable number and the lower difference (0.048) between R2Y and Q2Y further make the analysis stable and confident. The compared performances of PLSDA are shown in the 3D-score plots (Fig. 4). In Fig. 4A,
W. Yao et al. Fig. 2 Pathological photographs of rat livers (H & E, ×100). a Control; b Model; c EZWprevented; d EZW-treated
B, the single source of metabolomics data, plasma, or urine, could not make the border obvious among the four groups. In the same direction, the distribution among four groups was more obvious for the combined plasma and urine data sets (Fig. 4c), suggesting the more discriminant information from the integrated metabolomics data. In this work, the quantitative index, DCS, on the PLS-DA scores
plot was also calculated between different groups from the integrated and single data sets (see ESM Table S3–S5). For the integrated plasma and urine data, the DCS between Control and Model groups was 10.5617, it was 12.2244 between Control and EZW-prevented groups, and it was 8.6144 between Control and EZW-treated groups. This metric was 9.4230 between Model and
Table 1 Correlation between the plasma and urine metabolomics data matrices PCsa
Plasma (%)
RVd
Urine (%)
Varianceb
Cumulative variancec
Variance
Cumulative variance
1
42.93
42.93
45.41
45.41
0.0189
2 3 4 5 6 7 8 9 10
35.51 8.05 3.42 3.02 1.73 1.62 0.78 0.68 0.62
78.44 86.49 89.91 92.93 94.66 96.28 97.06 97.74 98.36
26.50 12.11 5.21 2.09 1.47 1.06 0.85 0.77 0.67
71.91 84.02 89.23 91.32 92.80 93.87 94.72 95.50 96.16
0.2022 0.2324 0.2455 0.2525 0.2564 0.2615 0.2639 0.2646 0.2656
a
PCs principal components
b
The percentage of explained variance for each PC
c
The cumulative percentage of explained variance
d
The RV coefficient: a matrix correlation coefficient
Potential biomarkers and hepatoprotective effects of EZW Fig. 3 The score plots of principal components analysis. (a) plasma, R2X=0.645, Q2 =0.395; (b) urine, R2X=0.778, Q2 =0.584
EZW-prevented groups and 6.2819 between Model and EZW-treated groups. Most of the DCS values showed how much better can PLS-DA cluster the different groups using the integrated data set than using the single data set. The PCA 3D-score plot (see ESM Fig. S4) and its DCS values (see ESM Table S6) were also compared with those of PLS-DA’s, and we can find less DCS values and worse separation.
Table 2 Summary of PLS-DA Profiles
Aa
R2X
R2Y
Q2Y
Differenceb
Plasma
8
0.883
0.973
0.870
0.103
Plasmac Urine Urinec Plasma+urine Plasma+urinec
5 7 4 7 6
0.719 0.725 0.629 0.700 0.672
0.917 0.979 0.935 0.981 0.985
0.812 0.880 0.875 0.913 0.937
0.105 0.099 0.060 0.068 0.048
a
The number of latent variables
b
The difference between R2 Y and Q2 Y
c
The data after ANOVA
Tentative identification of the biomarkers and pathway analysis The PLS-DA model built above simultaneously considers the plasma and urine metabolomic profiles, and then variable selection is brought forth as the important practical issues for metabolomics. The data set was screened with a VIP value larger than 1.0 for further metabolite identification. Seven potential biomarkers are summarized in Table 3 with their corresponding retention time, m/z, formula, adduct ion, trends, and related metabolic pathways. Differentially expressed metabolites were pipecolic acid, tryptophan, sphinganine, and tetrahydrocorticosterone in plasma. In addition, pipecolic acid, L-2-amino-3-oxobutanoic acid, and phosphoribosyl pyrophosphate were significant metabolites in urine. All of them have the direction of perturbation (up- or downregulation) in the four groups. They could be considered as potential markers for biological pathway analysis. Compared with other multiplatform metabolomics data analysis [42, 43], it has indicated that a better discriminate model could be built with the integrated plasma and urine data from the separation of different groups in Fig. 4 and the DCS values. This data processing of combination could help us to search the most
W. Yao et al.
Fig. 4 The 3D score plot (t1/t2/t3) of PLS. (a) plasma, R2X=0.719, R2Y=0.917, Q2Y=0.812; (b) urine, R2X=0.629, R2Y=0.935, Q2Y=0.875; (c) plasma+urine, R2X=0.672, R2Y=0.985, Q2Y=0.937
significant biomarkers in the samples according to the best model. And an important biomarker, pipecolic acid, has been detected in both plasma and urine, which really exists in the above two kinds of samples [44]. Metabolite profiling focuses on the analysis of a group of metabolites related to a specific metabolic pathway in biological states [45, 46]. To determine whether our observations of changes in the metabolites in the setting of liver injury in fact reflected coordinate changes in defined metabolic pathways, we used the pathway library of R. norvegicus (rat) in MetPA software to identify the most relevant pathways involved in the conditions under study. Six metabolic pathways,
tryptophan metabolism, sphingolipid metabolism, steroid hormone biosynthesis, lysine degradation, glycine, serine and threonine metabolism, and pentose phosphate pathway, were identified (Table 3). Effects of EZW on the metabolic pathway The changed concentrations of potential biomarkers (Table 3) suggested that the disturbed pathways in liver injury rats, such as tryptophan metabolism, sphingolipid metabolism, steroid hormone biosynthesis, lysine degradation, glycine, serine and threonine metabolism, and pentose phosphate pathway, were
Potential biomarkers and hepatoprotective effects of EZW Table 3 Potential biomarkers and their metabolic pathways in the pathway library of Rattus norvegicus Matrix No R.T.(min) Mass (m/ Adduct z) ion
Delta
Formula
Plasma 1 2 3 4
1.218 2.6 9.427 9.576
130.0856 227.0788 340.2613 351.2525
0.0006 0.0002 0.0001 0.0005
C6H11NO2 Pipecolic acid C11H12N2O2 L-Tryptophan C18H39NO2 Sphinganine C21H34O4 Tetrahydrocorticosterone
Urine
1 2
0.712 0.845
130.0874 M+H 140.0263 M+Na
0.0011 C6H11NO2 0.0055 C4H7NO3
3
10.22
390.9554 M+H
0.0037 C5H13O14P3
M+H M+Na M+K M+H
Compound
Pipecolic acid L-2-Amino-3oxobutanoic acid Phosphoribosyl pyrophosphate
Trenda Trendb Trendc Related pathways ↑ ↓ ↓ ↑
↓ ↑ ↑ ↓
↓ ↑ ↑ ↓
↑ ↑
↓ ↓
↓ ↓
↑
↓
↓
Lysine degradation Tryptophan metabolism Sphingolipid metabolism Steroid hormone biosynthesis Lysine degradation Glycine, serine and threonine metabolism Pentose phosphate pathway
a
↑ or ↓ represents the up- or downregulation of the metabolites in model group compared with the control group
b
↑ or ↓ represents the significant up- or downregulation of the metabolites in EZW-prevented group compared with the model group
c
↑ or ↓ represents the significant up- or downregulation of the metabolites in EZW-treated group compared with the model group
affected by the administration of EZW. According to the PLS score plot (Fig. 4), the metabolic patterns of the rats subjected to control, EZW-prevented, EZW-treated, and model groups were not discriminated visibly with the single plasma or urine dataset. The result of integrated data showed clear separation in the PLS score plot (Fig. 4c), indicating the existence of differences among four groups. In order to further demonstrate the action of EZW, the PLS score plot (t2 versus t3) was shown in Fig. 5. Compared to the model group, the EZWprevented, control, and EZW-treated groups were situated at the same level in the score plot, indicating the recovery of body to some extent after the administration of EZW.
Here, the important plasma and urine biomarkers associated with liver injury and EZW-treated modulation were analyzed in these pathways (Fig. 6). Tryptophan is an essential amino acid in the tryptophan metabolism. Amino acids, including tryptophan, act as building blocks in protein biosynthesis through the action of tryptophanyl tRNA synthetase. This metabolite demonstrated that abnormal metabolism occurred in the model animals and metabolic analysis of liver injury was inferred from changes in the intermediates during substance metabolism [47]. In sphingolipids metabolism, sphinganine is ubiquitous but essential structural and functional components of the cell. As a
Fig. 5 The PLS-DA scores (t2/t3) plot of integrated plasma and urine data. R2X[2]=0.161, R2X[3]=0.119
W. Yao et al. Fig. 6 The network of the potential biomarkers changing for liver injury and EZW-treated modulation. Metabolites in yellow boxes represent biomarkers determined by LC/QTOF-MS. The green boxes represent the pathway related to the liver injury. The blue boxes are the possible pathways succeeded. PRPP phosphoribosyl pyrophosphate
Tetrahydrocorticosterone
Steroid hormone biosynthesis
Lysine degradation
Sphingolipid metabolism
Tryptophan metabolism
L-Lysine Pipecolic acid
Glycine, serine and threonine metabolism
Palmitoyl-CoA
Pentose phosphate pathway
L-Serine
L-Tryptophan
D-Glucose-6P Hydroxypyruvate D-Gluconate-6P
Glycine
Glutaryl-CoA
Sphinganine
Crotonoyl-CoA (S)-3-Hydroxybutanoyl-CoA Acetoacetyl-CoA Acetyl-CoA Glycolysis
TCA cycle
D-Glycerate
3-Dehydro-sphinganine
2-Oxoadipate
D-Glycerate-2P
L-2-Amino-3oxobutanoic acid Dihydro-ceramide Aminoacetone Ceramide D-Glycerate-3P Sphingosine Methylaglyoxal
D-Ribulose-5P D-Ribose-5P PRPP
Psychosine Sphingophospholipid metabolism
sphingolipid metabolite, sphinganine-1-phosphate is produced by the ATP-dependent phosphorylation of sphinganine by sphingosine kinases 2 in sphingolipid metabolism. It has important biological roles in various physiological as well as pathophysiological events. Recently, sphinganine-1phosphate has been reported to protect against both liver and kidney injury [48]. In this study, the decreased concentration of sphinganine in the model group indicates that the CCl4injured rats might lose the protection of normal metabolite. Tetrahydrocorticosterone is the compound in the steroid hormone biosynthesis. Recently, Lucki [49] has discussed how steroid hormones control sphingolipid metabolism and sphingolipids, including ceramide, sphingosine-1-phosphate, and sphingosine, have been found to modulate steroid hormone secretion at multiple levels. Hence, tetrahydrocorticosterone might indirectly affect the liver protection function of the sphinganine-1-phosphate through the steroid hormone biosynthesis. By the prevented or treated administration of EZW, the concentrations of sphinganine and tetrahydrocorticosterone were recovered, and the liver of rats could be protected again. In lysine degradation, pipecolic acid is a metabolite of lysine found in physiological fluids such as urine and plasma [50]. It was found by Fujita [44] that both D-pipecolic acid and L-pipecolic acid were moderately increased in patients with liver cirrhosis and in patients with chronic hepatic encephalopathy. Although L-pipecolic acid remained the predominantly circulating form, D-pipecolic acid was proportionally higher in liver disease patients than in healthy individuals. Patients with liver cirrhosis have elevated levels of GABA and pipecolic acid in plasma [51]. And plasma pipecolic acid is closely correlated with plasma ammonia concentration. This
Pyruvate metabolism
Glycolysis
Purine, Pyrimidine metabolism
work also revealed that the degree of portal hypertension in cirrhotic patients may be predicted by plasma pipecolic acid. In our study, the concentration of pipecolic acid is increased in the model group and the EZW help the pipecolic acid levels in both plasma and urine to increase, indicating the recovery of liver function. Phosphoribosyl pyrophosphate is a pentose phosphate from the pentose phosphate pathway. The pentose phosphate pathway in animals fulfills two important cell requirements: (1) for ribose 5-phosphate for the synthesis of nucleotides and nucleic acids; and (2) for reducing power in the form of NADPH. In photosynthesis, it functions to regenerate the primary CO2 acceptor, ribulose bisphosphate, from the hexose phosphates produced [52]. Chloroplasts utilize radiant energy to produce ATP, required for the production of ribulose 1,5bisphosphate from ribulose 5-phosphate and also for the reduction of 3-phosphoglyceric acid to glyceraldehyde 3-phosphate. Some research results also appear to demonstrate that phosphoribosyl pyrophosphate bioavailability in liver as a key compound is most closely controlled by the energy charge [53]. The concentration of phosphoribosyl pyrophosphate increases in the model group, indicating some disorder in liver and then it is decreasing in EZW-prevented and treated groups.
Conclusion A robust integrated metabolomics approach utilizing HPLC/QTOF-MS was developed to investigate the influence of Er-Zhi-Wan on the CCl 4 liver-injured rats. Pattern
Potential biomarkers and hepatoprotective effects of EZW
recognition analysis allowed the metabolic profiles of control, EZW-prevented, EZW-treated, and model groups to be separated clearly, indicating a more comprehensive information from integrated information. Six potential biomarkers were identified from plasma and urine specimens. According to the pathway library of R. norvegicus (rat), six metabolic pathways were disturbed among groups, relating to tryptophan metabolism, sphingolipid metabolism, steroid hormone biosynthesis, lysine degradation, glycine, serine and threonine metabolism, and pentose phosphate pathway. The combination of plasma and urine metabolomics provides a powerful means of revealing changes in the metabolome due to liver injury and EZW efficacy. The presented metabolomics strategy could be extended to other multiple-source metabolomics studies, e.g., different analytical platforms, different omics or different specimens. Certainly, for quantitatively investigating effect of EZW for liver injury, these biomarkers should be determined more accurately. The quantitative analysis of biomarkers should be done in a further study to characterize the effects of traditional Chinese medicine to prevent liver injury and protect the liver. Acknowledgments This work was financially supported by National Natural Science Foundation of China (Grant No. 81001599, 81173547, and 81373972) and A Project Funded by the Priority Academic Program Development of Jiangsu Higher Education Institutions (PAPD).
References 1. Griffin JL, Walker LA, Garrod S, Holmes E, Shore RF, Nicholson JK (2000) Comp Biochem Physiol, Part B: Biochem Mol Biol 127:357– 367 2. Irie M, Fujimura Y, Yamato M, Miura D, Wariishi H (2014) Metabolomics 10:473–483 3. Li M, Li H, Jiang P, Liu XQ, Xu D, Wang F (2014) Mol BioSyst 10: 1055–1062 4. Zhao XJ, Zhang Y, Meng XL, Yin PY, Deng C, Chen J, Wang Z, Xu GW (2008) J Chromatogr B Anal Technol Biomed Life Sci 873:151– 158 5. Antti H, Ebbels TMD, Keun HC, Bollard ME, Beckonert O, Lindon JC, Nicholson JK, Holmes E (2004) Chemom Intell Lab Syst 73: 139–149 6. Beyoğlu D, Idle JR (2013) J Hepatol 59(4):842–858 7. Qiu J (2007) Nature 448:126–128 8. Qiu J (2007) Nat Rev Drug Discov 6:506–507 9. Wang M, Lamers RJ, Korthout HJ (2005) Phytother Res 19:173–182 10. Gou X, Tao Q, Feng Q, Peng J, Sun S, Cao H (2013) J Pharm Biomed Anal 74:62–65 11. The National Pharmacopoeia Commission of P.R. China (2010) Pharmacopoeia of the People’s Republic of China, vol. 1. Chinese Medical Science and Technology Press, Beijing, pp 412–413 12. Zhang AH, Sun H, Dou SS, Sun WJ, Wu XH, Wang P, Wang XJ (2013) Analyst 138:353–361 13. Cai XJ, Yan B, Yao WF, Zhang L, Huang MY, Ding AW (2011) Chinese Pharmacological Bull 27(12):1774–1775 14. Gao HL, Wang DQ, Wang XY (2010) Chin J Integr Med 16(6):504– 509
15. Xu H, Su ZR, Huang W, Choi RC, Zheng YZ, Lau DT, Dong TT, Wang ZT, Tsim KW (2012) J Ethnopharmacol 143(1): 109–115 16. Yan B, Cai XJ, Yao WF, Zhang L, Huang MY, Ding AW (2012) China JChin Mater Med 37(9):1303–1305 17. Zhen C, Lifu S, Jinhong H, Qian S (1998) Acad J Sec Mil Med Univ 19(1):76–78 18. Kobori M, Yang Z, Gong D, Heissmeyer V, Zhu H, Jung YK, Gakidis MAM, Rao A, Sekine T, Ikegami F, Yuan C, Yuan J (2004) Cell Death Differ 11(1):123–130 19. Han DW, Ma XH, Zhao YC, Yin L, Ji CX (1982) J Tradit Chin Med 2(2):83–90 20. Liu J (2005) J Ethnopharmacol 100(1–2):92–94 21. Liu J, Liu Y, Klaassen CD (1994) J Ethnopharmacol 42(3):183–191 22. Liu J, Liu Y, Parkinson A, Klaassen CD (1995) J Pharmacol Exp Ther 275(2):768–774 23. Cheng M, Wang QW, Fan YK, Liu XY, Wang L, Xie RM, Ho CC, Sun WJ (2011) J Ethnopharmacol 138(2):279–285 24. Shimada T, Nakanishi T, Toyama A, Yamauchi S, Kanzaki A, Fujiwake H, Sato TA, Ikegawa M (2010) J Proteome Res 9(9): 4490–4500 25. Henkel C, Roderfeld M, Weiskirchen R, Berres ML, Hillebrandt S, Lammert F, Meyer HE, Stühler K, Graf J, Roeb E (2006) Proteomics 6(24):6538–6548 26. Atmaca M, Bilgin HM, Obay BD, Diken H, Kelle M, Kale E (2011) J Physiol Biochem 67(4):569–576 27. van Ginneken V, Verhey E, Poelmann R, Ramakers R, van Dijk KW, Ham L (2007) Biochim Biophys Acta 1771:1263–1270 28. Garcia-Canaveras JC, Donato MT, Castell JV, Lahoz A (2011) J Proteome Res 10:4825–4834 29. He M, Yao WF, Zhang L, Ding AW (2012) Zhongguo Zhong Yao Za Zhi 37(5):594–596 30. Nanji AA, Mendenhall CL, French SW (1989) Clin Exp Res 13(1): 15–19 31. Ramsay JO, Ten Berge JMF, Styan GPH (1984) Psychometrika 49: 403–423 32. Robert P, Escoufier Y (1976) Appl Stat 25:257–265 33. Smilde AK, Westerhuis JA, De Jong S (2003) J Chemom 17:323– 337 34. Eriksson L, Johansson E, Kettaneh N, Trygg J, Wikstrom C, Wold S (2006) Multivariate and megavariate data analysis part I: basic principles and applications, second revised and enlarged edition. Sweden, Umetrics Academy, p 189 35. Pierce KM, Hope JL, Johnson KJ, Wright BW, Synovec RE (2005) J Chromatogr A 1096:101–110 36. Smith CA, O’Maille G, Want EJ, Qin C, Trauger SA, Brandon TR, Custodio DE, Abagyan R, Siuzdak G (2005) Ther Drug Monit 27(6): 747–751 37. Wishart DS, Tzur D, Knox C. (2007) Nucleic Acids Res. (Database issue): D521-526. 38. Kanehisa M (2002) Novartis Found Symp 247:91–101 39. Xia J, Mandal R, Sinelnikov IV, Broadhurst D, Wishart DS (2012) Nucleic Acids Res. 40(Web Server issue): W127-33. 40. Eriksson L, Johansson E, Kettaneh N, Trygg J, Wikstrom C, Wold S (2006) Multivariate and megavariate data analysis part I: basic principles and applications, second revised and enlarged edition. Umetrics Academy, Sweden, p 97 41. Van den Berg R, Hoefsloot HCJ, Westerhuis J, Smilde A, van der Werf MJ (2006) BMC Genomics 7:142 42. Huang Y, Tian Y, Li G, Li Y, Yin X, Peng C, Xu F, Zhang Z (2013) Anal Bioanal Chem 405:4811–4822 43. Zhang H, Fu P, Ke B, Wang S, Li M, Han L, Peng C, Zhang W, Liu R (2014) J Ethnopharmacol 154(1):55–64 44. Fujita T, Hada T, Higashino K (1999) Clin Chim Acta 287:145–156 45. Musiek ES, Yin H, Milne GL, Morrow JD (2005) Lipids 40(10):987– 994
W. Yao et al. 46. Cho HJ, Kim JD, Lee WY, Chung BC, Choi MH (2009) Anal Chim Acta 632(1):101–108 47. Zhang AH, Sun H, Sun WJ, Jiao GZ, Wang XJ (2013) Anal Methods 5:5294–5301 48. Park SW, Kim M, Chen SW, Brown KM, D’Agati VD, Lee HT (2010) Lab Investig 90(8):1209–1224 49. Natasha CL, Marion BS (2010) Steroids 75(6):390–399
50. Fujita T, Amuro Y, Hada T, Higashino K (1999) Clin Chim Acta 287(1–2):99–109 51. Matsuda Y, Fujita T, Hada T, Higashino K (2000) Hepatol Res 18(2): 132–140 52. Bernard LH (2002) J Biol Chem 277(50):47965–47971 53. Kunjara MS, Ali SA, Greenbaum AL, McLean P (1987) Biochem J 244:101–108