Jul 2, 2008 - Automated irrigation scheduling, crop water stress, infrared ..... automation: Cases from drip and center pivot irrigation of corn and soybean.
An ASABE Meeting Presentation Paper Number: 083452
Integration of Wireless Sensor Networks into Moving Irrigation Systems for Automatic Irrigation Scheduling Susan A. O’Shaughnessy, ASABE Member Agricultural Engineer, USDA-ARS, Conservation and Production Laboratory, P.O. Drawer 10, Bushland, TX 79012
Steven R. Evett, ASABE Member Soil Scientist, USDA-ARS, Conservation and Production Laboratory, P.O. Drawer 10, Bushland, TX 79012
Written for presentation at the 2008 ASABE Annual International Meeting Sponsored by ASABE Rhode Island Convention Center Providence, Rhode Island June 29 – July 2, 2008 Abstract. A six-span center pivot irrigation system was used as a platform for testing two wireless sensor networks (WSN) of infrared thermometers. The cropped field was a semi-circle, divided into six pie-slice sections of which three were irrigated manually and three were irrigated automatically based on the time temperature threshold method. One network was mounted on masts fixed to the pivot arm (Pivot-WSN) and was programmed with mesh networking firmware. The second wireless network was comprised of sensors programmed with non-mesh firmware and was deployed in the field (Field-WSN). Our objectives were to: (1) compare the performance of a mesh and non-mesh networking systems of wireless sensors on a center pivot platform; (2) investigate the relationships between crop canopy, sensor body, and air temperatures; and (3) investigate automatic irrigation scheduling using data from wireless sensor networks. The Field-WSN outperformed the Pivot-WSN; data packet retrieval was more than 90% successful for 93% of the growing season using the non-mesh networking firmware for the WSN established in
the field. The Pivot-WSN performed only 70% of the time at this same level of success. Temperature differences between the body temperature of the infrared thermometer and crop canopy varied as much as -5.1 and 7.6ºC. Transmission loss and incorrect calibrations of the wireless sensor modules affected irrigation scheduling throughout the season. However, post-experiment improvementssoftware upgrades and memory expansion of the RF module (by the manufacturer), changes to the calibration protocol, and an algorithm to interpolate the values of non-captured data are expected to improve the overall performance of the wireless network systems and automatic irrigation scheduling for the upcoming growing season. Keywords. Automated irrigation scheduling, crop water stress, infrared thermometry, wireless sensors.
Introduction Infrared thermometers (IRTs) have been widely used in agricultural research as a method to measure canopy temperature, an indicator of crop water stress. Although IRTs have proven to be reliable within the critical range for plant stress, typical wired IRTs would be cumbersome for a grower to set up, maintain, and dismantle each irrigation season in a commercial system. A wireless sensor network of IRTs integrated onto a center pivot lateral can facilitate the implementation of a fully automated irrigation system with sensors that can easily be mounted and dismounted from the system lateral line. Earlier research showed that the timing of drip irrigation applications could be triggered by a signal that is positive if the crop canopy temperature is greater than a threshold temperature for greater than a region-specific threshold time (Evett et al., 1996, 2000). Crop stress can be detected non-invasively by using IRTs to measure canopy temperature (Wanjura et al., 2000). The Time Temperature Threshold (TTT) method has been successful in automatically scheduling irrigations based on the needs of well-watered corn and soybean crops (Evett et al., 2006; Peters and Evett, 2006a, b).
Commercialization of a fully automated center pivot system using the TTT method will require the elimination of sensor wiring to reduce costs and complexity, and to improve system robustness while avoiding conflicts with farming operations. Challenges inherent in any wireless system include adequate bandwidth, efficient routing protocols, power usage, electromagnetic interference, radio range, and battery life (Zhang, 2004). Despite these pitfalls, wireless technology is becoming progressively integrated into agricultural applications. Wireless technology has become a critical component of precision agricultural applications in research such as the monitoring, control, and automatic irrigation scheduling of continuous-move sprinklers in response to sensor measurements, data collection for spatial field mapping, and the implementation of variable rate irrigation systems (Pierce et al., 2007). Competition within the semi-conductor industry and widespread demand for wireless communication across all user sectors are driving the rapid evolution of improved integrated circuits, radio modules, and their diminishing costs. The objectives of this study were to: (1) compare the characteristics of a mesh and non-mesh networking system of wireless sensors; (2) investigate the relationships between crop canopy, sensor body, and air temperatures; and (3) investigate automatic irrigation scheduling using data from wireless sensor networks.
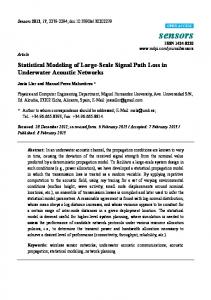
Materials and Methods We developed wireless infrared sensor modules (Fig. 1) by designing electronic circuit boards
3
Signal Conditioning CircuitInfrared Thermometer
RF Module-
A/D conversion of IRT signal
XBee platform
Calibration
UART device
Power Supply – Battery recharge with solar panel
Sensor body temperature Battery voltage monitoring
Figure 1. Block diagram depicting the main components of the sensor module which was comprised of the infrared thermometer, signal conditioning circuit, RF module, and external power supply. to interface between an infrared thermometer (Exergen1, Inc., Watertown, Mass.), and a radio frequency (RF) module, (MaxStream®, Orem, Utah). A microprocessor was used to manage the digitized data, which was fed into the RF module, and transmitted to the embedded computer at the center pivot (O’Shaughnessy and Evett, 2007). Data collected from each sensor module included the reading from the infrared thermometer, the sensor body temperature, the battery voltage, and the sensor address (Table 1).
1
Mention of trade names or commercial products in this publication is solely for the purpose of providing specific information and does not imply recommendation or endorsement by the U.S. Department of Agriculture.
4
Table 1. Wireless Sensor Module Output Source Infrared thermometer Precision IC thermometer Battery voltage RF address
Purpose Measure crop canopy temperature Measure sensor body temperature Monitor power supply Identify data source
Units mV mV mV ASCII
The XBee-Pro platform modules were off-the-shelf, low cost, low power (~100 mW) components that used the IEEE802.15.4 standard for wireless communication. These modules transmitted in the 2.4 GHz range, taking advantage of direct sequence spread spectrum channel selection where the bandwidth per channel is 2 MHz and the channel spacing is 5 MHz. A whip antenna with a gain of approximately 1.8 dBi was chosen due to its superior performance to a chip and dipole antenna at 0.6 and 2.0 m above grade (O’Shaughnessy and Evett, 2007). A simple recharge circuit using an adjustable voltage regulator and isolating diodes was designed to provide trickle recharge current from a 6W, 9V solar panel to a sealed, 6VDC lead acid battery. The calibration of the wireless IRTs was completed using a black body calibrator (BB701, Omega Engineering, Stamford, Conn.) as the target temperature. The blackbody temperature was determined by reading the voltage across the platinum resistance temperature detector (RTD) of the black body calibrator, rather than using the digital output. The RTD was wired externally to the datalogger in a 3-wire bridge configuration. The temperature of the IRT was held constant while the black body was varied from 0 to 45ºC. The temperature of the sensor body was incorporated into the calibration equation to adjust for drift. A datalogger (model 21-X, Campbell Scientific, Logan, Utah) was used to record the temperature of the blackbody and ambient room temperature. Sensor body temperature measurements were made using input from an LM35 digital temperature IC mounted to the body of the IRT. Calibrations were performed by placing each sensor module into three controlled environments. Our methods were similar to Kalma et al. (1988) and Bugbee et al. (1999); calibration equation (Eq. 1) was
5
developed for the IRTs using methods that included the IRT sensor body temperature, Tb (ºC). The difference between the IRT sensor reading, Ts (ºC), and Tb was converted to thermoelectric voltage, Ed(mV) by 3
Ed =
∑ c (T − T ) i
s
b
i
i =0
(Eq.1)
where the ci values are the coefficients for type-T thermocouples for the sub range, 0.000˚C to 400.00˚C (NIST, ITS-90 Thermocouple Database, 1995). A linear relationship was found between Ed and the energy radiated by the target:
σ (Ts + 273.16) 4 = E d * m + b
(Eq. 2)
where Ts is the sensor reading (˚C), the Stefan-Boltzmann constant σ = 5.67E-8 W m-2 ˚K-4, m is the slope, and b is the intercept of the relation. IRT readings were taken at three sensor body temperatures (Tb = 44˚C, 23˚C, and 10˚C) and a range of target temperatures (0 to 45ºC). After the growing season, the black body operations and protocol were reviewed and as a result, the range and excitation values concerning the measurements across the RTD were changed to full-scale values and compared against the measured values made during the preseason calibration. The regression of the pre-season and post-season temperature readings resulted in the following equation:
T corrected = 1.0 * T pre −season + 0.74
Eq. (3)
TTT values were recalculated using this equation with Pivot IRT temperatures collected from the experiment.
6
Wireless Sensor Networks To test the reliability of data transmission and compare mesh-networking and non-mesh networking protocols, two separate wireless sensor networks were established, the Pivot and the Field wireless sensor networks (Field-WSN). Eight wireless IRT sensors were associated with the Field-WSN; sensors were mounted on adjustable masts above the crop canopy. The Pivot- WSN was comprised of nine wireless sensors [eight wireless IRTs mounted on masts off the pivot arm and one wireless GPS unit (GARMIN, model HVS-17, Ocean Isle Beach, N.C.) mounted on the end tower]. Both networks were established in point-to-point topologies using a unicast transparent mode of communication and non-mesh (Field-WSN) and mesh firmware (Pivot-WSN) (Table 2). Unicast describes the method by which the modem sends a digitized signal; definitions for non-mesh, mesh networking, unicast and broadcast modes of communication are listed in the Appendix. Table 2 summarizes the architecture of the wireless sensor networks. An embedded computer (an extended PC-104 platform), located at the center pivot point (Fig. 2) collected data (as described in Table 1) from each of the WSNs. This base station was linked serially to the Valmont CAMS panel of the center pivot. Each sensor network communicated with the base station through its own coordinator (RF modem) using RS-232 or USB connections. The base station and RF modems were located in weather-protected housings near the pivot point (Fig. 2). A wireless Ethernet connection was used for remote control and communication with the center pivot system. An equation similar to that of Andrade-Sanchez et al. (2007) was used to judge the performance of the Pivot and Field WSNs. We defined the success of transfer of data packets (bytes of information) in a terms of a percentage:
⎡ RR x PRR x = ⎢ ⎣ TR x
⎤ ⎥100 ⎦
Eq.(4)
7
where PRRx was the packet reception rate, RRx was the number of records received during the time interval x, and TRx was the total number of records transmitted during the interval time x. Each WSN transmitted data (Table 1) on its own specified channel to a specific coordinator (base modem). Table 2. Summary of wireless sensor networks. Wireless Sensor Location No. of Sensors Network 8 Field-WSN Stationary masts located in the field above crop canopy 9 Pivot-WSN Masts located on pivot arm, forward of drop hoses
Firmware non-mesh mesh-networking
Irrigations Irrigation for the manual plots commenced on DOY 206 and ended on DOY 241. Soil water content readings were taken at the beginning of each week with field calibrated neutron moisture meters from 12 access tubes (3 in each manual section) using methods described by Evett (2008) at 10-cm depth to 230-cm depth in 20-cm increments. Manual irrigations were forced on odd-numbered days of the year to replenish the average amount of soil water lost to evaportranspiration within the manually irrigated blocks. Automatically irrigated blocks were irrigated on even-numbered days of the year when triggered by the TTT method. The threshold level for was this experiment was established at at 452 minutes, the cumulative time during which the crop canopy temperature was > 28ºC.
8
Figure 2. Graphic depicting center pivot field with two wireless sensor networks: (1) PivotWSN containing eight wireless infrared thermometers and one wireless GPS unit, located off of the pivot lateral; and (2) Field-WSN containing eight wireless sensors positioned in the field. Air temperature, relative humidity, solar radiation, wind speed, and rainfall were measured at 6-s intervals and reported as 15-min mean values from a weather station located approximately 5 m southeast of the pivot point.
9
Results Network performance Overall, the Field-WSN (unicast, non-mesh network) was more reliable than the mesh networking system on the pivot lateral. The poorer performance of the Pivot-WSN was probably due to interference from the steel framework of the pivot arm and towers. The Field-WSN required 8 seconds to collect data reliably from all eight sensors. However, it is important to note that using a non-mesh networking protocol on the Pivot-WSN resulted in an even poorer level of reliability for data transmission, 90% for 93% of the time networking (8) (42 day trial period) Pivot-WSN Unicast, mesh > 90% for 70% of the time networking (9) (42 day trial period) Pivot-WSN (9)
Unicast, non-mesh networking
< 80% for 100% of the time (6 day trial period)
Energy Consumption 0.72 Ah (sleep mode enabled) 2.10 Ah (sleep mode not available) No assessment
The firmware installed on the RF modules for the Field-WSN met the IEEE 802.15.4 standard, which enabled “sleeping” and therefore reduced energy consumption (Table 3). However, this firmware did not allow for mesh networking. On the other hand, the Zigbee protocol was installed on the RF modules comprising the Pivot-WSN and did allow for mesh networking but did not enable us to “sleep” the RF modules. Energy consumption for the sensor devices located on the Pivot-WSN was 300% greater than that for the Field-WSN. The savings in power experienced by the Field- WSN was due to the ability to sleep the sensors between transmissions.
10
Temperatures Relationships Typical examples of daily temperature readings (using corrected data) from the wireless modules deployed in the field are shown in Fig. 3. During day of year (DOY) 235, sensor body temperature rose above canopy temperature around 0800 h, and followed air temperature throughout the day (Fig. 3a). The temperature differences between the target (Ts, crop canopy) and the sensor body (Tb) ranged in value from -5.21 to 3.15˚C. The crop was not stressed on this day, as evidenced by the canopy temperatures being < than air temperature. The spike in sensor body temperature at approximately 0800 h is most likely due to an error in a data byte collected by the embedded computer. On DOY 239, canopy temperature rose above air temperature at approximately 0900 h and began to decline below air temperature at approximately 1900 h (Fig. 3b). The temperature differences between the target (Ts, crop canopy) and the sensor body (Tb) ranged in value from -0.13 to 7.62˚C. Canopy temperatures that are higher than air temperature generally indicate that the crop was experiencing stress. Sensor body temperature exceeded air temperature until 2000 h. The thermal lag in the sensor body temperature was due to the thermal mass of the sensor module. The summer of 2007 was cooler than past seasons (Climate Data Records, 1998- 2002), and it is anticipated that sensor body temperatures could increase to the range of 40 to 50˚C during a warmer summer season. Therefore, the environmental temperature range for the laboratory sensor calibrations should extend to 55˚C to provide a more accurate correction for temperature drift in these higher ranges.
11
35
35
Temperature [˚C]
Temperature [˚C]
30 DOY 235 25 Sensor Body Temperature
20
Air Temperature
30 DOY 239
25 Sensor Body Temp
20 Canopy Temperature
15
15
Air Temperature
Canopy Temperature
10
10
0 0
4
8
12
16
20
24
4
8
12
16
20
24
Time (hrs)
Time (hrs)
(a)
(b)
Figure 3. Diurnal plots of the average sensor-body temperature, air temperature, and canopy temperature readings from the wireless modules deployed in the field as part of the Field-WSN: (a) DOY 235 and (b) DOY 239.
12
Irrigation Scheduling Automatic irrigations were scheduled only on DOY 220 and 232 based on the TTT method. After applying Eq. 3, it was predicted that four irrigation signals were missed (DOY 217, 223, 225, and 239) due to the lower reported temperatures resulting from the error in calibration methods (Table 4). If the center pivot had irrigated automatically on these four days, the difference in total depth of applied water between the manually and automatically irrigated sections would be equivalent to 4%. Table 4. Recorded and corrected time temperature threshold minutes (above 28ºC). DOY
Recorded TTT
Corrected TTT
DOY
Recorded TTT
Corrected TTT
209 211 213 215 217 * 219 221 223
208.6 9.0 342.9 1.8 428.5 524 207.3 336.2
208.6 64.3 387.9 7.4 527.2†† 529 204.6 465.1††
225 227 229 231 233 235 237 239
388.5 264.5 87.0 536.3 380.5 349.8 325 351.3
458.4†† 422.8 120.6 557.4 417.8 380.6 365.9 454.6††
††Predicted irrigations that were not triggered during the experiment * TTT minutes were calculated from the field IRTs, only 5 hours of pivot data was collected on this day
Conclusions Wireless network systems can be integrated onto a center pivot platform and in the irrigated field. The ability to deploy wireless sensor networks using the center pivot as a platform will help develop a system that provides the grower remote surveillance of a specific field. Although, non-mesh networking firmware performed better with the network established in the field, mesh networking firmware has the potential to make wireless network systems function reliably while mounted on the pivot arm. The correction in the calibration procedure should allow for timely triggering of automatic irrigations. Further testing during the next growing season will be necessary. Currently, modifications to this first generation of wireless sensor modules are being developed; the upgraded sensors are referred to as the second-generation (Gen-II)
13
series. Changes include converting 95% of the components to surface mount devices to reduce the power consumption of the circuit, switching to a faster microprocessor that has inherent storage capacity, increasing the resolution of the analog to digital converters (ADC) chips, and converting from sealed lead acid to nickel metal hydride batteries. Equally important, the manufacturer of the RF module is improving its performance through software revisions. These upgrades (by the manufacturer) include additional memory, automatic channel switching, internal antenna power control, and improved “sleep” capabilities (MaxStream, 2007) which will in turn increase scalability (number of nodes functioning on a single network) and reliability of wireless sensor networks. Testing of prototype Gen-II wireless sensor modules is on going. Table 5 summarizes the actual and expected improvements by category. Generation II sensors will be deployed on the pivot lateral and in the field this growing season. The accuracy of the sensor readings and the packet-transmission rate performance will be evaluated and compared to past performances.
14
Table 5. Summary of Generation I versus Generation II wireless sensor network systems Trait Gen-I Gen-II RF module XBeePro- 60mW power Xbee-1mW power draw draw during tx during tx Integrated circuits
Through hole, dip packages
Microprocessor
Basic Stamp
PIC16F883
Current consumption
Average current draw = 85 mA
Average current draw = 45 mA
Battery chemistry/size
SLA (6v, 2x7 in)
NiMH (4.8v, AA)
Cold junction chip
AD595
Communication mode
Transparent using AT commands, controlled by polling methods via base computer(Advantage- easy to set up and good control of data input; Disadvantage- slows data acquisition)
Maxim6674 – built in 10 bit ADC API mode using hex string codes, data transmission is not controlled by the base computer (Advantagereduces transmission latency, error checking is built into manufacturer’s software; Disadvantageadditional coding required to manage data.
Data Storage & Transmission frequency to Base RF
No storage, averaged data sent every minute
Storage of 1 minute averages, will transmit every 10 minutes
Data monitoring
IRT reading, sensor body, battery voltage
IRT reading, sensor body, battery voltage, board temperature, battery temperature
Recharge circuit
Voltage regulating
Voltage regulating with current control by the PIC
Firmware
802.15.4 and Zigbee Meshhandled a limited number of nodes
Zigbee Mesh – scalability improved by manufacturer
surface mount devices
15
Acknowledgements The authors which to acknowledge funding from the Ogallala Aquifer Program and the assistance provided by Chad Ford, Agricultural Science Technician; Brice Ruthardt, Biological Science Technician; and Todd Kidd, Biological Science Aide, for their assistance.
References Andrade-Sanchez, P., F. J. Pierce, and T. V. Elliott. 2007. Performance assessment of wireless sensor networks in agricultural settings. Paper No. 073076. St. Joseph, Mich.: ASABE. Bugbee, B., M. Droter, and B. Tanner. 1999. Evaluation and modifications of commercial intrared transducers for leaf temperature measurement. Adv. Space Res. 22 (10):1425-1434. Climate Data Records, 1998-2002, Conservation Production and Research Laboratory, Bushland, TX . Available at: http://www.cprl.ars.usda.gov/climatedatafiles.htm Evett, S.R. 2008. Neutron Moisture Meters. 2008. Chapter 3 (pp.39-54) In: S.R. Evett, L.K. Heng, P. Moutonnet and M. L. Nguyen (eds.) Field Estimation of Soil Water Content: A Practical Guide to Methods, Instrumentation, and Sensor Technology. IAEA-TCS-30. International Atomic Energy Agency, Vienna, Austria. ISSN 1018-5518. available at http://www.pub.iaea.org/mtch/publications/PubDetails.asp?publd=7801 Evett, S. R., T. A. Howell, A.D. Schneider, D.R. Upchurch, and D.F. Wanjura. 1996. Canopy temperature based automatic irrigation control. 207-213. In: C. R. Camp, E. J. Sadler, and R. E. Yoder (eds.) Proc. International Conference. Evapotranspiration and Irrigation Scheduling, San Antonio, Tex., ASABE, St. Joseph, Mich. Evett, S.R., Howell, T. A., Schneider, D. R. Upchurch, and D. F. Wanjura. 2000. Automatic drip irrigation of corn and soybean. pp. 401-408 In: Robert G. Evans, Brian L. Benham, and Todd P. Trooien (ed) Proceedings of the 4th Decennial National Irrigation Symposium, Nov. 14-16, 2000, Phoenix, Ariz., ASABE, St. Joseph, Mich. 16
Evett, S.R., R. T. Peters, and T. A. Howell. 2006. Controlling water use efficiency with irrigation automation: Cases from drip and center pivot irrigation of corn and soybean. In: Proc. 28th Annual Southern Conservation Systems Conference, Amarillo Tex., June 26-28, 2006. pp. 57-66. Kalma, J.D., Alksnis, H., and Laughlin, G.P. 1988. Calibrations of small infra-red surface temperature transducers. Agric. and Forest Meteor. 43:83-98. MaxStream. 2007. Wave Forum Conference. Salt Lake City, Utah. NIST. 1995. ITS-90 Thermocouple Database Online. National Institute of Standards and Technology. Available at: http://srdata.nist.gov/its90/type_t/0to300.html. O’Shaughnessy, S.A. and Evett, S.R. 2007. IRT Wireless Interface For Automatic Irrigation Scheduling Of A Center Pivot System. In: Proc. 28th Annual International Irrigation Association Show. San Diego, Calif. pp. 176-186, Irrig. Assoc., Reston, Va. Peters, R. T. and Evett, S.R. 2006a. Center-pivot automation: Using crop canopy temperature to eliminate irrigation guesswork. In: Resource: Engineering and Technology for a Sustainable World. 13(2):9-10. Peters, R.T. and Evett, S.R. 2006b. A fully automated center pivot using crop canopy temperature: Preliminary results. In: Proc. USCID Water Management Conf. Ground Water and Surface Water Under Stress: Competition, Interaction, Solutions. , 139-148. 25-28 October, Boise, Idaho. U.S. Committee on Irrigation and Drainage, Denver, Colo. pp. 139-148. Pierce, F.J., J.L. Chavez, T.V. Elliot, G.R. Matthews, R. Evans, and Y. Kim. 2006. A remotereal-time continuous move irrigation control and monitoring system. Paper No. 062162. St. Joseph, Mich.: ASABE. Wanjura, D.F. and Upchurch, D.R.. 2000. Canopy temperature characterizations of corn and cotton water status. Trans. ASAE 43(4): 867-875.
17
Zhang, Z. 2004. Investigation of wireless sensor networks for precision agriculture. Paper Number: 041154. 2004 ASAE/CSAE Annual International Meeting, Sponsored by American Society of Agricultural and Biological Engineers, August 1-4, 2004, Ottawa, Ontario, Canada.
18
Appendix Definitions dBi is a measurement that compares the gain of an antenna with respect to an isotropic radiator (a theoretical antenna that disperses incoming energy evenly over the surface of an imaginary sphere.) Mesh networking- refers to the ability of the network to establish a pathway for signal transmission using non-targeted sensors within the network as routers of the digitized signals to and from the base modem. Unicast and broadcast describe the method by which the modem disseminates a digitized signal; unicast refers to a single signal transmitted by the base modem that is directed at a single node sensor, albeit other sensors on the network may route the signal to the targeted sensor. Broadcast refers to the base modem transmitting the same signal to all sensors at the same time.
Data Integrity Exception handling code was built into the software program (Visual Studio 2005) utilized to collect and manage the data (Visual Basic 6.0). Missed data (due to transmission losses) was handled by substituting a dummy outlier value and then excluding that value when calculating averages so as not to skew canopy temperature results. Post-experiment, an algorithm was developed to interpolate the missed individual temperature readings from each infrared thermometer, Fig 4. Visual Basic code used to interpolate the “dropped” data points”
Do While Not EOF(InfldZeroFile) Input #InfldZeroFile, IDNUM, DOY, Year, StampedTime J=J+1 TimeStamp(J, 1) = StampedTime For s = 1 To Sensor Input #InfldZeroFile, IRTemp(J, s)
19
Next s Loop Close #InfldZeroFile Numlines = J 'Now check each IRT sensor (column wise) for zero values and interpolate with closest two values (above and below): For s = 1 To Sensor For i = 1 To Numlines c=i z=1 IRTLow(s) = 0# IRTHigh(s) = 0# If TimeStamp(i, 1) < 8# Or TimeStamp(i, 1) > 21# Then If IRTemp(i, s) = 0 Then IRTemp(i, s) = MinIRTemp(s) End If End If If IRTemp(i, s) = 0 Then 'check lower boundary values Do While (c - z) > 0 'Determine lower boundary If IRTemp(c - z, s) = 0 Then z=z+1 Else IRTLow(s) = IRTemp(c - z, s) TimeLow(s) = TimeStamp(c - z, 1) Exit Do End If Loop
20
If (c - z)