JOURNAL OF BACTERIOLOGY, June 2005, p. 4276–4285 0021-9193/05/$08.00⫹0 doi:10.1128/JB.187.12.4276–4285.2005 Copyright © 2005, American Society for Microbiology. All Rights Reserved.
Vol. 187, No. 12
Integrative Genomic, Transcriptional, and Proteomic Diversity in Natural Isolates of the Human Pathogen Burkholderia pseudomallei Keli Ou,1,4† Catherine Ong,2† Shze Yung Koh,3† Fiona Rodrigues,3 Siew Hoon Sim,2 Daniel Wong,3 Chia Huey Ooi,3 Kim Chong Ng,3 Hiroyuki Jikuya,1,4 Chin Chin Yau,1,4 Sou Yen Soon,1,4 Djohan Kesuma,1 May Ann Lee,2 and Patrick Tan1,3,5* Agenica Research,1 National Cancer Centre,3 and Genome Institute of Singapore,5 11 Hospital Drive, Singapore 169610, Republic of Singapore; Defence Medical and Environmental Research Institute, DSO National Laboratories (Kent Ridge), 27 Medical Drive, Singapore 117510, Republic of Singapore2; and Shimadzu (Asia Pacific), 16A Science Park Drive, Singapore Science Park 1, Singapore 118228, Republic of Singapore4 Received 11 December 2004/Accepted 1 March 2005
Natural isolates of pathogenic bacteria can exhibit a broad range of phenotypic traits. To investigate the molecular mechanisms contributing to such phenotypic variability, we compared the genomes, transcriptomes, and proteomes of two natural isolates of the gram-negative bacterium Burkholderia pseudomallei, the causative agent of the human disease melioidosis. Significant intrinsic genomic, transcriptional, and proteomic variations were observed between the two strains involving genes of diverse functions. We identified 16 strainspecific regions in the B. pseudomallei K96243 reference genome, and for eight regions their differential presence could be ascribed to either DNA acquisition or loss. A remarkable 43% of the transcriptional differences between the strains could be attributed to genes that were differentially present between K96243 and Bp15682, demonstrating the importance of lateral gene transfer or gene loss events in contributing to pathogen diversity at the gene expression level. Proteins expressed in a strain-specific manner were similarly correlated at the gene expression level, but up to 38% of the global proteomic variation between strains comprised proteins expressed in both strains but associated with strain-specific protein isoforms. Collectively, >65 hypothetical genes were transcriptionally or proteomically expressed, supporting their bona fide biological presence. Our results provide, for the first time, an integrated framework for classifying the repertoire of natural variations existing at distinct molecular levels for an important human pathogen. quencing, microarrays, and proteomic tools, it is now becoming possible to address such questions on a genomewide scale (15). The gram-negative pathogen Burkholderia pseudomallei is an environmental saprophyte endemic to southeast Asia and northern Australia and the causative agent of the human and animal disease melioidosis (7). Melioidosis is a serious, frequently fatal condition often characterized by severe pulmonary distress with frequent progression to septicemia and death (4, 5, 7). In areas where this bacterium is widespread, infections by B. pseudomallei have been estimated to be responsible for up to 20 to 30% of all mortalities due to septicemia (29). The bacterium is thus regarded as a major tropical pathogen (34) and has also been classified by the United States Centers for Disease Control as a category B biowarfare agent (25). No vaccine is currently available for B. pseudomallei, and its high mortality rate is due in part to the diverse clinical presentations of melioidosis patients (35), which can result in misdiagnosing the disease and initiating treatment with inappropriate antimicrobial regimens. There are numerous clinical observations suggesting that different strains of B. pseudomallei can exhibit considerable variability in phenotypic behavior. For example, exposure to the bacterium can result in highly distinct clinical outcomes, ranging from asymptomatic seroconversion and acute infection to a chronic latent stage where the bacterium lies dormant in the host only to be reawakened decades later (34). In addition,
Natural isolates of pathogenic bacteria can often exhibit a wide range of behavioral phenotypes, including striking differences in clinically important traits such as growth rate, host selectivity, and virulence (1, 8). Identifying the molecular mechanisms responsible for generating, regulating, and constraining the phenotypic diversity of pathogens is a critical area of study, as such knowledge has significant implications for many areas of infectious diseases research, including the acquisition of drug resistance, vaccine design, and the emergence of new diseases (16). Previous reports studying the molecular diversity of pathogens have largely been restricted to comparing isolates at single-cell levels, such as for variations in genomic DNA (10, 12), RNA (14), and surface polysaccharides (23, 32). Although these studies have been useful, deciphering the general processes regulating pathogen diversity in the natural environment will undoubtedly require defining how, and to what extent, molecular variations at distinct cellular levels (DNA, RNA, and protein) are integrated with one another to ultimately shape the pathogenic phenotype. With the increasing availability of technologies such as high-throughput se-
* Corresponding author. Mailing address: National Cancer Centre/ Genome Institute of Singapore, 11 Hospital Drive, Singapore 169610, Republic of Singapore. Phone: 65-6-436-8345. Fax: 65-6-226-5694. Email:
[email protected]. † These authors contributed equally to this report. 4276
VOL. 187, 2005
INTEGRATIVE GENOMICS OF B. PSEUDOMALLEI
4277
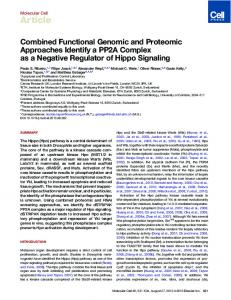
FIG. 1. Integrative genomic, transcriptional and proteomic comparisons of B. pseudomallei strains. A) Schematic of overall experiment. Multiple independent batches of B. pseudomallei strains K96243 and Bp15682 were grown in rich (LB) medium and subsequently harvested for simultaneous comparative genomic, expression profiling, and proteomic analysis. B) Growth curves of B. pseudomallei strains. Strains K96243 (brown) and Bp15682 (green) exhibit similar growth rates, with doubling times of 48 min (K96243) and 58 min (Bp15682), as assessed using viability counts. C) Virulence of B. pseudomallei strains using a C. elegans host system. The y axis represents the percentage of C. elegans surviving after incubation with the bacterial strain for different time periods (postinfection, x axis). The black line represents an Escherichia coli OP50 negative control, where no C. elegans killing is observed. Strain K96243 exhibits greater nematocidal activity than Bp15682 (P ⬍ 0.001, log-rank test).
distinct isolates of B. pseudomallei have also been shown to exhibit differences in antibiotic sensitivity and polysaccharide coat content (20, 23). The genome sequence of B. pseudomallei strain K96243 has recently been described (17), and consistent with its complex biology, the B. pseudomallei genome is comparatively large compared to that of other bacteria (7.2 Mb) and possesses more than 5,600 predicted genes, a number comparable to that of eukaryotic organisms such as Schizosaccharomyces pombe. An analysis of the B. pseudomallei K96243 genome revealed the presence of several “genomic islands” that appear to have been recently acquired, and it was proposed that the differential presence of these genomic islands in distinct B. pseudomallei strains may contribute to the phenotypic diversity of this bacterial species. In this report, we sought to gain insights into the molecular processes contributing to the phenotypic diversity of B. pseudomallei by performing an integrated genomic, transcriptional, and proteomic comparison of two unrelated B. pseudomallei isolates. To our knowledge, this effort represents the first time that such a multilevel analysis has been performed for a human pathogen. We observed significant intrinsic differences between the strains at all three molecular levels and found that alterations at one level (e.g., transcriptional) could frequently be related to corresponding changes at another (e.g., genomic). Two general findings were of particular interest. First, we found that a remarkably high proportion (43%) of the gene expression differences between the strains could be attributed to genes that were differentially present between the two isolates, demonstrating the importance of lateral gene transfer or gene loss events in contributing to pathogen diversity at the gene expression level. Another unanticipated finding was that more than one-third (38%) of the global proteomic differences between the strains were com-
posed of proteins expressed in both strains but associated with strain-specific protein isoforms. Our results, which are likely to be applicable to other microbes, provide a framework for classifying and integrating, at distinct cellular levels, the spectrum of naturally occurring molecular variations for an important human pathogen. MATERIALS AND METHODS Bacterial strains and phenotypic assays. B. pseudomallei strains K96243 and ATCC 15682 were provided by the Defence Medical and Environmental Research Institute and maintained on LB agar. Growth curves were generated by growing concentrated starter cultures in LB broth at 37°C for 24 h and analyzing increases in optical density and CFU with Microfit Ver. 1.0 software (www.ifr .bbsrc.ac.uk). The graphs in Fig. 1b represent the averages from three independent experiments. Caenorhabditis elegans killing assays were performed (13); four to six replicate plates were tested for each strain. One-sided log rank tests were used to compare the two strains. P values of ⬍0.05 were considered statistically significant. DNA microarrays. Details of the B. pseudomallei microarrays have been published (22) and are also described on our website (www.omniarray.com /Bpm_Different_Strains/Supplemental). Briefly, the arrays contain ⬎6,000 probes corresponding to predicted open reading frames (ORFs) in the B. pseudomallei K96243 reference genome. Probes, ranging from 300 to 1,000 bp in length, were PCR amplified from K96243 genomic data and spotted in duplicate onto coated glass slides (Full Moon BioSystems). After elimination of redundant sequences, the final microarray contains 5,457 nonoverlapping array probes covering the B. pseudomallei genome. A computer file and interactive genome browser mapping the array probes onto ORFs annotated by the Sanger Centre can be accessed at www.omniarray.com/pseudomallei. Array-based comparative genomic hybridization. Bacterial cultures were harvested for molecular analysis at the late stationary growth phase. Detailed experimental protocols are provided on our website. Genomic DNAs from the test (e.g., Bp15682) and reference (K96243) strains were fluorescently labeled by nick translation and cohybridized to the microarray. Reciprocal dye-swap hybridizations were performed for all strains. Fluorescent microarray images were acquired using a Genepix Scanner (Axon array-based comparative genomic hybridization) and analyzed using Genepix Pro software (v 4.0). Each array was internally normalized between the Cy3 and Cy5 channels, mean centered, and
4278
OU ET AL.
J. BACTERIOL.
FIG. 2. Comparative genomics of B. pseudomallei strains. (A and B) Array-based comparative genomic hybridization. Results for B. pseudomallei strains K96243 and Bp15682. Array probes are arranged on the x axis according to their chromosomal positions for chromosomes 1 and 2 (A and B, top). The y axis represents the fluorescence array-based comparative genomic hybridization ratios, with negative ratios representing decreased hybridization in strain Bp15682. Chromosomal areas exhibiting contiguous regions of decreased hybridization are referred to as regions of difference (RDs). (A and B, bottom) Two RDs are depicted close up, corresponding to RD3 (A) and RD15 (B). Each column represents the hybridization ratio of a single array probe. RD3 is approximately 50 kb in length, while RD15 is 40 kb. (C) Status of RD1 in other B. pseudomallei strains. The array-based comparative genomic hybridization ratios of the eight array probes corresponding to RD1 (8.7 kb) in 17 other B. pseudomallei strains are depicted. Each column represents the hybridization ratio of a single array probe. Differently colored columns represent different strains. The order of strains is similar to that in D from strains 21/96X (left) to 78/96 (right). Strains K96243 and Bp15682 are not depicted. (D) Status of RDs 1 to 16 in 19 B. pseudomallei strains. For each strain, the status of each RD is summarized as a colored square, with black indicating present and white indicating absent. Grey squares indicate that the RD for that strain exhibits a partial deletion.
fluorescence values associated with replicate probes were averaged. After performing a series of self versus self (K96243 versus K96243) hybridizations (C.O., data not shown), we defined an empirical cutoff threshold of ⫺0.3 for an array probe being called significantly different from K96243. Notably, ⬎90% of the 270 array probes mapping to regions of difference (RDs) 1 to 16, which are the focus of this report, display a more extreme fluorescent value of ⬍⫺0.8. Expression profiling. Total RNA was extracted from bacterial cultures using Trizol reagent (Invitrogen Life Technologies), followed by mRNA enrichment using the MEGAclear and MICROBExpress kits (Ambion). Fluorescently labeled cDNAs were prepared from 1.5 g of mRNA using an indirect aminoallyldUTP labeling procedure (Ambion). Reciprocal dye-swap hybridizations were performed for all paired cultures. Fluorescence data were averaged and normalized as above. Genes exhibiting strain-specific patterns of mRNA abundance were identified by comparing Bp15682 and K96243 microarrays (six independent batches) against their reciprocal hybridizations using significance analysis of microarrays (SAM) at an n-fold-change cutoff of 3.0 and a ⌬ of 1.5 (30). Since SAM measures the relative n-fold difference between arrays and their reciprocals, this corresponds to an absolute n-fold change of 1.5 between Bp15682 and K96243. Visualization of microarray data was performed using Expressionist (Genedata) or TREEVIEW software (Stanford University).
Proteomic profiling. Detailed experimental protocols are provided on our website S3. Proteins from bacterial cultures were separated for two-dimensional electrophoresis using a pH range of 3 to 10. Silver-stained gels were analyzed using PDQuest 7.1 (Bio-Rad). Four independent replicate gels were analyzed for each batch culture. To identify proteins, silver-stained protein spots were excised, digested, and subjected to peptide mass fingerprinting using an Axima CFR Plus matrix-assisted laser desorption ionization-time of flight (MALDI-TOF)-mass spectrometer (Shimadzu/Kratos, Manchester, United Kingdom). Each mass spectrum was an average of 20 profiles. Spectra were submitted to a B. pseudomallei database containing all predicted ORF sequences using MASCOT software (Matrix Science). To compare the gene expression levels of the detected protein population against all genes (see Fig. 4B), we utilized the normalized intensities of each channel corresponding to the batch 6 microarrays. The expression units in Fig. 4B correspond to the log-transformed absolute hybridization intensity measurements of the array probes in either the Cy3 channel (pink, all genes; red, detected proteins) or Cy5 channel (blue, all genes; green, detected proteins), after background subtraction and intra-array channel normalization. We emphasize that when single genes are analyzed, two-channel arrays can be reliably used only to measure ratios. Within each channel, however, the overall spread of the log-
INTEGRATIVE GENOMICS OF B. PSEUDOMALLEI
VOL. 187, 2005
4279
FIG. 3. Expression profiling of B. pseudomallei strains. (A) Comparing intrinsic and environmental differences in gene expression. In interstrain A and B panels (left and middle panels), expression ratios of K96243 versus Bp15862 (K9vBp) arrays (y axis) were plotted against Bp15682 versus Bp15682 (BpvBp) arrays (x axis). For the K9vBp arrays, the strains being compared were grown in the same environmental batch (interstrain A, batch 2; interstrain B, batch 6). For the BpvBp arrays, the strains being compared were grown in different environmental batches (batch 3 and batch 4). In the intrastrain A panel (right panel), expression ratios of one BpvBp array were compared to another BpvBp array, where the strains being compared were grown in different environmental batches (x axis, batches 1 and 2; y axis, batches 3 and 4). Blue, red, and green lines and crosses represent genes whose ratios of expression are greater than 2-, 5-, and 10-fold, respectively. The distribution of expression ratios in the intrastrain comparison reflects the inherent variability in gene expression due to subtle differences in environmental batches. More genes are observed to exhibit significant differences in mRNA abundance in the interstrain arrays than in the intrastrain arrays. (B) Identification of genes exhibiting intrinsic differences in mRNA abundance between strains. Each horizontal row in the clustergram represents a single microarray profile, totaling six BpvK9 arrays and six K9vBp arrays (reciprocal hybridizations), where the strains used in each array were isolated from the same environmental batch. Each vertical column represents a single unique gene in the B. pseudomallei genome, and a total of 139 genes (columns) are shown. Genes were selected according to their consistency of mRNA abundance differences between the strains (see the text), with red indicating higher and green indicating comparatively lower expression. The scale bar indicates the extent of differences in mRNA abundance. Examples of specific genes are indicated below the clustergram. (C) Integration of transcriptional and genomic information. The 139 genes exhibiting strain-specific patterns of mRNA abundance (the clustergram in B) are plotted with their mRNA expression ratios on the x axis and their array-based comparative genomic hybridization values on the y axis. For both axes, the data are depicted as a Bp15682 versus K96243 comparison (Bp15682 being the numerator) on a log-transformed scale. Points are color-coded as follows: pink, increased mRNA abundance in Bp15682; blue, increased mRNA abundance in K96243; red, increased mRNA abundance in K96243 and also belonging to a genomic RD.
transformed hybridization intensities for all array probes follows a normal distribution (see our website). This property makes it feasible to compare the mean intensity of a selected subset of array probes (i.e., those corresponding to the detected proteins) to the mean intensity of the global population to detect global biases in gene expression abundance. Correlations between transcriptional and proteomic data were performed using either one-tailed z-tests (Fig. 4B) or t tests (Fig. 4D), with P values of ⬍0.05 being deemed significant.
RESULTS Phenotypic analysis of B. pseudomallei isolates. We selected two B. pseudomallei strains for comparison, K96243, a clinical
isolate from Thailand whose genome has been sequenced (17), and ATCC 15682 (Bp15682), a type strain isolated from a monkey. The two strains were selected as they exhibit several phenotypic similarities and differences. For example, both strains display highly similar growth rates in rich LB medium, with average doubling times of 49 min for K96243 and 58 min for Bp15682 (log growth) (Fig. 1B). However, K96243 exhibits greater virulence than Bp15682 towards C. elegans, using a previously described B. pseudomallei/C. elegans infection assay (13) (Fig. 1C) (P ⬍ 0.001, log rank test). Both strains also
4280
OU ET AL.
J. BACTERIOL.
FIG. 4. Proteomic profiling of B. pseudomallei strains. A) Experimental reproducibility of B. pseudomallei proteomes. The Bp15682 proteome (batch 6) was compared to the proteome of the K96243 strain from the same environmental batch and to another Bp15682 proteome from a different environmental batch (batch 5). Comparisons were performed by two-dimensional gel spot-to-spot matching, using the Bp15682 (batch 6) gel as a reference. 95% (304/320) of the Bp15682 reference spots could be matched to a similar spot on the Bp15682 (batch 5) gels, while only 79% (254/320) of the Bp15682 reference spots could be matched to the K96243 (batch 6) gels. B) Transcriptional expression levels of all genes compared to genes corresponding to detected proteins. The expression units in the x axis correspond to the log-transformed absolute hybridization intensity measurements of the array probes after background subtraction and intra-array channel normalization (see Materials and Methods). Two populations are depicted: all genes and genes corresponding to detected proteins (black arrows). The y axis depicts the percentage of genes in a population exhibiting an expression level equal to or less than a particular value (x axis). For example, 50% of all genes exhibit an expression value of 7 or less (dotted lines), while in the detected protein population this fraction is approximately 30%. The P value depicts the statistical difference in the two populations using a z test score. For each population, two lines are shown, representing the Cy3 and Cy5 fluorescent dyes (pink and blue, all genes; red and green, detected proteins). C) Two classes of proteomic differences between B. pseudomallei strains. Shown are close-up images of two-dimensional gels containing Bp15682 (left) and K96243 (right) proteins. The green circle represents a protein (BPSS0890) that, under the limits of the two-dimensional electrophoresis/MS platform, is expressed in Bp15682 but not K96243 (see the text). The red circle represents a protein (BPSS2346) which is expressed in both strains but associated with different electrophoretic mobility patterns, implying the presence of strain-specific posttranscriptional or posttranslational modifications. D) Transcriptional expression ratios of genes corresponding to strain-specific proteins. Two populations are depicted: genes corresponding to Bp15682-specific proteins (green) and to K96243-specific proteins (brown). The y axis depicts the percentage of genes exhibiting an expression level equal to or less than a particular expression ratio (Bp15682/ K96243, x axis). BPSS1529 was not included in this analysis due to its extreme fluorescence ratio (⬎3) and was considered an outlier. Higher expression ratios indicate that a gene is more abundantly expressed in Bp15682 than in K96243. Genes corresponding to Bp15682-specific proteins are more likely to exhibit increased expression in Bp15682 than genes corresponding to K96243-specific proteins. The P value indicates the statistical difference between the two populations, as measured by a one-tailed t test (equal variance).
exhibit differential virulence in mouse infection assays (C.O., data not shown). These findings confirm the existence of substantial phenotypic differences between these two isolates, which forms the basis of the subsequent molecular comparisons reported in the following sections. Comparative genomics of B. pseudomallei isolates. Previous reports have found that that several pathogenic bacteria appear to express virulence traits during the stationary phase of growth. For example, expression of virulence factors in Legionella pneumophila has been correlated with entry into stationary phase (2), and in B. pseudomallei the Pml/BpsIR quorum-
sensing system has been shown to regulate virulence and genes during this portion of the growth phase as well (27, 31). Under carefully controlled laboratory conditions, we grew both B. pseudomallei strains as a series of paired cultures in rich liquid medium. For each pair of cultures (K96243 and Bp15682), aliquots were harvested at late stationary phase and subdivided for subsequent comparative genomic, expression profiling, and proteomic profiling (Fig. 1A). In total, we grew six independent batches of paired cultures, where each batch was grown on a separate day. First, we compared the genomes of K96243 and Bp15682 by
VOL. 187, 2005
array-based comparative genomic hybridization (aCGH) using whole-genome B. pseudomallei DNA microarrays constructed using the K96243 reference genome (22). These arrays contain approximately 5,400 nonredundant probes covering the entire B. pseudomallei genome, with an average spacing of 1 array probe/1 kb (see Materials and Methods). Genomic DNAs from the two strains were differentially labeled with fluorescent dyes and cohybridized to the microarray. In this assay, array probes exhibiting comparable levels of fluorescence for both strains represent genetic loci that are present and conserved in both K96243 and Bp15682. Conversely, probes exhibiting a decreased fluorescence value in Bp15682 compared to K96243 would correspond to genomic loci present in K96243 but which are either absent or exhibit a substantially divergent nucleotide sequence in Bp15682. The B. pseudomallei genome comprises two circular chromosomes of lengths 4 Mb and 3.1 Mb. We found that almost three-quarters (270/368, or 73%) of the array probes displaying an array-based comparative genomic hybridization ratio of less than ⫺0.3, and hence considered different between K96243 and Bp15682 (see Materials and Methods), could be clustered into a series of distinct genomic regions (Fig. 2A and B). In keeping with previous nomenclature, we refer to these regions as regions of difference (RDs) (11). Because most of the RDs typically involve multiple adjacent array probes and exceed 10 to 15 kb in length, it is likely that these RDs represent genomic regions that are physically absent in Bp15682 compared to K96243, rather than regions of divergent nucleotide sequence. In favor of this hypothesis, many of the RDs contain open reading frames (ORFs) encoding proteins related to bacteriophages, DNA integrases, and transposons (see our website), suggesting that they may have been recently acquired. For example, RD3, corresponding to genomic island 2 (17), comprises 35 array probes covering a 50-kb region on chromosome 1 and contains several genes with homology to genes found in the CTX family of bacteriophages (21). These results indicate that distinct B. pseudomallei strains are genetically heterogeneous and are consistent with a recent report proposing that bacteriophages are major contributors to the genomic diversity of this species (6). A total of sixteen distinct RDs were identified between K96243 and Bp15682. Of these 16 RDs, 13 could be matched to the genomic islands previously identified by the B. pseudomallei genome sequencing effort (17; see our website). We conducted a series of PCR validation experiments to confirm the absence of these RDs in Bp15682 (see our website). The absence of these regions in Bp15682 could be due to loss of these sequences by Bp15682 or acquisition of these sequences by K96243. To distinguish between these possibilities, we profiled a further 17 natural isolates of B. pseudomallei, obtained from a variety of clinical, animal, and environmental sources (Fig. 2C and D). Of the 16 RDs, seven (RDs 4, 5, 6, 7, 9, 11, and 12) were present in K96243 but not in the other strains; it is thus likely that K96243 specifically acquired these RD sequences. Supporting this model, ORFs in these seven RDs exhibited a %GC content distribution that was significantly lower (55 to 60%) than the global %GC content distribution derived from all ORFs (65 to 70%) in the genome (see our website). In contrast, one RD (RD13, on chromosome 2) was absent in
INTEGRATIVE GENOMICS OF B. PSEUDOMALLEI
4281
Bp15682 but present in all the other strains, suggesting that Bp15682 probably lost this sequence. RD13 does not contain obvious phage-related elements but instead several metabolic genes involved in fatty acid and polyketide biosynthesis (BPSS029 to BPSS0320). The remaining eight RDs exhibited a more complex pattern; RDs 1, 2, 3 and 8 are present in a subset of strains but not others, while RDs 10, 14, 15, and 16 appear to be only partially absent in the other strains. Further work will have to be performed to investigate the origin of these eight RDs. Nevertheless, for 50% (8/16) of the RDs, we were able to ascribe a likely reason (DNA acquisition or loss) for the differential presence of these sequences between K96243 and Bp15682. Taken collectively, these comparative genomic studies confirm and complement findings from the B. pseudomallei genome analysis that many of the RDs/genomic islands are indeed differentially present across distinct B. pseudomallei strains. Furthermore, the microarray analysis also revealed additional genomic regions (e.g., RD13) that are differentially present in natural isolates of B. pseudomallei, which may also contribute to the phenotypic diversity of this microbial species. Global differences in RNA expression between B. pseudomallei isolates. To characterize the intrinsic differences in the transcriptomes of K96243 and Bp15682, we isolated mRNA from the six independent batches and generated expression profiles of these strains using the same microarrays. Between the two strains, we consistently observed dramatic differences in mRNA abundance for several genes, in some cases exceeding 10-fold (Fig. 3A, left and middle panels). The differences in mRNA abundance between the strains are unlikely to be due to environmental variability, since such differences were not observed when we compared the expression profiles of the same strain grown across different batches (Fig. 3A, right panel). We then used the analytical technique SAM (30) to identify genes exhibiting consistent differences in mRNA abundance between K96243 and Bp15682, and identified a total of 127 genes whose mRNA abundance was apparently greater in either one strain or the other (Fig. 3C). Assuming a total gene complement of approximately 5,700 genes, this finding suggests that at least 2% of the B. pseudomallei transcriptome can potentially vary between different strains. We emphasize, however, that this figure is almost certainly a lower limit, as not all the predicted ORFs in the B. pseudomallei genome may be transcriptionally expressed under these conditions. Genes exhibiting strain-specific differences in mRNA abundance were associated with a wide variety of cellular functions, including cellular invasion (BPSS1529, similar to Shigella flexneri ipaD, and BPSS1531, similar to Bordetella bronchiseptica bopD), transcription (transcriptional regulators BPSL2068 and BPSL2313), and polysaccharide synthesis (BPSL2794-wcbM/ gmhD) (see our website). In several cases, genes exhibiting strain-specific mRNA abundance patterns could be localized to specific chromosomal gene clusters, including several members of a gene cluster related to flagellar assembly and function (BPSL0226, 231-233) (see our website), and a separate cluster of genes related to cellular invasion (see above) which lies adjacent to a previously identified type III secretion locus (28). The set of 127 differential genes also contained more than 30 members that were
4282
OU ET AL.
previously annotated as novel or hypothetical proteins. Our microarray data provide experimental evidence that these genes are associated with detectible mRNA transcripts and strain-specific patterns of mRNA abundance, indicating that they are likely to be expressed in vivo. Differential gene presence can act as a major contributor to natural variations in gene expression between B. pseudomallei isolates. We considered possible molecular mechanisms that might contribute towards generating these strain-specific patterns of gene expression. Generally, strain-specific patterns of gene expression might be due to the activity of trans-acting factors, such as transcriptional regulators and factors regulating mRNA stability, and/or cis-acting factors, ranging from nucleotide polymorphisms in gene promoter sequences to overt differences in gene copy number and the absence/presence of genes. This last possibility is of particular relevance to microbes, due to their flexible genomic content. Although studies investigating the contributions of cis- and trans-acting factors to natural variations in gene expression have been reported for eukaryotes ranging from yeasts to humans (3, 26), similar studies have yet to be performed for prokaryotes. Thus, to assess if in B. pseudomallei either gene copy number or gene absence/presence was a significant contributor to intrinsic variations in mRNA abundance, we integrated the mRNA expression and array-based comparative genomic hybridization data to reflect the mRNA abundance of a particular gene as a function of its genomic status (Fig. 3C). Remarkably, of 78 genes exhibiting increased mRNA abundance in strain K96243, 54 genes (69%) could be localized to a previously defined RD, indicating that the apparent enrichment in mRNA abundance of these genes in K96243 is simply due to these genes being absent in Bp15682. There was no obvious difference in the copy numbers of genes exhibiting increased mRNA abundance in Bp15682 compared to K96243 (P.T., unpublished observations). In total, of 127 genes exhibiting strain-specific mRNA abundance, a total of 43% (54/127) could be attributed to variations in gene absence/presence. These results suggest that differences in gene copy number can play a substantial role in shaping the intrinsic transcriptome profile of distinct bacterial isolates in the natural environment, supporting the importance of either horizontal gene transfer or gene loss events in shaping the gene expression phenotype of natural bacterial isolates. Global differences in the proteomes of B. pseudomallei isolates. We then used two-dimensional electrophoresis/mass spectrometry (MS) technology to compare the proteomes of K96243 and Bp15682. To obtain a general sense of the overall differences between the strain proteomes, we first compared the K96243 and Bp15682 protein populations isolated from the same batch of paired cultures (batch 6). Of 320 protein spots observed in the Bp15682 (batch 6) proteome, 254 (or 79%) could be matched to a counterpart of similar molecular weight and isoelectric point in the K96243 (batch 6) proteome. This result suggests that a remarkable 20% of the proteome, as detected by the two-dimensional electrophoresis platform, may be different between K96243 and Bp15682 (Fig. 4A). The proteomic differences between the two strains are unlikely to be caused by environmental or technical variability, as 304 (or 95%) of the 320 protein spots could be matched between two Bp15862 proteomes from different batches (batch 5 versus
J. BACTERIOL.
batch 6). This finding establishes the existence of substantial intrinsic differences in global protein patterns between different strains of B. pseudomallei. It is well known that the two-dimensional electrophoresisgel technology, similar to other protein detection technologies, including liquid chromatography (LC)/MS/MS, is biased towards the detection of abundantly expressed proteins. To explore the relationship between protein abundance and mRNA levels in B. pseudomallei, we then used MALDI-TOF mass spectroscopy to determine the identities of 274 protein spots that were expressed in both common and strain-specific patterns (see our website). Specifically, we included all identifiable strain-specific protein spots that could be resolved by the twodimensional electrophoresis platform (88 spots) and a subset of commonly expressed protein spots (corresponding to 129 spot pairs). We identified a total of 130 distinct proteins by MS and compared the distribution of mRNA abundances in this protein population (the 130 detected proteins) to the distribution of mRNA abundances corresponding to all genes (Fig. 4B; see Materials and Methods). We found that genes in the detected protein population were associated with a statistically significant bias towards greater mRNA abundance (P ⬍ 0.0001, z test) than occurs in the global gene population. For example, while 50% of all genes exhibit a log-transformed expression value of 7 or less, this fraction in the detected protein population is approximately 30%. Thus, in B. pseudomallei, there appears to be a strong positive correlation between the levels of mRNA and protein abundance when assessed on a global scale. The proteins we detected using this approach were associated with a wide variety of cellular functions, including core transcription and translation (BPSL3187-RPOA, BPSL3228, and 3215TUFA1/A2), protein folding (BPSL2697 to GROEL), energy metabolism (BPSL2887 to PNTAA), and cellular invasion (BPSS1545-INVG) (see our website). Similar to the transcriptional data, several expressed proteins could be localized to genomic clusters, such as BPSL3396, -3398, and -3399, which encode the beta, alpha, and delta subunits of ATP synthetase, and BPSL1535, -1536, -1537, and -1540, containing the genes PHBA and PHBB. Notably, of the 133 detected proteins, more than 20 proteins had been previously annotated as conserved hypothetical proteins by the B. pseudomallei genome annotation project; our results establish that bona fide protein entities do indeed exist for these genes. Strain-specific protein isoforms comprise a major component of proteomic variability between B. pseudomallei isolates. The exact location of a protein spot on a two-dimensional electrophoresis gel is dependent upon multiple protein-specific factors, such as isoelectric charge, protein length/molecular weight, and other protein-related modifications (e.g., phosphorylation). As such, the differential presence of a protein spot between the two strains could be due to either the general presence or absence of the protein in one strain compared to the other (differential expression) or differentially migrating strain-specific protein isoforms, possibly resulting from differences in processes such as post translational modifications or translational termination. We found that of the 53 proteins exhibiting strain-specific behavior, 43 proteins (or 81%) were apparently expressed in one strain and not the other, while the remaining 10 proteins
INTEGRATIVE GENOMICS OF B. PSEUDOMALLEI
VOL. 187, 2005
(19%) were expressed in both strains but were associated with isoforms of different electrophoretic mobilities (Fig. 4C). We note that the former finding of 43 differentially expressed proteins should be interpreted in the context of the two-dimensional electrophoresis/MS platform’s inherent limitations; it is possible that an absent protein could still be expressed but at a level below the detection limit of the two-dimensional electrophoresis system or as a differentially migrating protein isoform that was not resolved under the protein separation conditions employed in these experiments. For the 10 proteins expressed in both strains, we found that differentially migrating isoforms of these proteins accounted for 34 of the 88 strain-specific spots, or 38% of the overall proteomic variability between isolates. We further confirmed that these strain-specific isoforms are highly distinct and reproducible across independent growth batches, suggesting that they are likely to be present in vivo (see our website). One striking example is the protein BPSL3041 or PaaZ, a putative phenylacetic acid degradation oxidoreductase, which is present as 14 and 5 protein spots in K96243 and Bp15682, respectively; however these protein spots are nonoverlapping between the two strains (see our website). These results suggest that up to 38% of the naturally occurring intrinsic proteomic variability between the different isolates of B. pseudomallei may be strain-specific protein isoforms, possibly generated through strain-specific mechanisms of posttranscriptional or posttranslational modification (see Discussion). Finally, we also compared the mRNA abundance levels of genes corresponding to the 43 proteins that were apparently expressed in a strain-specific pattern. As seen in Fig. 4D, proteins that were expressed in an apparently K96243-specific manner had an mRNA abundance distribution that was weakly but significantly biased towards K96243, while proteins that were expressed in an apparently Bp15682-specific manner had a reciprocal bias towards Bp15682 (P ⫽ 0.03, one-tailed t test). Thus, there appears to be a subtle but significant positive correlation between mRNA abundance and protein expression in B. pseudomallei. We thus speculate that posttranscriptional regulation of mRNA messages may play a relatively minor role in determining the ultimate level of protein expression in B. pseudomallei. Further research will be required to assess if this is indeed the case. DISCUSSION We have in this report undertaken a systematic characterization of the genomic, transcriptional and proteomic variability inherent to two distinct isolates of the gram negative human pathogen B. pseudomallei. Our primary motivation in this study was to use B. pseudomallei as a model system to define, at all three cellular levels, the general extent and character of molecular differences existing across bacterial isolates in the natural environment. By integrating information from distinct cellular levels, we were able to demarcate the general extent to which specific types of variations at one cellular level might affect components at other levels. Previous reports, primarily on eukaryotic organisms, have attempted to relate genomic and transcriptional information (3, 18) or transcriptional to proteomic information (19, 33), but to our knowledge, our
4283
work represents one of the first times where all three levels, genomic, transcriptional, and proteomic, have been analyzed simultaneously, particularly to compare natural isolates of a recognized human pathogen. It is likely that our results will be of interest to other infectious disease researchers, since many features of B. pseudomallei, such as its genomic plasticity, exposure to diverse environments, and ready adaptability, are also commonly observed in other microbial pathogens as well. The information generated in this study raises a number of specific hypotheses with respect to the molecular basis of phenotypic differences between the isolates. For example, strain K96243 displays increased virulence to C. elegans compared to Bp15682 (Fig. 1C) and also exhibits comparatively greater expression levels of genes related to polysaccharide synthesis (BPSL1122 and BPSL2794) and exported or membrane-associated proteins (BPSL0584 and BPSL2038), raising the possibility that these processes might contribute to nematode pathogenicity. In contrast, Bp15682 is less nematocidal than K96243 despite expressing increased levels of genes related to cellular invasion (BPSS1524, BPSS1526), suggesting that perhaps cellular invasion pathways may be less relevant for virulence in this particular animal model. It will be important to pursue these observations using more targeted experimental strategies. In addition to providing a better understanding into the specifics of B. pseudomallei behavior, we also made two general findings with potential relevance to the general question of pathogen diversity. The first finding was the large extent to which strain-specific genes contributed to the overall gene expression differences between microbial isolates. It is well accepted that a major proportion of the genomic diversity in natural microbial isolates can be attributed to the lateral transfer of foreign sequences. What is less clear, however, is the extent to which genes on these acquired sequences ultimately contribute to the overall differences in mRNA and protein expression between isolates, particularly when one considers other potential sources of genomic diversity such as chromosomal rearrangements and fine-scale nucleotide alterations. Our results indicate that differentially present sequences, represented by RDs or genomic islands, although occupying approximately 6% of the B. pseudomallei genome, can nevertheless account for close to half (43%) of the intrinsic differences in gene expression between isolates. Our results are consistent with the possibility that lateral gene transfer or gene loss events may represent the major genetic basis of natural variation in microbial gene expression and that background transcription from the common and stable chromosomal cores may vary rather minimally between different strains of B. pseudomallei. Obviously, more work, with larger numbers of isolates, will be required to assess the validity of this hypothesis. The second general finding was the surprisingly large extent to which strain-specific protein isoforms contributed to the overall proteomic variability of the isolates (⬎1/3, or 38%). We found that these strain-specific isoforms were reproducibly observed across multiple independent growth batches, suggesting that they are indeed present in vivo (see our website). In these experiments, we attempted to minimize protein degradation by preparing the protein lysates in the constant presence of protease inhibitors and storing the samples at ⫺80 degrees prior to two-dimensional electrophoresis analyses. Nevertheless, we
4284
OU ET AL.
J. BACTERIOL.
acknowledge a formal possibility that some of the different isoforms identified by this approach might not reflect the true in vivo state, but instead result from degradation induced by the protein preparation process. For example, it is possible that amino acid changes resulting from strain-specific genetic polymorphisms might generate proteins with different susceptibilities to in vitro degradation. In preliminary experiments, we note that strain-specific polymorphisms in these genes do indeed exist (D. Wong, data not shown). Regarding the types of modifications that might give rise to these isoforms, our preliminary data suggest that at least some of the protein isoforms can be attributed to differential protein truncation at the N terminus (see our website), but it is also possible that other processes, such as differential translational termination, may also play a role in the establishment of these isoforms. This result bears testament to the remarkable and often underappreciated biological complexity of microorganisms, which can be revealed using appropriate experimental tools. It is worth noting that this discovery, using two-dimensional electrophoresis technology, might have been missed using newer shotgun proteomic technologies such as LC/MS/MS, as in the latter, whole protein characteristics such as isoelectric point and molecular weight are typically not preserved. The consequences of such proteomic variability, which may involve diverse posttranscriptional or posttranslational processes ranging from protein truncation, phosphorylation, and glycosylation, in contributing to the differences in isolate phenotype will constitute another important area of future research. One particular area of interest would be with regard to their effects on antigenic variation and the ability of the pathogen to evade the host immune system. In conclusion, recent events such as the severe acute respiratory syndrome coronavirus outbreak (9) have served to remind the worldwide scientific community that emerging infections unfortunately remain a major global health challenge, with great potential to cause significant morbidity and mortality. In the specific case of melioidosis, there is a growing recognition that beyond its well-accepted endemic presence in southeast Asia and northern Australia, the global health burden due to B. pseudomallei infections may actually be much higher but underrecognized (34). Furthermore, a recent cluster of melioidosis cases in Brazil may indicate that this disease may be spreading (24). Understanding how this complex microbe interacts with the environment and potential hosts to diversify and cause disease will pose a significant research challenge for microbiologists and infectious disease specialists for some time to come. ACKNOWLEDGMENTS We thank Julian Parkhill and Matthew Holden from the Sanger Centre for providing us early access to the B. pseudomallei K96243 genome annotation data. This work was supported by research grants to P.T. from Defence Medical and Environmental Research Institute, NCC, Agenica Research, and Shimadzu. REFERENCES 1. Alm, R. A., L. S. Ling, D. T. Moir, B. L. King, E. D. Brown, P. C. Doig, D. R. Smith, B. Noonan, B. C. Guild, B. L. deJonge, G. Carmel, P. J. Tummino, A. Caruso, M. Uria-Nickelsen, D. M. Mills, C. Ives, R. Gibson, D. Merberg, S. D. Mills, Q. Jiang, D. E. Taylor, G. F. Vovis, and T. J. Trust. 1999. Genomic-sequence comparison of two unrelated isolates of the human gastric pathogen Helicobacter pylori. Nature 397:176–180.
2. Bachman, M. A., and Swanson, M. S. 2001. RpoS co-operates with other factors to induce Legionella pneumophila virulence in the stationary phase. Mol. Microbiol. 40:1201–1214. 3. Brem, R. B., G. Yvert, R. Clinton, and L. Kruglyak. 2002. Genetic dissection of transcriptional regulation in budding yeast. Science 296:752–755. 4. Dance, D. A. 1991. Melioidosis: the tip of the iceberg? Acta Trop. 74:115– 119. 5. Dance, D. A. 2000. Ecology of Burkholderia pseudomallei and the interactions between environmental Burkholderia spp. and human-animal hosts. Acta Trop. 74:159–168. 6. DeShazer, D. 2004. Genomic diversity of Burkholderia pseudomallei clinical isolates: subtractive hybridization reveals a Burkholderia mallei-specific prophage in B. pseudomallei 1026b J. Bacteriol. 186:3938–3950. 7. Dharakul, T., and S. Songsivilai. 1999. The many facets of melioidosis. Trends Microbiol. 7:138–140. 8. Doumith, M., C. Cazalet, N. Simoes, L. Frangeul, C. Jacquet, F. Kunst, P. Martin, P. Cossart, P. Glaser, and C. Buchrieser. 2004. New aspects regarding evolution and virulence of Listeria monocytogenes revealed by comparative genomics and DNA arrays. Infect. Immun. 72:1072–1083. 9. Drosten, C., S. Gunther, W. Preiser, S. van der Werf, H. R. Brodt, S. Becker, H. Rabenau, M. Panning, L. Kolesnikova, R. A. Fouchier, A. Berger, A. M. Burguiere, J. Cinatl, M. Eickmann, N. Escriou, K. Grywna, S. Kramme, J. C. Manuguerra, S. Muller, V. Rickerts, M. Sturmer, S. Vieth, H. D. Klenk, A. D. Osterhaus, H. Schmitz, and H. W. Doerr. 2003. Identification of a novel coronavirus in patients with severe acute respiratory syndrome. N. Engl. J. Med. 348:1967–1976. 10. Dziejman, M., E. Balon, D. Boyd, C. M. Fraser, J. F. Heidelberg, and J. J. Mekalanos. 2002. Comparative genomic analysis of Vibrio cholerae: genes that correlate with cholera endemic and pandemic disease. Proc. Natl. Acad. Sci. USA 99:1556–1561. 11. Fitzgerald, J. R., D. E. Sturdevant, S. M. Mackie, S. R. Gill, and J. M. Musser. 2001. Evolutionary genomics of Staphylococcus aureus: insights into the origin of methicillin-resistant strains and the toxic shock syndrome epidemic. Proc. Natl. Acad. Sci. USA 98:8821–8826. 12. Fukiya, S., H. Mizoguchi, T. Tobe, and H. Mori. 2004. Extensive genomic diversity in pathogenic Escherichia coli and Shigella strains revealed by comparative genomic hybridization microarray. J. Bacteriol. 186:3911–3921. 13. Gan, Y. H., K. L. Chua, H. H. Chua, B. Liu, C. S. Hii, H. L. Chong, and P. Tan. 2002. Characterization of Burkholderia pseudomallei infection and identification of novel virulence factors using a Caenorhabditis elegans host system. Mol. Microbiol. 44:1185–1197. 14. Gaynor, E. C., S. Cawthraw, G. Manning, J. K. MacKichan, S. Falkow, and D. G. Newell. 2004. The genome-sequenced variant of Campylobacter jejuni NCTC 11168 and the original clonal clinical isolate differ markedly in colonization, gene expression, and virulence-associated phenotypes. J. Bacteriol. 186:503–517. 15. Ge, H., A. J. M. Walhout, and M. Vidal. 2004. Integrating omic information: a bridge between genomics and systems biology. Trends Genet. 19:551–560. 16. Grenfell, B. T., O. G. Pybus, J. R. Gog, J. L. Wood, J. M. Daly, J. A. Mumford, and E. C. Holmes. 2004. Unifying the epidemiological and evolutionary dynamics of pathogens. Science 303:327–332. 17. Holden, M. T., R. W. Titball, S. J. Peacock, A. M. Cerdeno-Tarraga, T. Atkins, L. C. Crossman, T. Pitt, C. Churcher, K. Mungall, S. D. Bentley, M. Sebaihia, N. R. Thomson, N. Bason, I. R. Beacham, K. Brooks, K. A. Brown, N. F. Brown, G. L. Challis, I. Cherevach, T. Chillingworth, A. Cronin, B. Crossett, P. Davis, D. DeShazer, T. Feltwell, A. Fraser, Z. Hance, H. Hauser, S. Holroyd, K. Jagels, K. E. Keith, M. Maddison, S. Moule, C. Price, M. A. Quail, E. Rabbinowitsch, K. Rutherford, M. Sanders, M. Simmonds, S. Songsivilai, K. Stevens, S. Tumapa, M. Vesaratchavest, S. Whitehead, C. Yeats, B. G. Barrell, P. C. Oyston, and J. Parkhill. 2004. Genomic plasticity of the causative agent of melioidosis, Burkholderia pseudomallei. Proc. Natl. Acad. Sci. USA 101:14240–14245. 18. Hughes, T. R., C. J. Roberts, H. Dai, A. R. Jones, M. R. Meyer, D. Slade, J. Burchard, S. Dow, T. R. Ward, M. J. Kidd, S. H. Friend, and M. J. Marton. 2000. Widespread aneuploidy revealed by DNA microarray expression profiling. Nat. Genet. 25:333–337. 19. Ideker, T., V. Thorsson, J. A. Ranish, R. Christman, J. Buhler, J. K. Eng, R. Bumgarner, D. R. Goodlett, R. Aebersold, and L. Hood. 2001. Integrated genomic and proteomic analyses of a systematically perturbed metabolic network. Science 292:929–934. 20. Jenney, A. W., G. Lum, D. A. Fisher, and B. J. Currie. 2001. Antibiotic susceptibility of Burkholderia pseudomallei from tropical northern Australia and implications for therapy of melioidosis. Int. J. Antimicrob. Agents 17: 109–113. 21. Nakayama, K., S. Kanaya, M. Ohnishi, T. Terawaki, and T. Hayashi. 1999. The complete nucleotide sequence of phi CTX, a cytotoxin-converting phage of Pseudomonas aeruginosa: implications for phage evolution and horizontal gene transfer via bacteriophages. Mol. Microbiol. 31:399–419. 22. Ong, C., C. H. Ooi, D. L. Wang, H. L. Chong, K. C. Ng, F. Rodrigues, M. A. Lee, and P. Tan. 2004. Patterns of large-scale genomic variation in virulent and avirulent Burkholderia species. Genome Res. 14:2295–2307. 23. Perry, M. B., L. L. MacLean, T. Schollaardt, L. E. Bryan, and M. Ho. 1995.
VOL. 187, 2005
24. 25.
26.
27.
28.
29.
Structural characterization of the lipopolysaccharide O antigens of Burkholderia pseudomallei. Infect. Immun. 63:3348–3352. Rolim, D. 2004. First melioidosis outbreak in Brazil. Fourth World Melioidosis Congress, oral presentation. Rotz, L. D., A. S. Khan, S. R. Lillibridge, S. M. Ostroff, and J. M. Hughes. 2002. Public health assessment of potential biological terrorism agents. Emerg. Infect. Dis. 8:225–230. Schadt, E. E., S. A. Monks, T. A. Drake, A. J. Lusis, N. Che, V. Colinayo, T. G. Ruff, S. B. Milligan, J. R. Lamb, G. Cavet, P. S. Linsley, M. Mao, R. B. Stoughton, and S. H. Friend. 2003. Genetics of gene expression surveyed in maize, mouse and man. Nature 422:297–302. Song, Y., C. Xie, Y. M. Ong, Y. H. Gan, and K. L. Chia. 2005. The BpsIR quorum-sensing system of Burkholderia pseudomallei. J. Bacteriol. 187:785– 790. Stevens, M. P., M. W. Wood, L. A. Taylor, P. Monaghan, P. Hawes, P. W. Jones, T. S. Wallis, and E. E. Galyov. 2002. An Inv/Mxi-Spa-like type III protein secretion system in Burkholderia pseudomallei modulates intracellular behaviour of the pathogen. Mol. Microbiol. 46:649–659. Suputtamongkol, Y., A. J. Hall, D. A. B. Dance, W. Chaowagul, and M. D.
INTEGRATIVE GENOMICS OF B. PSEUDOMALLEI
30. 31.
32. 33.
34. 35.
4285
Wajchanuvong. 1994. The epidemiology of melioidosis in Ubon Ratchatani, Northeast Thailand. Int. J. Epidemiol. 23:1082–1090. Tusher, V. G., R. Tibshirani, and G. Chu. 2001. Significance analysis of microarrays applied to the ionizing radiation response. Proc. Natl. Acad. Sci. USA 98:5116–5121. Valade, E., F. M. Thibault, Y. P. Gauthier, M. Palencia, M. Y. Popoff, and D. R. Vidal. 2004. The PmlI-PmlR quorum sensing system in Burkholderia pseudomallei plays a key role in virulence and modulates production of the MprA protease. J. Bacteriol. 186:2288–2294. Wang, G., Z. Ge, D. A. Rasko, and D. E. Taylor. 2000. Lewis antigens in Helicobacter pylori: biosynthesis and phase variation. Mol. Microbiol. 36: 1187–1196. Washburn, M. P., A. Koller, G. Oshiro, R. R. Ulaszek, D. Plouffe, C. Deciu, E. Winzeler, and J. R. Yates III. 2003. Protein pathway and complex clustering of correlated mRNA and protein expression analyses in Saccharomyces cerevisiae. Proc. Natl. Acad. Sci. USA 100:3107–3112. White, N. J. 2003. Melioidosis. Lancet 361:1715–1722. Yee, K. C., M. K. Lee, C. T. Chua, and S. D. Puthucheary. 1988. Melioidosis, the great mimicker: a report of 10 cases from Malaysia. J. Trop. Med. Hyg. 91:249–254.