Atmos. Chem. Phys., 9, 2635–2645, 2009 www.atmos-chem-phys.net/9/2635/2009/ © Author(s) 2009. This work is distributed under the Creative Commons Attribution 3.0 License.
Atmospheric Chemistry and Physics
Intercomparison of ammonia measurement techniques at an intensively managed grassland site (Oensingen, Switzerland) M. Norman1,* , C. Spirig2 , V. Wolff3 , I. Trebs3 , C. Flechard2,** , A. Wisthaler1 , R. Schnitzhofer1 , A. Hansel1 , and A. Neftel2 1 Institute
for Ion Physics and Applied Physics, University of Innsbruck, Innsbruck, Austria Reckenholz T¨anikon Research Station (ART), Z¨urich, Switzerland 3 Max Planck Institute for Chemistry, Biogeochemistry Department, Mainz, Germany * now at: Environment and Health Administration, Stockholm City, Sweden ** now at: Institut National de la Recherche Agronomique (INRA), Rennes, France 2 Agroscope
Received: 2 September 2008 – Published in Atmos. Chem. Phys. Discuss.: 19 November 2008 Revised: 2 April 2009 – Accepted: 2 April 2009 – Published: 16 April 2009
Abstract. As part of a field campaign in the framework of the NitroEurope project, three different instruments for atmospheric ammonia (NH3 ) measurements were operated sideby-side on a managed grassland site in Switzerland: a modified Proton Transfer Reaction Mass Spectrometer (PTRMS), a GRadient of AErosol and Gases Online Registrator (GRAEGOR), and an Automated Ammonia Analyzer (AiRRmonia). The modified PTR-MS approach is based on + chemical ionization of NH3 using O+ 2 instead of H3 O as ionizing agent, GRAEGOR and AiRRmonia measure NH+ 4 in liquids after absorption of gaseous NH3 in a rotating wetannular denuder and through a gas permeable membrane, respectively. Bivariate regression slopes using uncorrected data from all three instruments ranged from 0.78 to 0.97 while measuring ambient NH3 levels between 2 and 25 ppbv during a 5 days intercomparison period. Correlation coefficients r 2 were in the range of 0.79 to 0.94 for hourly average mixing ratios. Observed discrepancies could be partly attributed to temperature effects on the GRAEGOR calibration. Bivariate regression slopes using corrected data were >0.92 with offsets ranging from 0.22 to 0.58 ppbv. The intercomparison demonstrated the potential of PTR-MS to resolve short-time NH3 fluctuations which could not be measured by the two other slow-response instruments. During conditions favoring condensation in inlet lines, the PTR-MS underestimated NH3 mixing ratios, underlining the importance of careful inlet designs as an essential component for any inlet-based instrument. Correspondence to: M. Norman (
[email protected])
1
Introduction
As the most dominant gas phase base in the atmosphere ammonia (NH3 ) plays a key role for the neutralization of acidic gases and aerosol particles (Asman et al., 1998). The uptake of NH3 on aerosol particles influences the aerosol chemical composition (Wells et al., 1998) and controls the acidity and nitrification of precipitation (Charlson and Rodhe, 1982; Dentener and Crutzen, 1994). NH3 is emitted in large quantities both from natural and anthropogenic sources (Bouwman et al., 1997). The natural sources include emission from soils, oceans, vegetation and living organisms. NH3 is known to be both emitted from and deposited to vegetation and it has positive effects on plants at low concentration, while it is harmful at higher concentrations (Fangmeier et al., 1994). However, large uncertainties still exist about the concentrations, surface-atmosphere exchange fluxes and cycling of atmospheric NH3 . One major uncertainty is the uptake and/or emission rate from plants and soils. Much of this uncertainty is due to the relative scarcity of direct flux measurements, which in turn mainly has been due to the lack of reliable measurement techniques that can be operated automatically and with high time-resolution in the field. One major difficulty for the development of measuring techniques for atmospheric NH3 is the simultaneous presence of NHx in the gaseous, the particulate (e.g., ammonium nitrate) and the liquid phase (NH+ 4 (aq) in clouds and fog). The partitioning between these phases strongly depends on environmental factors, such as temperature and relative humidity (Mozurkewich, 1993). Another difficulty is the interaction of NH3 with the surface of many materials as well as its high water-solubility, thus making measurements
Published by Copernicus Publications on behalf of the European Geosciences Union.
2636
M. Norman et al.: Intercomparison of ammonia instruments at a grassland site
with any kind of inlet a challenge (Parrish and Fehsenfeld, 2000; Yokelson et al., 2003). These problems have caused the progress in the development of NH3 measurement techniques to be slower than for many other atmospheric compounds. The denuder technique is nowadays the most widely applied sampling technique for NH3 (Ferm, 1979). However, major limitations of the denuder technique are a relatively low time-resolution (minutes to hours) and the need for subsequent wet-chemical analysis, which may introduce errors due to sample storage and/or contamination problems when applied for in-situ measurements. Until the last decade most automatic atmospheric NH3 measurements with sufficiently low detection limits were based on wet chemistry, like for example the AMANDA technique (Ammonia Measurement by Annular Denuder sampling with on-line Analysis; Wyers et al., 1993; Erisman et al., 2001), and the DS-FIA (diffusion scrubber flow injection analyzer; Genfa et al., 1989; Dasgupta 1993). More recent developments of fast response techniques with low detection limits include for example Differential Optical Absorption Spectroscopy (DOAS, Gall et al., 1991), Photoacoustic Spectroscopy (Pushkarsky et al., 2002), Tuneable Diode Laser Absorption Spectroscopy (TDLAS, Warland et al., 2001) and Chemical Ionization Mass Spectrometry (CIMS, Nowak et al., 2007). Several attempts have been made to compare different NH3 measurement techniques. An intercomparison by Wiebe et al. (1990) tested four measurements techniques for NH3 by filter packs, transition-flow reactors, simple and annular denuders and Fourier-Transform Infrared-Spectroscopy. Williams et al. (1992) compared five different NH3 measurement techniques including a photofragmentation/laser-induced fluorescence instrument (PF/LIF), a molybdenum oxide annular denuder sampling/chemiluminescence detection technique (MOADS), a tungsten oxide denuder sampling/chemiluminescence detection system (DARE), a citric acid coated denuder sampling/ion chromatographic analysis method (CAD/IC) and an oxalic acid coated filter pack sampling/colorimetric analysis method (FP/COL). A detailed study for determining the suitability of measuring techniques for air quality monitoring in the Netherlands is presented by Mennen et al. (1996). The study included seven methods, a wet-annular rotating denuder (WRD or WAD), a WO3 -coated thermodenuder, a V2 O5 -coated thermodenuder, a DOAS system, a photoacoustic monitor and a chemiluminescence NOx monitor with NH3 converter. A field intercomparison was performed by Milford et al. (2000) during the ACE-2 experiment in Tenerife and included the AMANDA and the DS-FIA. The informal intercomparison reported by Fehsenfeld et al. (2002) compared a first version of the CIMS for NH3 measurements with conventional methods like the citric acid denuder and the Molybdenum oxide (MoOx ) converter difference method. CIMS techniques for NH3 measurements were further tested by Nowak et al. (2006) who compared two different CIMS instruments, the NOAA Chemical SciAtmos. Chem. Phys., 9, 2635–2645, 2009
ence Division (NOAA-CSD) apparatus and the Georgia Tech (GT) low pressure tube flow reactor, in the field. An ambitious laboratory test of six different techniques is presented in the study by Schwab et al. (2007). The study included the TDLAS, the wet-scrubbing long-path absorption photometer (LOPAP), the wet effusive diffusion denuder (WEDD), the ion mobility spectrometer (IMS), the Nitrolux laser acoustooptical absorption analyzer as well as a modified chemiluminescence analyzer. A recent study compared the performance of a quantum cascade laser spectrometer (QCLAS), a TDLAS and an AMANDA system both for concentration and flux measurements of ammonia (Whitehead et al., 2008). The intercomparison presented here was performed within the framework of NitroEurope (NEU, www.nitroeurope.eu). One of the main NEU objectives is to establish robust datasets of land/atmosphere exchange fluxes of nitrogen and to study their impact on greenhouse gas budgets for representative European ecosystems. In line with this objective, NH3 was measured over an intensively managed grassland site at Oensingen, Switzerland, during July and August 2006. One of the main goals was to determine the drivers of surfaceatmosphere exchange fluxes of NH3 in grassland in relation to meteorological conditions and management practices, including fertilization and cutting. Three different instruments were compared for measurements of atmospheric NH3 : (a) an Automated Ammonia Analyzer AiRRmoniaTM instrument (Mechatronics BV, Hoorn, The Netherlands) (Erisman et al., 2001), (b) the GRadient of AErosol and Gases Online Registrator (GRAEGOR) (Thomas et al., 2009) and (c) a modified proton transfer reaction mass spectrometer (PTRMS) (Norman et al., 2007). As far as we know, this is the first study to include these three systems. It describes results from the intercomparison, potential sources of error and the suitability of the different methods for in-situ measurements with a high temporal resolution. 2 2.1
Experimental Site description
The field site was established in 2001 and is situated near the village of Oensingen in central Switzerland (47◦ 170 N, 07◦ 440 E) at about 450 m a.s.l. The site consists of two 50 x 150 m plots of grassland. One plot undergoes extensive management with no fertilizer application and 2–3 cuts per year and the second one is intensively managed with four fertilizer applications (150–200 kg N ha−1 y−1 as ammonium nitrate and slurry) and 4–5 cuts per year (Ammann et al., 2004). The surrounding area is characterised by intensive agriculture, dominated by grasslands and arable crops. The prevailing climate at the site is temperate continental, with an average annual rainfall of about 1100 mm and a mean annual air temperature of 9◦ C.
www.atmos-chem-phys.net/9/2635/2009/
M. Norman et al.: Intercomparison of ammonia instruments at a grassland site The measurement site has been used for studies of carbon and greenhouse gas budgets within the EU-funded GREENGRASS and CarboEurope-IP programmes (Ammann et al., 2004; Flechard et al., 2005) and in ozone studies (J¨aggi et al., 2006) as well as in nitrogen studies (Ammann et al., 2007; Neftel et al., 2007). A trailer was placed on the border between the intensively managed plot and the extensive managed plot. The measurements in this paper were performed above the intensively managed plot. The PTR-MS instrument was placed inside the trailer. A 17 m long inlet tube extended out onto the field and was placed on a tripod. Both the AiRRmonia analyzer and the GRAEGOR were placed in the centre of the field. The maximum distance between the AiRRmonia instrument, the GRAEGOR and the tripod with the PTR-MS inlet was 5 m. Furthermore, the prevailing wind directions parallel to the field orientation (Ammann et al., 2007) favoured minimal footprint differences for the three instruments. The measurements presented in this paper were performed between the afternoon of 26th and midday on 31st of July 2006. This was the only period of the 2006 summer campaign when all three instruments were operated simultaneously. The latest fertilisation of the field prior to the measurement phase occurred on 13th of July by application of liquid cattle slurry. 2.2 2.2.1
2637
Table 1. Characteristics of the NH3 instruments compared in this study. Institute AiRRmonia GRAEGOR PTR-MS
ART, Z¨urich, Switzerland MPIC, Mainz, Germany University of Innsbruck, Austria
Detection limit (2σ )
Sampling time
120 pptv 94 pptv 90–270 pptv(1)
15 min 30 min 1 min(2)
(1) The background and hence the detection limit for the PTR-MS varies with absolute humidity, see text. (2) The sampling time for
the PTR-MS is variable (seconds to minutes), but in this paper we only present 1-min sampling time data. Table 2. Description of the different inlets for the NH3 instruments in this study.
Type Length Inner diameter, cm Flow, SLPM Air speed, m s−1 Reynolds number Surface to volume ratio, m−1 Residence time, s
AiRRmonia
GRAEGOR
PTR-MS
PE 5 cm 0.17 1 7.3 860 2350 0.007
PFA 30 cm 0.8 16.7 5.5 3880 500 0.054
PFA 17 m 0.95 15 3.5 2470 420 4.8
Measurements techniques AiRRmonia
The AiRRmonia analyzer was designed for long-term monitoring of gas-phase atmospheric NH3 and it is a further development of the AMANDA technique (Wyers et al., 1993; Erisman et al., 2001). The AiRRmonia has been employed in national NH3 monitoring networks e.g., in the Netherlands and in Denmark. Air is sampled via a 5 cm long PE (Polyethylene) tubing with di =0.17 cm (inner diameter) at a flow of 1 SLPM (Table 2). In the sample block (SB), absorption of NH3 from the air flow takes place via a gas-permeable PTFE (polytetrafluoroethylene) membrane into an acid buffer (or “stripping”) solution, with a scrubbing efficiency of close to 100%. Ammonium-containing aerosols are not retained by the sampling membrane. This was verified by laboratory experiments where less than 1% and 3% of (NH4 )2 SO4 and NH4 NO3 particles, respectively, were captured (Otjes et al., 1999). The pH of the stripping solution is subsequently raised by addition of sodium hydroxide, which triggers the release and transfer of the captured NH3 through a second PTFE membrane in the detector block (DB), into a stream of pure deionized water in counter-flow on the other side of the membrane. The NH3 transfer efficiency of the AMFIA detector block is 90%. The NH+ 4 concentration in the solution is determined by a conductivity measurement, and calibration is made using aqueous NH+ 4 standard solutions (cf. Slanina et al., 2001). As with similar instruments based www.atmos-chem-phys.net/9/2635/2009/
on quantitative sampling of gaseous compounds into liquids and subsequent analysis in the liquid phase, the establishment of constant and precise liquid flows for all solutions is critical. The AiRRmonia applies syringe pumps for this purpose; their performance was verified by equipping the instrument with a liquid flow meter (Liquiflow L1, Bronkhorst NL) and continuously monitoring the total liquid flow. The response time of the analyzer is of the order of 10– 15 min and depends on the liquid flow rate, and thus on syringe pump speed. Detection limit and accuracy of the AiRRmonia have previously been determined as 0.1 µg/m3 and 3%, respectively (Erismann et al., 2001). For an estimate representative of the measurement period presented here, we used the 2σ (twice the observed standard deviation) from conductivity measurements in the field without air flow in sampling block as an estimate for the detection limit and twice the observed standard deviation from calibrations in the field as an estimate for the accuracy. The resulting values were 0.08 µg/m3 or 120 pptv for detection limit and 10% accuracy at NH3 mixing ratios of 5 ppbv, c.f. Table 1. The detector block was placed 1.25 m above the grass field. The AiRRmonia was operated by personnel from Agroscope Reckenholz-T¨anikon Research Station (ART) in Z¨urich, Switzerland.
Atmos. Chem. Phys., 9, 2635–2645, 2009
2638 2.2.2
M. Norman et al.: Intercomparison of ammonia instruments at a grassland site GRAEGOR
The recently developed GRadient of AErosol and Gases Online Registrator (GRAEGOR) measures mixing ratios of water-soluble gases, such as NH3 , HNO2 , HNO3 , HCl, − SO2 and their related aerosol compounds NH+ 4 , NO3 , Cl− , SO2− 4 (Thomas et al., 2009). The instrument consists of two sampling units, an analytical part, and a vacuum pump (Becker VT 4.16). The sampled air is drawn through two PFA (perflouroalkoxy) Teflon tubing connections (di =0.8 cm, l=30 cm, Table 2) to two sampling units that can be placed at two different heights to measure gradients. Water-soluble gases and aerosol species are collected simultaneously by two horizontally aligned rotating wet-annular denuders (WAD or WRD) and two Steam-Jet Aerosol Collectors (SJAC), respectively (Slanina et al., 2001; Trebs et al., 2004). A critical orifice provides controlled sample airflows of approx. 16.7 l min−1 (293.15 K and 1013.25 hPa) through each of the WRD/SJAC sampling lines. The airflow was regularly checked with a Gilibrator Air Flow Calibration System. To minimize wall losses of sticky gases such as HNO3 (Neuman et al., 1999), no preimpactor or cyclone was connected in front of the inlet. In contrast to previous studies that have employed similar instrumentation (e.g., Trebs et al., 2004), one major improvement of the GRAEGOR is the application of syringe pumps for the precise transport of liquids which is crucial for accurate analyses (cf. section above). The sample flow through the system is constant at 0.333 ml min−1 and is controlled with a Bronkhorst liquid flow meter. The sample solutions are analyzed on-line using ion chromatography (IC) for anions (results are not included in this study). Ammonium (NH+ 4 ) is analyzed using the same method as applied in the AiRRmonia (ammonium flow injection analysis, AMFIA). However, the AMFIA detector in GRAEGOR only has a NH3 transfer efficiency of 30% (Slanina et al., 2001). The detector was calibrated in the same way as that of the AiRRmonia using standard solutions of NH+ 4. The accuracy is 12% as determined by Gaussian error propagation, including uncertainties of the sampled air volume, the liquid flow and conductivity detection. The detection limit for NH3 was estimated from field blanks (2σ -definition) to 94 pptv (Table 1). The air samples that the GRAEGOR analyzes represent an average of the second half of each hour. This is the fastest sampling time achievable when GRAEGOR is operated as gradient monitor since two gas samples and two aerosol samples need to be analyzed subsequently and each analytical cycle takes 15 min. The response time of GRAEGOR, i.e. the time it takes for the signal to drop to 1/e of the starting value (ambient NH3 mixing ratio) after switching off the air pump, was shown to be 58±2 min (cf. Thomas et al., 2009). For gradient measurements, the lower measurement height was 0.37 m and the upper measurement height was 1.23 m. In this paper we only present data from the upper level measurements. The GRAEGOR was operAtmos. Chem. Phys., 9, 2635–2645, 2009
ated by personnel from Max Planck Institute for Chemistry (MPIC) in Mainz, Germany. 2.2.3
PTR-MS
Proton Transfer Reaction Mass Spectrometry (PTR-MS) is a state-of-the-art chemical ionization mass spectrometry (CIMS) technique for highly sensitive on-line measurements of volatile organic compounds (VOC) as described in Hansel et al. (1995) and Lindinger et al. (1998). A new technique for fast measurements of gas phase NH3 using the PTRMS instrument has recently been presented by Norman et al. (2007). Oxygen (O2 ) is used as a source gas to produce + O+ 2 as chemical ionization (CI) reagent instead of H3 O . + The O2 ions react with the NH3 molecules via the electron + transfer reaction O+ 2 +NH3 →NH3 +O2 which occurs at col+ lision rate. Primary (O+ 2 ) and product ions (NH3 ) are separated by a quadrupole mass spectrometer and detected using an electron multiplier SEM pulse counting system. The correct terminology of the instrument would be ETR-MS (Electron Transfer Reaction Mass Spectrometer), since it uses electron transfer instead of proton transfer as in the conventional PTR-MS. However the instrument itself is not changed and we will through the paper use the well-established terminology PTR-MS when referring to the instrument. A detailed description of the instrument settings, sensitivity and selectivity can be found in Norman et al. (2007). During laboratory tests the detection limit (2σ ) was found to be 90 pptv for a 1 s signal integration time at dry conditions, increasing to 270 pptv for humid conditions (Table 1). The instrumental time response, defined by 1/e2 decay in the calibration signal was around 30 s. The instrument used for these measurements was a conventional PTR-MS instrument built at the University of Innsbruck. The PTR-MS inlet consisted of a 17 m long di =0.95 cm PFA tubing with a flow of 15 SLPM (Table 2). The inlet was not heated, but covered with aluminum foil to minimize effects from direct solar radiation on the tube. The inlet was mounted 1.25 m above the grass field on a tripod in close vicinity to the other two instruments on the intensively managed plot. The sample inlet to the PTRMS drift tube consisted of a 15 cm silica coated stainless steel tube (Sulfinert®, Restek Corp., Bellefonte, PA, USA) which was pressure and temperature controlled. The passivated stainless steel tube sampled air from the centre of the main inlet tubing. The air flow into the PTR-MS instrument was ∼30 sccm. The sampling time for the PTR-MS instrument used in this study varied between 0.5 s to 30 s, but we only present 1 min averages (Table 1). The PTR-MS instrument was calibrated using a permeation device manufactured by Real Sensors Inc. (Hayward, California, USA). Given the high uncertainty in the specified permeation rate, the permeation rate was re-calibrated using denuders coated with 5% citric acid solution as in Sutton et al. (2001). The estimated accuracy using this calibration approach is ±10%. The permeation tube was kept www.atmos-chem-phys.net/9/2635/2009/
30
75
20
50
10
25
Temperature Relative humidity
0
0
Rain (mm/h)
40
8
Rain Wind speed
30
6
20
4
10
2
0 26-jul 12:00
27-jul 00:00
27-jul 12:00
28-jul 00:00
28-jul 12:00
29-jul 00:00
29-jul 12:00
30-jul 00:00
30-jul 12:00
31-jul 00:00
2639
30
0 31-jul 12:00
GRAEGOR AiRRMonia
25
PTR-MS
20
NH3, ppbv
100 Relative humidity (%)
40
Wind speed (m/s)
Temperature (C)
M. Norman et al.: Intercomparison of ammonia instruments at a grassland site
15
10
5
0 26-jul 12:00
27-jul 00:00
27-jul 12:00
28-jul 00:00
28-jul 12:00
29-jul 00:00
29-jul 12:00
30-jul 00:00
30-jul 12:00
31-jul 00:00
31-jul 12:00
Date
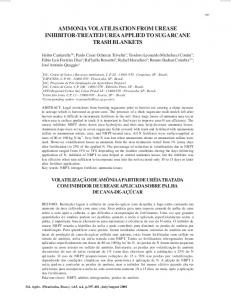
Fig. 1. Observed meteorological parameters for the 5-day intercomparison period.
in a temperature controlled oven at 30◦ C and was continuously flushed with NH3 free air. NH3 free air was generated using a platinum and palladium (Pt/Pd) catalyst operated at 350◦ C (Parker-Balston, Haverhill, MA, USA). NH3 free air was also generated using oxalic acid coated filters. Using one or two stage dilution with NH3 free air from the Pt/Pd catalyst and/or the oxalic acid NH3 scrubber, the instrument was calibrated in the field for mixing ratios between 8 and 150 ppbv. Details about the calibration system can be found in Norman et al. (2007). The PTR-MS was operated by personnel from the Institute for Ion and Applied Physics at the University of Innsbruck, Austria. 3 3.1
Results Time series analysis
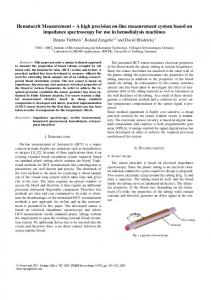
The field site was equipped with a meteorological station providing half-hour averages of air temperature, relative humidity, precipitation, wind speed and wind direction. The meteorological conditions during the measurement period are presented in Fig. 1. The period was dominated by relatively high daytime temperatures between 20◦ and 30◦ C. There was a heavy thunderstorm on the 27th July with almost 40 mm/h rain and heavy winds and a sharp drop in temperature. A longer rain period occurred in the morning of the 29th with mostly light rain. The relative humidity was close to 100% during nighttime and mostly dropped to below 50% during daytime. Figure 2 shows the time-series of measured NH3 mixing ratios during the intercomparison period for all three instruments. The thunderstorm in the evening of 27th July caused a power failure and the measurements started again in the morning of 28th July. The time series analysis shows an overall good agreement between the three different instruments. The time course of NH3 shows large variations, with mixing ratios around 10–15 ppbv on 26th July and in the morning of 27th July. NH3 levels dropped in the morning of 27th July and continued falling until the power failwww.atmos-chem-phys.net/9/2635/2009/
Ammonia concentrations measured 1.25 m above the intensively treated grass
field. The data are presented in 1 min, 30min and 1 hour time resolution for the Fig. 2. NH3 mixing ratios measured 1.25 m above the intensively PTR-MS, AiRRmonia and GRAEGOR respectively. managed grass field. The data are presented in 1 min, 30 min and 1 h sampling time for the PTR-MS, AiRRmonia and GRAEGOR, respectively. PTR-MS data within the circles are discussed separately.
ure in the evening. The mixing ratios were lower following the heavy thunderstorm rainfall. The PTR-MS data showed a sudden drop in mixing ratio during the rainfall as well as during the start up in the morning after (data within the circles in Fig. 2). As discussed later in the paper, this drop was most likely caused by water condensation in the main inlet line. On 28th July highly variable mixing ratios were observed with a sharp drop in the late evening before the onset of rainfall. The period from 29th to 31st July was characterized by a sharp NH3 peak every morning around 09:00 a.m. Similar increases during morning hours have been observed over grassland sites elsewhere, e.g., by Trebs et al. (2005). The mixing ratio typically decreased throughout the afternoon. The different sampling times of the three instruments result in slightly different features of the temporal NH3 structure. The 1-min PTR-MS data indicate fast NH3 variations on 26th July and early morning of 27th July. A detailed version of the NH3 levels observed by the PTR-MS and the AiRRmonia instruments during this period is shown in Fig. 3. While both instruments found a very similar mixing ratio pattern at half-hour sampling time, the PTR-MS was able to capture additional changes of NH3 occurring at the time scale of minutes. These fast variations may be caused by small scale changes in the advection of air masses close to the ground, as supported by the concurrent variation of the wind speed. The absolute levels agree reasonably well between the instruments on average throughout the period, with some periods with significant differences. The AiRRmonia measured lower mixing ratios than the other two instruments before the thunderstorm on 27th July, but most of the time, the PTRMS and the AiRRmonia followed each other overall rather closely, while the GRAEGOR occasionally showed some divergence from the other two instruments. The GRAEGOR mixing ratios were 20–30% higher than both the PTR-MS Atmos. Chem. Phys., 9, 2635–2645, 2009
2640
M. Norman et al.: Intercomparison of ammonia instruments at a grassland site
30
3.0
AiRRmonia PTR-MS 2.5
wind speed
20
2.0
15
1.5
10
1.0
5
0.5
ms-1
NH3, ppbv
25
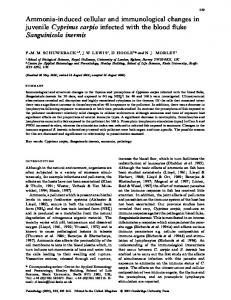
Fig. 4c and e show regressions of the GRAEGOR data with AiRRmonia and PTR-MS, respectively using a calibration made on 1st of August (at the end of the intercomparison period) when (liquid) temperatures were 0.95 and difference of mixing ratios 30◦ C. In contrast, Atmos. Chem. Phys., 9, 2635–2645, 2009
Discussion
The difficulty of measuring atmospheric NH3 is demonstrated in the wide variety of results from NH3 intercomparison exercises found in literature. The study by Wiebe et al. (1990) showed that the measurements including filter packs and annular denuders agreed to within ±30% for NH3 levels higher than 1.5 ppbv, but with a relatively coarse sampling time (minimum 4 h). The five different NH3 measurement techniques tested by Williams et al. (1992) all agreed within a factor of two for NH3 levels above 0.5 ppbv. The photofragment instrument (PF/LIF) and the citric acid coated denuders (CAD/IC) however agreed within 15% for all measured ambient mixing ratios (0.2– 5 ppbv) for a sampling time of 2–8 h. The detailed study by Mennen et al. (1996) showed that the wet-annular rotating denuder (WRD) met all the requirements for air quality monitoring on one hour sampling. The study also showed that both the DOAS and the NOx converter instruments showed correlations of r 2 >0.9 with the WRD, but were found not to be accurate enough for low concentrations. The photoacoustic monitor was rejected because it could not be operated without frequent attention and the thermodenuders were rejected due to their low sampling time. The field intercomparison by Milford et al. (2000) showed that the AMANDA and the DS-FIA had an overall difference of 35% for 30 min sampling times, but also with a substantial scatter of the data. The intercomparison reported by Fehsenfeld et al. (2002) showed that the CIMS and the MoOx converter method correlated with the citric acid denuder with an r 2 >0.91 for sampling times of at least 2 h. However, the averaged concentration ratio for the CIMS and the MoOx converter difference method compared to the denuder was 0.8 and 1.75, respectively. The two different CIMS instruments, tested in the field by Nowak et al. (2006) with ambient levels ranging 0.4 to 13 ppbv showed a difference of 17% and an r 2 =0.71 for a sampling time of one minute. The r 2 would be higher if averages over longer periods were calculated. Among the six different techniques tested in the laboratory by Schwab et al. (2007), all except the modified chemiluminescence analyzer were able to measure mixing ratios within 25% of the expected values under stable conditions between 0 and 20 ppbv. However the TDLAS and the LOPAP showed on average the best agreement with the expected values. The www.atmos-chem-phys.net/9/2635/2009/
M. Norman et al.: Intercomparison of ammonia instruments at a grassland site
2641
25
NH3, AIRRMonia (ppbv)
a) y = Ax + B
20
15
10
5
Figure
N
r2
A
B
a)
93
0.94
0.97 ± 0.03
0.22 ± 0.23
b)
97
0.79
0.78 ± 0.04
1.25 ± 0.36
c)
97
0.79
0.92 ± 0.04
0.58 ± 0.40
d)
86
0.85
0.80 ± 0.03
0.96 ± 0.33
e)
86
0.83
0.95 ± 0.04
0.27 ± 0.38
0
0
5
10
15
20
25
NH3, PTR-MS (ppbv) 25
25
c)
20
NH3, AIRRMonia (ppbv)
NH3, AIRRMonia (ppbv)
b) 15
10
5
20
15
10
5
0
0
0
5
10
15
20
0
25
5
25
15
20
25
20
25
25
d)
e)
20
20
NH3, PTR-MS (ppbv)
NH3, PTR-MS (ppbv)
10
NH3, GRAEGOR (ppbv)
NH3, GRAEGOR (ppbv)
15
10
5
15
10
5
0
0 0
5
10
15
20
25
NH3, GRAEGOR (ppbv)
0
5
10
15
NH3, GRAEGOR (ppbv)
Fig. 4. Bivariate regression plots of hourly averaged data from all three instruments. Data in (a), (c) and (e) represent hourly averaged data from Fig. 2. (c) and (e) are the same as (b) and (d) respectively, but with a different calibration for the GRAEGOR (see text). The error bars represent the observed variability (±σ , standard deviation) within the respective hour (the GRAEGOR only produces one value every hour and in this case error bars present the instrument accuracy of ±12%). The dashed line gives the 1:1 relationship and the solid line gives the result of a reduced major axis regression. N is the number of data points.
TDLAS was also found to have shortest time response during spiking tests. The intercomparison of a QCLAS, a TDLAS and an AMANDA system by Whitehead et al. (2008) found correlations (r 2 ) to be good, ranging between 0.74 and 0.98 for concentration measurements during and after slurry application, with better correlations during the high concentration period. Despite the high correlations, the averaged concentration ratio between individual systems varied significantly (between 0.44 and 1.3). The three instruments tested in this study showed a good correlation with r 2 >0.79 for 1 h averaged values. Uncorrected mixing ratios levels agreed to within 22% with offsets www.atmos-chem-phys.net/9/2635/2009/
ranging from 0.22 to 1.25 ppbv. The PTR-MS and the AiRRmonia agreed to 3% with an r 2 =0.94. The results in this study are well in line with the intercomparison studies mentioned above and the agreement between these very different measurement concepts is encouraging. There exist several possibilities for the deviations from a 1:1 correlation. The departures from the 1:1 ratio shown in Fig. 4a to e were not found to be correlated to one particular meteorological parameter (e.g., wind speed and temperature). Most likely the observed differences were largely attributable to a combination of different effects, which are discussed below.
Atmos. Chem. Phys., 9, 2635–2645, 2009
2642 4.1
M. Norman et al.: Intercomparison of ammonia instruments at a grassland site Calibration procedures and temperature influence
30
NH3 gasphase original NH3 gasphase, original
Atmos. Chem. Phys., 9, 2635–2645, 2009
Mixing ratio, ppbv
The PTR-MS method is not reported to be temperature dependent (Norman et al., 2007). Furthermore, the instrument was placed inside a temperature-controlled trailer. The GRAEGOR and the AiRRmonia instruments were placed outside and were therefore exposed to temperature fluctuations at the field site. The AiRRmonia and the GRAEGOR use identical analytical procedures (AMFIA, see above) and were calibrated with liquid standards, while the PTR-MS was calibrated with a gaseous standard. Any dependence of the scrubbing- or collection efficiency on the mixing ratios for the GRAEGOR and the AiRRmonia could therefore lead to differences over the observed mixing ratio range. The PTRMS has a linear response to the gaseous NH3 standard (Norman et al., 2007). In contrast, the conductivity measurements in the AiRRmonia and the GRAEGOR feature a quadratic response to the introduced liquid standards. Moreover, the transfer of NH3 through the semi-permeable PTFE membrane in the detector block and the conductivity response are a function of temperature (Decuq et al., 2008), which is corrected for using an empirically derived relationship (see e.g., Trebs et al., 2004). In case of the GRAEGOR, substantial differences between calibrations made at different temperatures were observed (as mentioned above). While the AiRRmonia detector was calibrated in the early morning when temperatures were around 15–20◦ C (Fig. 1) the first GRAEGOR calibration was performed on 26th of July when (liquid) temperatures >30◦ C were measured. The calibration on 1st of August (at the end of the intercomparison period) was made at (liquid) temperatures 0.79 with the highest grade of correlation between the AiRRmonia and the PTR-MS (r 2 =0.94). According to the regression analysis the GRAEGOR measured on average about 20% higher mixing ratios than both the AiRRmonia and the PTR-MS instruments. One potential cause for this deviation was unusually high temperatures during the period the GRAEGOR was calibrated in the 5-day intercomparison phase. An analysis of all calibrations performed during the multi-week deployment of the GRAEGOR revealed that this particular calibration stood out with a significantly different sensitivity curve, whereas the all other calibration agreed within 5%. Using these other GRAEGOR calibrations for data analysis, the average difference decreased to