International Journal of Information Technology & Decision Making An Examination of Business Insolvency Based on a Survival Analysis of ICT and NonICT Industries --Manuscript Draft-Manuscript Number: Full Title:
An Examination of Business Insolvency Based on a Survival Analysis of ICT and NonICT Industries
Article Type:
Research Paper
Keywords:
Business insolvency; ICT Industry; Survival analysis; Business life cycles.
Corresponding Author:
Silvana Trimi, Ph.D. University of Nebraska - Lincoln Lincoln, Nebraska UNITED STATES
Corresponding Author Secondary Information: Corresponding Author's Institution:
University of Nebraska - Lincoln
Corresponding Author's Secondary Institution: First Author:
Chang Gyu Yang, PhD
First Author Secondary Information: Order of Authors:
Chang Gyu Yang, PhD Silvana Trimi, Ph.D. Sang Gun Lee, PhD Joon Sun Yang
Order of Authors Secondary Information: Abstract:
This study examined the differences in business insolvency by utilizing survival analysis, a statistical method originated from the medical field. The results show that survival analysis, unlike the previously-used diffusion model, does provide a statistical explanation of the differences in insolvency among ICT, non-ICT, service, and manufacturing firms. ICT firms face a higher risk of business insolvency, and also have a shorter maturity and revival, than their non-ICT counterparts, indicating that continuous and disruptive innovations are more important for survivability in the ICT industry. Service firms overall have a shorter product/service life cycle than that of manufacturing firms.
Suggested Reviewers:
Arben Asllani, Ph.D UC Foundation Professor of Management, University of Tennessee at Chattanooga
[email protected] Expert in decision support systems research. Ted Lee, Ph.D Associate Professor, University of Memphis, TN
[email protected] Does research on Strategic Use of Organizational Information Systems, Ethical Decision-Making in IT Use, and others. Teuta Cata, Ph.D Associate Professor, Norther Kentucky University
[email protected] Expert in this field. Atsuto Nishio, Ph.D Associate Professor, Takushoku University
[email protected] Expert in the relevant research.
Powered by Editorial Manager® and ProduXion Manager® from Aries Systems Corporation
Manuscript Click here to download Manuscript: Survival_IJITDM.docx
An Examination of Business Insolvency Based on a Survival Analysis of ICT and Non-ICT Industries Abstract This study examined the differences in business insolvency by utilizing survival analysis, a statistical method originated from the medical field. The results show that survival analysis, unlike the previously-used diffusion model, does provide a statistical explanation of the differences in insolvency among ICT, non-ICT, service, and manufacturing firms. ICT firms face a higher risk of business insolvency, and also have a shorter maturity and revival, than their non-ICT counterparts, indicating that continuous and disruptive innovations are more important for survivability in the ICT industry. Service firms overall have a shorter product/service life cycle than that of manufacturing firms. Keywords Business insolvency, ICT Industry, Survival analysis, Business life cycles
1
1. Introduction In today’s global economy, competition has become very fierce. Many firms with no substantial competitiveness may become insolvent, while few will maintain a dominant position in the market [14, 25]. The causes of business insolvency are many, such as changes in economic environments, the firm’s weak internal management systems, the absence of effective resources, etc. [2, 7, 39, 65]. Finding the factors that could lead to business insolvency is of utmost importance to organizations and has been the focus of academic research. The nature of the industry to which a firm belongs could also be one of the factors that increase the risk or the likelihood of business insolvency. For example, service providers are constantly under pressure to undergo technological innovations more often than manufacturers: to attract new customers while sustaining their current customers. Thus, service providers have to continuously introduce new products and services, which shortens the product life cycle [15, 66]. The failure to do so may lead the firms to insolvency. Thus, the type of industry (manufacturing or service) may affects a firm’s business insolvency. Its understanding is important but it has received only limited attention. Currently, a small number of ICT firms, with large market shares, control ICT industry trends. They recently have been launching new products much less often than before (example, Apple products) [43, 44]. However, failing to aptly respond to fastmoving ICT market changes will have these firms’ share value plummeting, disposing their subsidiaries, and finally, most likely, forcing them file for bankruptcy (defined as business insolvency). The ICT industry has seen the number of business insolvencies increasing, forcing ICT firms to develop strategies for survival. For example, large companies have been recently in purchasing frenzy of new start-up technology firms and/or mergers and acquisition (M&A) with other companies to keep pace with innovation and prevent business insolvency. Prime examples of such M&A activities are Google (Android in 2005, Youtube in 2006, and mobile unit of Motorola in 2011), Oracle (BEA Systems in 2008 and SunMicro in 2009), IBM (PWC in 2002 and SPSS in 2009), Apple (Siri in 2010 and AuthenTec in 2012), Facebook (Instragram in 2012 and Spool in 2012) and Dish Network and Satellite TV are currently in M&A discussions. ICT-industry firms appear to be in a great risk of insolvency and have a shorter business life cycle than non-ICT firms. Therefore, one of the purposes of this study is to explore if the industry type, ICT vs. non-ICT, is a factor that influences business insolvency. In addition, the industries are composed of two distinguished and different sub2
industries/categories: manufacturers and service providers. Interestingly, previous ICT industry research has not considered this difference. They have focused on: effects of fast innovations and emerging new technologies [10, 42, 70] and measuring the effects of factors that influence the diffusion of specific ICT products [30, 34, 62]. Studies that explored the factors that may influence business insolvency in the ICT industry did not reflect the effect that the uniqueness of each sub-ICT-industry might have on solvency. Therefore, another purpose of this study is to examine whether the type of ICT subindustries, manufacturing or service provider, has effect on business solvency. To explore the above factors’ effects on solvency, we conducted survival analysis using data on: (1) ICT and non-ICT industries and (2) manufacturers and service providers (in both, non-ICT and ICT industries). By exploring the root causes of insolvency of ICT players (manufacturers and service providers) and differences of the causes between ICT and non-ICT firms, this study proposes strategies that could help ICT firms prevent business insolvency, based on their category (manufacturer or service provider). In addition, the study suggests some implications for regulatory agencies, to come up with policies that would help prevent business insolvency in the ICT industry. This paper is organized as follows: Section 2 presents a review of relevant literature for the theoretical concepts of the study; Section 3 explains the research model and develops the research hypotheses; Section 4 describes the method employed in the study and data collection procedures; Section 5 provides and discusses the study results; and Section 6 concludes the paper by summarizing the study's importance, limitations, and future research needs. 2. Literature review 2.1. ICT industry classification The ICT industry accounts for a large portion of the economy because its rapid technological innovations not only generate large profits for the ICT industry but also influence other industries and society overall [41, 42, 59]. OECD classified ICT firms since 1998 and revised its definition and classification in 2007. OECD [58] categorized the ICT industry in two: manufacturers, “Must use electronic processing to detect, measure and/or record physical phenomena or control a physical process,” and service providers, “Must be intended to enable the function of information processing and communication by electronic means.” OECD’s industry classification system (or topology) is summarized in Table 1. 3
Table 1 ICT and Non-ICT Industry Classification ICT Industry Category ICT Manufacturing
ICT Service
ISIC Rev.4 2610 Manufacture of electronic components and boards 2620 Manufacture of computers and peripheral equipment
2630 Manufacture of communications equipment 2640 Manufacture of consumer electronics 2680 Manufacture of magnetic and optical media 5820 Software publishing
Non-ICT Industry (e.g., the Automobile Industry) Category ISIC Rev.4 Non-ICT 2910 Manufacture of Manufacturing motor vehicles 2920
2930
309 3315
Non-ICT Service
4510
61
Telecommunications
4520
62
Computer programming, consultancy, and related activities Data processing, hosting, and related activities; web portals
4530
Repair of computers and communications equipment
7710
631
951
4540
Manufacture of bodies (coachwork) for motor vehicles; manufacture of trailers and semi-trailers Manufacture of parts and accessories for motor vehicles Manufacture of transport equipment Repair of transport equipment (except motor vehicles) Sale of motor vehicles Maintenance and repair of motor vehicles Sale of motor vehicle parts and accessories Sale, maintenance, and repair of motorcycles and related parts and accessories Renting and leasing of motor vehicles
Source : OECD [57]. Under this industry classification system, ICT manufacturers and service providers are similar to those of their counterparts in other industries: firms that produce goods belong to the manufacturing sector, whereas those that produce intangibles belong to the service sector [63]. The service sector not only directly creates value-added through intangibles (e.g., releasing a security pack or utility software etc.) but also influences the 4
value-creation in the manufacturing sector (e.g., development of new types of products due to advances in communications technologies (CDMA, LTE etc.) [69]. Examining the differences in product characteristics, intellectual property rights, and innovation cycles between these two sectors, Howells [31] concluded that: Manufacturers tend to belong to technology-based industries and their technological innovation is driven mainly by their internal capabilities; Service providers tend to belong to consumeroriented industries and their technological innovation is driven mainly by external factors (Table 2). Table 2 Howells’s Characteristics of ICT Manufacturers and Service Providers Characteristics Manufacturing Service Trend Intellectual property Strong (patents) Weak (copyrights) Large difference Technology Technology push Technology pull Decline orientation Innovation Mainly in-house Mainly external Decline generation sourcing sourcing Labor productivity High Low Decline Innovation cycles Short Long Decline Product Tangible (easy to Intangible (difficult Decline characteristics store) to store) Source : Howells[31] 2.2. Business life cycle A number of studies have examined and categorized the life cycle of businesses by focusing on the behavior of firms over time, from the establishment of a firm to its closure [1, 9, 29, 61, 64]. Miller and Friesen [53], the best known study on the business life cycle, based on business environments and major strategies, identified five stages of changes in a firm’s life. In the first stage (business formation), business owners personally participate in running the business and are not afraid to innovate and to face failures. They actively develop new products and services. In the second stage (growth), business ownership is divided among a number of shareholders, and firms generally show a high growth rate. In the third stage (maturity), firms become structured entities and pursue operational efficiency. Throughout the first three phases firms are interested in entering new markets and engaging in innovation activities. In the fourth stage (revival), firms continue to efficiently produce various products. However, the level of innovation decreases, and firms reach the fifth stage (decline), in which prices of goods 5
fall and firms focus on just maintaining the existing level of customer service. A summary of previous research on business life cycle stages and characteristics of each stage is shown in Table 3. Table 3 Studies on the Business Life Cycle Life Cycle Phase Formation Phase
Description New firms attempt to become viable entities.
Growth Phase
Firms reach the growth phase once they have established their distinct competences and achieved some initial market success. Maturity follows growth as sales levels stabilize, the level of innovation falls, and a more bureaucratic organization structure is established. Firms diversify and expand the scope of their products.
Maturity Phase
Revival Phase
Decline Phase
This is the final stage.
Researcher Wachtel et al. [71] Hall [28] Moores and Yuen [55] Adizes [1] Miller and Friesen [54] Moores and Yuen [55] Scott [64] Greiner [27]
Scott [64] Quinn and Cameron [61] Greiner [27] Downs [20] Lyden [50] Moores and Yuen [55]
2.3. Survival analysis Survival analysis, a statistical method originated from the medical field for identifying the factors influencing the survival of patients, is used to investigate the causes and patterns of various events [5, 11]. It has been used for a wide range of other applications including the customer retention period, the breakdown time, the unemployment period, and the re-imprisonment time for criminals, among others. Researchers have used it to explore business insolvency of individual firms: determine the causes of the survival, identify insolvency models, and estimate the survival function. Other studies in the ICT industry employed survival analysis to examine customer churn. A summary of previous research that used survival analysis on business insolvency provided in Table 4. Table 4 Studies of Business Insolvency Based on Survival Analysis Category Non-ICT
Researcher Mata and Portugal
Finding One fifth of new firms fail during the first year of their 6
[51] Mata et al. [52]
Audretsch and Mahmood [6]
ICT
Agarwal and Gort [3] Das and Srinivasan [19] Kauffman et al. [36]
Lu [47] Lu and Park [48]
Gopal and Meher [26]
lives, and only 50% survive for four years. Size is an important determinant of the likelihood of survival, and this is more relevant to new entrants than to established firms. Establishment-specific characteristics (such as the organizational structure and firm size) play important roles in shaping firms’ exposure to risks associated with confronting newcomers. A firm's life cycle depends on the technological intensiveness of its production process. There is a positive relationship between a firm’s size at entry and the probability of its exit. A firm’s post-entry size is negatively related to its bankruptcy or closure. Smaller firms facilitating customer-provider interactions tend to be transaction brokers, relying mainly on advertising as their primary source of revenue, and they are less likely to face bankruptcy or failure. Customer lifetime value is a powerful and straightforward measure that synthesizes customer profitability and churn (attrition) risk at the level of individual customers. Mobile telecommunication customers’ churn time or tenure prediction model based on ordinal regression.
3. Research hypotheses 3.1. Business insolvency in ICT and non-ICT industries In the ICT industry, innovation occurs rapidly and requires a high level of technology [21, 37]. Thus, ICT firms need to strive for technological innovation, more so than their non-ICT counterparts, thus shortening the time to market of new ICT products [22]. In addition, users of ICT products and services are also constantly looking for new technologies, products, and services [4, 24, 40, 46]. These mean that in the ICT industry, both firms and customers are constantly searching for continuous advances in technologies thus shortening the time-to-market of new products and services [16]. This market environment induces fiercer technological competition among ICT firms, and firms that cannot compete are more likely to face insolvency than they are in other industries [8, 13]. As for non-ICT firms, they generally take a long time in developing and introducing new products and services as their production processes are based on the accumulated know-how over long periods of time [33, 60]. In addition, market environments for non-ICT industries typically are difficult to penetrate because of barriers and regulations. It is a challenge to combine external and internal technologies 7
in non-ICT industries. In sum, the differences between the ICT and non-ICT industries can directly influence business insolvency rate. Thus, we propose the following hypothesis: H1. Business insolvency occurs more frequently in the ICT industry than in non-ICT industries. As previously discussed (Table 1), both ICT and non-ICT industries have traditionally been classified into sub-categories of manufacturing and services. It would be of interest to examine the differences between ICT industry and others, at the level of the two subcategories: between ICT manufacturers and non-ICT manufacturers; and ICT service providers and non-ICT providers. The purpose is to investigate whether the industry characteristic, is a factor that influences business insolvency. As previously discussed, the ICT industry’s rapid technological innovation, with constant release of new products, shortens continuously the time to market for new products. This unique characteristic increases the severity of competition among ICT manufacturers, influencing a firm’s business insolvency [18, 32, 38, 45, 56, 68, 72]. Same can be argued for service providers: the competition among ICT service providers is more intense than that among non-ICT service providers. ICT service providers must provide many new services (such as new applications, customer support) and supporting infrastructure (such as more coverage and higher speed networks, etc.) almost every time a new product is released. In addition, since entry barriers in the ICT service provider market are very low, the competition increases as not only the number of competing firms increases but also the services and products offered increases as the new entrants bring new innovative ideas [74]. In sum, the characteristics of the ICT industry do influence business insolvency. Thus, we propose the following hypotheses: H1a. ICT manufacturers face business insolvency more frequently than non-ICT manufacturers. H1b. ICT service providers face business insolvency more frequently than non-ICT providers. 3.2. Business insolvency between manufacturers and service providers Today’s industries, more segmented than in the past with manufacturers and service providers, operate under their unique market conditions [23]. Manufacturers 8
pursue profits by selling products to consumers directly or through service providers. Entering a manufacturer’s market is not easy, as barriers of entry can be high or even forbidding, and it requires a great amount of investments (time and financial). For the existing players, introducing a new product in the market is not easy and usually is executed with great caution. It not only involves a great deal of R&D investment, but it also requires a competitive level of manufacturing technology achieved by investing a large amount of sunk cost, during both development and manufacturing of products [75]. Service providers on the other hand value by selling manufacturers’ products bundled with some intangibles, through the various applications and usage of the products. As already discussed, service providers’ innovation activities would also depend on the characteristics of their industry: ICT service providers need to be more innovative than their non-ICT counterpart. Market entry barriers for service providers, their sunk cost, and labor productivity tend to be lower than those of manufacturers, making their competitive environment more severe, as a red ocean [12]. Based on the above discussions, one would expect that service providers are more in risk of insolvency than manufacturers. The following hypothesis is proposed: H2. Service providers have a higher level of business insolvency than manufacturers. The differences between service providers and manufacturers should be further examined within each industry in the ICT industry and in the non-ICT industry (so that we can better understand the reciprocal relationship between manufacturers and service providers within an industry. In general, service providers are subordinate to manufacturers as they create value added by providing services (e.g., Digital Multimedia Broadcasting (DMB) and music services) for manufacturers’ goods (e.g., m mobile phones, cars). ICT service providers generally create value by providing software loaded in products, whereas non-ICT service providers distribute, install, and maintain products. Thus, regardless of the differences in creating value-added, both ICT and non-ICT service providers are subordinate to their manufacturers, and therefore are in a higher risk for business insolvency. The following hypotheses are suggested: H2a. ICT service providers have a higher level of business insolvency than ICT manufacturers. H2b. Non-ICT service providers have a higher level of business insolvency than nonICT manufacturers.
9
4. Method and data collection 4.1. Research methodology 4.1.1. Survival analysis Survival analysis, a statistical method used mainly in the medical field for identifying the factors influencing patient survival, is used to analyze time series data for events of interest to researchers [5, 11]. For example, in research on mortality for a particular population, an event means an individual’s death, and the duration of life (survival time) means the period from an individual’s birth to his or her death. Survival analysis has been used by other fields as well, such as, insurance, marketing, sociology, and criminology [17, 49, 73]. Data used for estimating survival functions has some distinct characteristics. First, durations (such as, the survival time, the breakdown time, and retention period) are always measured using positive numbers. Second, each subject has different time intervals (before results are determined) and, not every one of them may produce results at the end of the study. Therefore, because some data collected may not be measureable because of non-controllable (by the researcher) factors, some observations may be censored and may make the amount of time it takes to a particular event to not follow a normal distribution. The survival rate can be determined by using a survival function at time t, S(t). If T is the duration of life, then the survival function S(t) is the estimated likelihood of an individual surviving longer than time t (equation (1)). Equation (2) measures the cumulative function F(t) of duration of life T. S(t) = P(an individual survives longer than t) = P(T > t) S(t) = 1 – P(an individual failed before t) = 1 – F(t)
(1) (2)
When graphing S(t) over the observation time (t), referred to as the survival curve, the graph value range between 1 (all individuals survive) and 0 (all individuals die). 4.1.2. Kaplan-Meier Method To estimate survival functions and better understand subject’s survival, previous studies interchangeably employed two methods: univariate regression analyses, as 10
nonparametric tests; and multivariate regression analyses, as parametric test. In this study, we used a nonparametric test, the Kaplan-Meier’s method [35], also known as the product limit method. Whenever there is an event, the Kaplan and Meier method calculates the cumulative survival rate by arranging the survival time in an ascending order. This method is less likely to lose data on observation times for subjects than other survival analysis methods. In addition, the Kaplan-Meier method is widely used because its calculation of survival functions is relatively simple and it is easy to address cutoffs and follow-up losses. Since the observation interval is determined automatically only whenever there is an event, there is no need in this method to divide the observation period into regular intervals. The generalized formula for calculating the survival function by using the Kaplan-Meier method is provided in Equation (3): 𝑡 S(t) = 𝜋𝑖=1 [
𝑛𝑖 −𝑑𝑖 𝑐 𝑖 ] 𝑛𝑖
(3)
where: S(t) is the estimated survival function at time t; π𝑡𝑖=1 is calculated by multiplying all subjects' duration of life at a point in time, t; n is the total number of subjects in the sample; i is the total number of surviving subjects at time t; and 𝐶𝑖 is a constant with value 1 or 0 (𝐶𝑖 = 0 if data is a censored data). 4.2. Data Collection For this study, data was collected from Korean ICT and automobile industries. In Korea, both industries, which began in the 1960s and became globally competitive since the early 2000s, have substantial influences on the Korean economy. Furthermore, the analysis results may provide critical insights for other countries (e.g., China and India) that are striving to drive these two industries as the backbone of their economies. We employed the firms’ establishment dates as the best estimators for firms’ market entry. Data on ICT manufacturers’ and ICT service providers’ establishment date were collected by using public data from the Financial Supervisory Service (http://dart.fss.or.kr). The DART System (Data Analysis, Retrieval, and Transfer System) of the Financial Supervisory Service provides access to information on publicly traded as well as large private firms in Korea for trading or investment purposes. Firms enrolled in the DART System are required to make full financial disclosure and receive external audits from certified public accounting firms, and they may issue securities through initial public offerings (IPOs) or seasoned equity offering (SEOs). Therefore, 11
data credibility is officially guaranteed. Data on firm closures were obtained from the reports on the cessation of operations by national organizations, and data on the closure date from the National Tax Service, which are highly reliable. To perform the survival analysis, we classified the data on firms’ survival time into four categories: ICT manufacturers, ICT service providers, non-ICT manufacturers, and non-ICT service providers. ICT manufacturers included those producing electronic devices, computers, and video, audio, and communications equipment. ICT service providers included those that offer online (excluding printing) publication, video, broadcasting, and information services. For non-ICT industries, we collected data on the Korean automobile industry. The rationale for the selection was that: the Korean automobile industry began its rapid growth at the same time as the ICT industry (in the 2000s); the Korean auto industry is led by two major players, Hyundai Motor Company and Kia Motors, just as the Korean ICT industry is led by Samsung and LG [67]; and the auto industry is the only candidate that has comparable influence on the national economy as the ICT industry. For manufacturers, we collected data on automobile and trailer manufacturers. For service providers, we collected data on automobile and component distributors, and automobile service centers. Table 5 shows the composition of this study’s sample. Table 5 Sample Year 1961~1970 1971~1980 1981~1990 1991~2000 2001~2010 Total
ICT Industry Manufacturing
Service
Non-ICT Industry Manufacturing Service
New
Closed
New
Closed
New
Closed
New
Closed
27 130 310 1,348 612 2,427
13 2,414 2,427
19 17 96 1,749 529 2,410
21 2,389 2,410
34 92 217 462 294 1,099
9 1,090 1,099
102 104 155 405 573 1,339
8 1,331 1,339
5. Results Table 6 shows the average duration of life obtained through a survival analysis. The average duration of life for ICT firms was approximately 11 years (4,035 days), whereas that for non-ICT firms was approximately 15 years (5,550 days). More specifically for each industry: in the ICT industry, the average duration of life for ICT service providers was approximately 9 years (3,483 days) and for ICT manufacturers 12
was approximately 12 years (4,583 days); for non-ICT industry, the average duration life for service providers was approximately 16 years (5,369 days), and for manufacturers was as well approximately 16 years (5,770 days). Table 6 Survival Analysis Results: Average Life Duration
Non-ICT Industry
ICT Industry
All Non-ICT service Non-ICT manufacturing All ICT service ICT manufacturing
Service (All) Manufacturing (All)
Mean Median Mean Median Mean Median Mean Median Mean Median Mean Median Mean Median Mean Median
Survival Time (day)
Standard Error
95% Confidence Interval
5550.32 4383.00 5369.96 3900.00 5770.08 5070.00 4035.42 3659.00 3483.68 3349.00 4583.29 3851.00 4157.38 3520.00 4953.20 4067.00
81.36 85.95 120.04 103.54 105.45 114.69 39.52 33.99 45.08 63.39 62.88 36.24 53.80 49.52 55.12 41.57
(5390.86, 5709.79) (4214.53,4551.47) (5134.69,5605.23) (3697.06,4102.94) (5563.40,5976.75) (4845.22,5294.78) (3957.95,4112.88) (3592.38,3725.62) (3395.32,3572.03) (3224.75,3473.25) (4460.04,4706.54) (3779.97,3922.03) (4051.93,4262.84) (3422.95,3617.05) (4845.16,5061.23) (3985.53,4148.47)
The duration of life by industry is an efficient measure of business insolvency. However, within-industry difference of the duration of life is an important measure to understand the industry’s competitive environment and characteristics influences on business insolvency. The results of the nonparametric analysis method (Two-Sample Kolmogorov-Smirnov Test), which indicate within-group differences in survival times, are shown in Table 7. Table 7 Two-Sample Kolmogorov-Smirnov Test: Differences in Life Duration Factor
Tarone-Ware Statistic (p-value) Non-ICT (All)
Kolmogorov-Smirnov Z (p-value) Non-ICT (All)
ICT (All)
275.34 (0.0000)
8.218 (0.000)
Factor
Tarone-Ware Statistic (p-value) Service
Kolmogorov-Smirnov Z (p-value) Service
Manufacturing
156.69 (0.0000)
5.927 (0.000)
Factor
Tarone-Ware Statistic (p-value)
Kolmogorov-Smirnov Z (p-value) 13
Non-ICT service Non-ICT manufacturing ICT service ICT manufacturing
18.18 (0.0000) 171.52 (0.0000) 16.19 (0.0001)
Non-ICT ICT manufacturing service
Non-ICT service
Non-ICT manufacturing
ICT service
438.74 (0.0000) 105.07 (0.0000)
3.943 (0.000) 6.678 (0.000) 3.027 (0.000)
9.524 (0.000) 5.625 (0.000)
5.192 (0.000)
175.43 (0.0000)
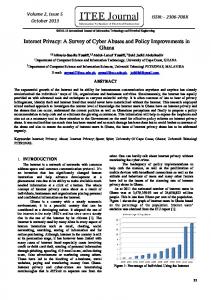
5.1. ICT and Non-ICT Industries Life Cycle The results of this analysis showed that there were differences in business insolvency between ICT and non-ICT industries (Fig. 1). Within 15 years after market entry, approximately 80% of firms, in the ICT industry faced insolvency; while in the non-ICT industry only 60% of them did. These results show that the ICT industry’s competitive environment is more severe thus requires greater efforts for technological innovation, which shorten the product life cycle. ICT firms need to attract customers through technological innovations, allowing them less preparation time to replace existing products. The life cycle of ICT firms have shorter maturity and revival stages than their non-ICT counterparts. Some ICT firms may not even go through these two stages (maturity and revival) of life cycle because many of them, required to continuously innovate after the growth stage are unable to do so and therefore, face insolvency before going through the later stages. On the other hand, there are many new ICT start-ups that enter the market with new innovative technologies, but because they may encounter difficulty to grow and survive in the red ocean ICT industry, they dissolve by either simply going bankrupt or by being purchased by the industry’s big players (e.g., Tumblr was bought by Yahoo). Thus, ICT firms that cannot adapt well to technological changes are likely to face insolvency. The high level of insolvency in the ICT industry can also be explained by swing effects, and winner–take-all outcomes, more easily observed in ICT products. As Fig. 1 showed in, only a few firms, in both the ICT and non-ICT industries, survive for long periods of time. The successful early movers are more likely to enjoy the first-mover advantage: gain a large customer base. Innovative products and communication among early adopters may induce a bandwagon effect for select firms. Thus, only firms with these competitive advantages can enjoy market dominance. As seen in Fig. 1, this is particularly true in the ICT industry where survival times were much shorter than for non-ICT ones. These results suggest that market characteristics do influence business insolvency. These results support our Hypothesis 1, which predicted that business 14
insolvency is more likely in the ICT industry.
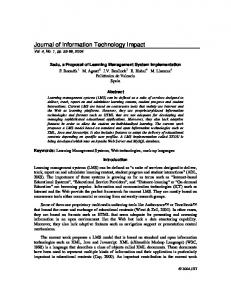
Fig. 1. ICT and Non-ICT Firms’ Survival (H1) Fig. 2 shows that the differences in business insolvency between ICT and non-ICT manufacturers also are substantial, thus supporting Hypothesis 1a. In general, the life cycle of new products, based on advanced technologies, is much shorter for ICT products than for non-ICT ones. For example, a smart phone lifecycle is getting shorter and shorter, whereas that of automobiles has remained about the same or has not have such a drastic decrease. The shortened product life cycle of ICT products means a reduction in preparation time: gaining technical skills and competencies for production; making suppliers unhappy or perhaps finding new suppliers; decrease in production and supply chain efficiency, etc. These all could have a direct effect on the higher business insolvency for the ICT manufacturers, as the current struggles of Nokia, Blackberry RIM, even Apple to a certain degree (their product life cycle is not as short as it used to be, or as short as others’) are demonstrating.
15
Fig. 2. ICT Manufacturers and Non-ICT Manufacturers’ Survival (H1a) Fig. 3 shows the survival patterns for ICT and non-ICT service providers. As can be seen, even though service providers for both industries showed similar patterns in terms of business insolvency during the first 10 years after market entry, ICT service providers revealed higher business insolvency than their non-ICT counterparts. ICT service providers create value supporting ICT products, and therefore are very dependent on the conversion cycle of ICT products. Whenever there is a major product or technology transition, ICT service providers need to adapt quickly to the changed competitive market, otherwise they may experience sudden insolvency if they cannot. In this regard, ICT service providers’ business insolvency is closely related to the ever shortening life cycle of ICT products. Even though new ICT services firms may enter the market, usually with specialized services while imitating their competitors' business models, they needs to shift quickly, from being a first mover to being a fast follower, with sudden changes in their strategies whenever a new ICT products is introduced. The results of this study indicated that ICT service providers experienced no revival or decline stage: the solvency rate was low within a certain period of time after market entry; afterwards, it increased rapidly. As for non-ICT service providers, when a renaissance is experienced, there was a gradual decline in the survival time. This finding is inconsistent with previous research findings, because it implies that the revival and decline stages are not applicable to ICT service providers’ business life cycles. The 16
increasingly shortened ICT product life cycles, inevitably require more extensive innovation efforts from ICT service providers. Thus, ICT service providers are more likely to face business insolvency than non-ICT service firms, thus Hypothesis 1b is supported.
Fig. 3. ICT Service providers and Non-ICT Service providers’ Survival (H1b) An interesting, additional finding in regard to Hypothesis 1 is that ICT service providers’ life cycle patterns were very different from all other types of firms (i.e., ICT and non-ICT manufacturers, and non-ICT service providers). This means, that ICT service providers are the most vulnerable among all to insolvency, and therefore, ICT service market is the most competitive, bloody one. 5.2. Manufacturers and Service Providers Fig. 4 shows that, in general, business insolvency was more likely to occur to service providers than to manufacturers, thus supporting Hypothesis 2. However, the results also showed that approximately after 30 years from market entry, business insolvency is more likely for manufacturers than for service providers, suggesting that, during the initial stages of market entry, competition is more severe for service providers than for manufacturers. This is because entry barriers for service providers are 17
lower, and it is relatively easier to imitate service business models. However, after a certain period of time from entering a market (approximately 10 years), the likelihood of business insolvency for service providers decreases, as they have the first mover advantage (customer base, bandwagon effect, brand recognition, and expertise), have the flexibility (more adaptable as they have gained expertise and experience) to offer new services, and have the market power (dominance) to pursue mergers and acquisitions (M&A) to prolong their survival.
Fig. 4. Manufacturers’ and Service Providers’ Survival Functions (H2) Fig. 2 and Fig. 3 also did show that business insolvency was more likely for service providers than for manufacturers for both the ICT and non-ICT industries. Fig. 5 shows that the difference in business insolvency between ICT service providers and manufacturers, are not that great during the early years after market entry but they increase sharply over time. This result implies that, while all ICT firms (manufacturers and service providers) are strongly influenced by the shortening of ICT product life cycles, ICT manufacturers are more likely than service providers to overcome the effects of the shortened product life cycle. This can be explained by the fact the replacement of ICT products with new ones introduced by ICT manufacturers also depends on the customers, who are constantly searching for and communicating with others about new products’ features and benefits (e.g., new versions of iPhone, Samsung, 18
Bluetooth, etc.). The replacement of existing services by ICT service providers is much more difficult (e.g., replacing unlimited usage data plan with limited data usage for the iPhone subscribers). If we look further in the ICT industry (Fig. 5), even though the likelihood of business insolvency for ICT service providers is greater compared to ICT manufacturers (thus supporting Hypothesis 2a), there is a reversal after a certain period of time. Survival times for ICT service providers drops sharply after 10 years suggesting that, even when ICT service providers have acquired sufficient market power after years of business (approximately 10 years), they still need new survival strategies. In general, ICT service providers create value mainly through serving core technologies. As the ICT products and technology constantly change, a first mover in service providing, about 10 years after their market entry, should modify its business strategies and become fast follower.
Fig. 5. ICT Manufacturers’ and ICT Service Providers’ Survival (H2a) As for non-ICT industry, as shown in Fig. 6, there were no substantial differences in business insolvency between non-ICT manufacturers and service providers throughout their life cycles, thus Hypothesis 2b is not supported. Non-ICT service providers showed longer survival times with the revitalization of the market during the mature or decline stage. They can survive independently from non-ICT manufacturers 19
as ICT providers create value by relying on sales networks and not so much on technologies to promote and serve their products.
Fig. 6. Non-ICT Manufacturers’and Non-ICT Service Providers’Survival (H2b*) * Not supported 6. Conclusion The ICT market is highly competitive and becoming saturated. ICT firms have greater risk for business insolvency than to their non-ICT counterparts. Thus, it is important to identify the main causes of insolvency in the ICT industry and to understand that they are due to its unique characteristics. Previous studies generally provided a macroscopic description of the ICT market, by focusing on the behavior of customers but did not consider, compare, and reveal the differences between the ICT subcategories, manufacturers and service providers. This study used survival analysis to explore the industry types’ effect on business insolvency by identifying the differences between ICT and non-ICT industry. It also investigated within the ICT industry about differences (and therefore, the subcategory type effect) on business solvency between ICT manufacturers and ICT service providers. By identifying and understanding such differences, this study offers some important strategic implications for ICT firms to survive in their red ocean market. 20
The results that ICT firms have higher risk of business insolvency than non-ICT ones suggest that severe competition among ICT firms has shortened product life cycles and induced a high level of business insolvency and. The shorter maturity and revival phases that ICT firms face as compared to non-ICT ones (shown by this study’s results) indicate that, because of the constant requirement for new products and technologies, ICT firms have to be highly innovative and disruptive, and therefore frequently purchase new start-ups and/or get involved in M&As to extend their survival time. In addition, the results indicate that ICT service providers’ competitiveness and duration were strongly influenced by and dependent on ICT manufacturers; and swing effects and winner–take-all outcomes were more prevalent for ICT service providers than for ICT manufacturers. The findings of this study suggest the following survival strategies for firms. First, ICT industry firms (manufacturers and service providers), to prevent business insolvency caused by their industry’s characteristics, should focus on accumulating know-how for core technologies, developing spin-off products, and maintaining market environments that facilitate communication among customers. Since few ICT players survive over 10 years, much shorter than their non-ICT counterparts, it is crucial for them to secure core technologies as well as build entry barriers. In addition, ICT manufacturers should emphasize continuous technological innovation (new products) and promote networking among customers (for bandwagon effect). ICT service providers can soften their dependence on ICT manufacturers for survival by joining forces with firms in other industries, through M&A, to offer new innovative services. Second, bandwagon effects, swing effects, and winner-take-all outcomes are important to the survival of ICT firms. ICT players need to be very agile, be able to quickly and effectively respond to new products and technologies that develop constantly in the ever-changing ICT market. Because of the shortened ICT products’ life cycles, ICT manufacturers should establish strategies for facilitating rapid technology innovation and shortening the time to market of new products to enhance their competitiveness. Survival analysis is a good method to dynamically observe the survival time for firms in an industry, and to measure the differences statistically. In this study, survival analysis provided a numerical evaluation of the length of actual ICT firms’ operation based on their survival times, thus helping provide existing firms and potential entrants with opportunities to develop appropriate strategies for achieving market dominance or simply to survive. However, using only survival times does not explain all market conditions, such as regulatory agencies’ market policies, and various social phenomena. 21
Future research should use quantitative analysis for measuring other market factors. Finally, in this study we provided no explanation for various intangible factors influencing the industry or market. Future research should apply the survival analysis to a variety of industries, in different countries, and include intangible factors. References [1] [2] [3] [4]
[5] [6] [7] [8]
[9] [10]
I. Adizes, Organizational passages-Diagnosing and treating lifecycle problems of organizations. Organizational Dynamics, 8 (1), 1979, pp. 3-25 R. Agarwal, Survival of firms over the product life cycle. Southern Economic Journal, 63 (3), 1997, pp. 571-584 R. Agarwal, M. Gort, The evolution of markets and entry, exit and survival of firms. The Review of Economics and Statistics, 78 (3), 1996, pp. 489-498 J. Ahn, S. Han, Y. Lee, Customer churn analysis: Churn determinants and mediation effects of partial defection in the Korean mobile telecommunications service industry. Telecommunications Policy, 30 (10-11), 2006, pp. 552-568 P. D. Allison, Survival analysis using SAS: a practical guide, Sas Institute, 2012. D. B. Audretsch, T. Mahmood, New firm survival: new results using a hazard function. The Review of Economics and Statistics, 77 (1), 1995, pp. 97-103 D. B. Audretsch, J. Mata, The post-entry performance of firms: Introduction. International Journal of Industrial Organization, 13 (4), 1995, pp. 413-419 Y. Bakos, H. C. Lucas, W. Oh, G. Simon, S. Viswanathan, B. Weber, The impact of e-commerce on competition in the retail brokerage industry. Information Systems Research, 16 (4), 2005, pp. 352 J. R. Baldwin, P. K. Gorecki, Firm entry and exit in the Canadian manufacturing sector, 1970-1982. Canadian Journal of Economics, 14 (2), 1991, pp. 300-323 B. Bayus, High-definition television: Assessing demand forecasts for a Next generation consumer durable. Management Science, 39 (11), 1993, pp. 13191333
[11] [12]
M. Bland, An introduction to medical statistics, Oxford University Press, 2000. K. D. Brouthers, L. E. Brouthers, Why Service and Manufacturing Entry Mode Choices Differ: The Influence of Transaction Cost Factors, Risk and Trust*. Journal of Management Studies, 40 (5), 2003, pp. 1179-1204
[13]
R. K. Chellappa, V. Sambamurthy, N. Saraf, Competing in Crowded Markets: Multimarket Contact and the Nature of Competition in the Enterprise Systems Software Industry. Information Systems Research, 21 (3), 2010, pp. 614-630 22
[14]
R. K. Chellappa, N. Saraf, Alliances, rivalry and firm performance in enterprise
[15]
systems software markets: A social network approach. Information Systems Research, 21 (4), 2010, pp. 849-871 C. F. Chien, Y. J. Chen, J. T. Peng, Manufacturing intelligence for semiconductor demand forecast based on technology diffusion and product life cycle. International Journal of Production Economics, 128 (2), 2010, pp. 496-509
[16]
[17]
[18]
[19]
[20] [21] [22] [23]
[24]
[25]
[26]
J. Y. Choi, Y. Kim, Y. Jun, Y. Kim, A Bayesian multivariate probit analysis of Korean firms' information system adoption. Industrial Management & Data Systems, 111 (9), 2011, pp. 1465-1480 K. G. Cloyes, B. Wong, S. Latimer, J. Abarca, Time to Prison Return for Offenders With Serious Mental Illness Released From Prison A Survival Analysis. Criminal justice and behavior, 37 (2), 2010, pp. 175-187 C. M. Dahl, H. C. Kongsted, A. Sørensen, ICT and productivity growth in the 1990s: panel data evidence on Europe. Empirical Economics, 40 (1), 2011, pp. 141-164 S. Das, K. Srinivasan, Duration of firms in an infant industry: the case of Indian computer hardware. Journal of Development Economics, 53 (1), 1997, pp. 157167 A. Downs, The life cycle of bureaus, Inside bureaucracy, 1967. T. Elfring, W. Hulsink, Networks in entrepreneurship: the case of hightechnology firms. Small Business Economics, 21 (4), 2003, pp. 409-422 S. Ezell, S. Andes, ICT R&D policies: An international perspective. Internet Computing, IEEE, 14 (4), 2010, pp. 76-80 C. Feijóo, I. Maghiros, F. Abadie, J.-L. Gómez-Barroso, Exploring a heterogeneous and fragmented digital ecosystem: Mobile content. Telematics and Informatics, 26 (3), 2009, pp. 282-292 C. Forman, A. Ghose, B. Wiesenfeld, Examining the relationship between reviews and sales: The role of reviewer identity disclosure in electronic markets. Information Systems Research, 19 (3), 2010, pp. 291-313 D. R. Gnyawali, W. Fan, J. Penner, Competitive Actions and Dynamics in the Digital Age: An Empirical Investigation of Social Networking Firms. Information Systems Research, 21 (3), 2010, pp. 594-613 R. Gopal, S. Meher, Customer churn time prediction in mobile telecommunication industry using ordinal regression. 12th Pacific-Asia Conference on Advances in Knowledge Discovery and Data Mining, 2008, pp. 884-889 23
[27] [28] [29] [30] [31] [32] [33] [34] [35] [36]
[37]
[38]
[39]
[40]
[41] [42]
L. E. Greiner, Evolution and revolution as organizations grow. 1972. Harvard Business Review, 76 (3), 1998, pp. 55 R. Hall, The strategic analysis of intangible resources. Strategic management journal, 13 (2), 1992, pp. 135-144 P. E. Hart, N. Oulton, Growth and size of firms. The Economic Journal, 106 (438), 1996, pp. 1242-1252 D. Horsky, L. Simon, Advertising and the diffusion of new products. Marketing Science, 2 (1), 1983, pp. 1-17 J. Howells, The Nature of Innovation in Services, Innovation and productivity in services, 2001. C. L. Hsu, H. P. Lu, H. H. Hsu, Adoption of the mobile Internet: An empirical study of multimedia message service (MMS). Omega, 35 (6), 2007, pp. 715-726 M. Javidan, Core competence: what does it mean in practice? Long range planning, 31 (1), 1998, pp. 60-71 S. Kalish, Monopolist pricing with dynamic demand and production cost. Marketing Science, 2 (2), 1983, pp. 135-159 E. L. Kaplan, P. Meier, Nonparametric estimation from incomplete observations. Journal of the American statistical association, 53 (282), 1958, pp. 457-481 R. J. Kauffman, B. Wang, Tuning into the digital channel: evaluating business model characteristics for Internet firm survival. Information technology and management, 9 (3), 2008, pp. 215-232 S. H. Kim, K. H. Huarng, Winning strategies for innovation and high-technology products management. Journal of Business Research, 64 (11), 2011, pp. 11471150 E. Kiser, Predicting household switching behavior and switching costs at depository institutions. Review of Industrial Organization, 20 (4), 2002, pp. 349365 S. Klepper, K. L. Simons, The making of an oligopoly: firm survival and technological change in the evolution of the US tire industry. Journal of political economy, 108 (4), 2000, pp. 728-760 N. Kumar, I. Benbasat, Research note: the influence of recommendations and consumer reviews on evaluations of websites. Information Systems Research, 17 (4), 2006, pp. 425-439 D. J. Lee, J. K. Ahn, Factors affecting companies’ telecommunication service selection strategy. Omega, 35 (5), 2007, pp. 486-493 J. Lee, Y. Cho, J. Lee, C. Lee, Forecasting future demand for large-screen 24
television sets using conjoint analysis with diffusion model. Technological [43]
[44]
[45]
[46]
[47]
[48]
[49] [50] [51] [52]
[53] [54] [55]
Forecasting and Social Change, 73 (4), 2006, pp. 362-376 S. G. Lee, B. Park, S. H. Kim, H. H. Lee, Innovation and imitation effects in the mobile telecommunication service market. Service Business, 6 (3), 2012, pp. 114 S. G. Lee, M. Yu, C. Yang, C. Kim, A model for analyzing churn effect in saturated markets. Industrial Management & Data Systems, 111 (7), 2011, pp. 1024-1038 J. Lopez Jr, R. A. Raines, M. A. Temple, R. O. Baldwin, J. P. Stephens Sr, An investigation on the effects of emerging 4G transmissions on 3G networks. Omega, 35 (6), 2007, pp. 706-714 B. Low, W. Johnston, Relationship equity and switching behavior in the adoption of new telecommunication services. Industrial Marketing Management, 35 (6), 2006, pp. 676-689 J. Lu, Predicting customer churn in the telecommunications industry–An application of survival analysis modeling using SAS, SAS User Group International Online Proceedings, 2002. J. Lu, O. Park, Modeling customer lifetime value using survival analysisan application in the telecommunications industry, Proceedings of the SAS Conference, 2003. P. D. Lunn, The sports and exercise life-course: a survival analysis of recall data from Ireland. Social Science & Medicine, 70 (5), 2010, pp. 711-719 F. J. Lyden, Using Parsons' functional analysis in the study of public organizations. Administrative Science Quarterly, 20 (1), 1975, pp. 59-70 J. Mata, P. Portugal, Life duration of new firms. The Journal of Industrial Economics, 42 (3), 1994, pp. 227-245 J. Mata, P. Portugal, P. Guimaraes, The survival of new plants: Start-up conditions and post-entry evolution. International Journal of Industrial Organization, 13 (4), 1995, pp. 459-481 D. Miller, P. H. Friesen, A longitudinal study of the corporate life cycle. Management science, 30 (10), 1984, pp. 1161-1183 D. Miller, P. H. Friesen, Successful and unsuccessful phases of the corporate life cycle. Organization Studies, 4 (4), 1983, pp. 339 K. Moores, S. Yuen, Management accounting systems and organizational configuration: a life-cycle perspective. Accounting, Organizations and Society, 26 (4-5), 2001, pp. 351-389 25
[56]
S. Mun, Y. Yoon, H. Chun, Knowledge Spillovers and R&D Cooperation:
[57]
Evidence from Korean ICT Manufacturing Firms. International Telecommunications Policy Review, 18 (1), 2011, pp. OECD, Classifying Information and Communication Technology(ict) Services, 2007 OECD, The Information and Communication Technology Sector: A definition,
[58] [59]
[60] [61]
[62] [63]
[64] [65] [66] [67] [68]
[69] [70]
1998 J. Park, S. K. Shin, G. L. Sanders, Impact of international information technology transfer on national productivity. Information Systems Research, 18 (1), 2007, pp. 86-102 B. Quelin, Core competencies, R&D management and partnerships. European Management Journal, 18 (5), 2000, pp. 476-487 R. E. Quinn, K. Cameron, Organizational life cycles and shifting criteria of effectiveness: Some preliminary evidence. Management science, 29 (1), 1983, pp. 33-51 B. Robinson, C. Lakhani, Dynamic price models for new-product planning. Management Science, 21 (10), 1975, pp. 1113-1122 S. Roslow, J. Nicholls, J. Tsalikis, Time and quality: twin keys to customer service satisfaction. Journal of Applied Business Research (JABR), 8 (2), 2011, pp. 80-86 B. R. Scott, Stages of Corporate Development (Part I), Harvard Business School, 1971. K. Singh, The impact of technological complexity and interfirm cooperation on business survival. Academy of Management Journal, 40 (2), 1997, pp. 339-367 P. G. Smith, D. G. Reinertsen, Shortening the product development cycle. Research Technology Management, 35 (3), 1992, pp. 44-49 D. Southerton, Hyundai and Kia Motors The Early Years and Product Development, Don Southerton, 2012. S. Thirumalai, K. K. Sinha, Customization Strategies in Electronic Retailing: Implications of Customer Purchase Behavior. Decision Sciences, 40 (1), 2009, pp. 5-36 W. Ulaga, W. J. Reinartz, Hybrid Offerings: How Manufacturing Firms Combine Goods and Services Successfully. Journal of Marketing, 75 (6), 2011, pp. 5-23 R. Venkatesan, V. Kumar, A genetic algorithms approach to growth phase forecasting of wireless subscribers. International Journal of Forecasting, 18 (4), 2002, pp. 625-646 26
[71] [72]
[73]
[74] [75]
T. Wachtel, C. Hartford, J. Hughes, Building a balanced scorecard for a burn center. Burns, 25 (5), 1999, pp. 431-437 J. D. Wells, D. E. Campbell, J. S. Valacich, M. Featherman, The Effect of Perceived Novelty on the Adoption of Information Technology Innovations: A Risk/Reward Perspective. Decision Sciences, 41 (4), 2010, pp. 813-843 A. P. Wilper, S. Woolhandler, K. E. Lasser, D. McCormick, D. H. Bor, D. U. Himmelstein, Health insurance and mortality in US adults. American Journal of Public Health, 99 (12), 2009, pp. 2289-2295 C. Yang, S.-G. Lee, J. Lee, Entry barrier's difference between ICT and non-ICT industries. Industrial Management & Data Systems, 113 (3), 2013, pp. 461-480 J. G. York, S. Venkataraman, The entrepreneur–environment nexus: Uncertainty, innovation, and allocation. Journal of Business Venturing, 25 (5), 2010, pp. 449463
27