considered to be core concepts in the secondary school mathematics curriculum. They ... The NCTM Principles and Standards for School Mathematics state that.
INTERNATIONAL SURVEY OF HIGH SCHOOL STUDENTS’ UNDERSTANDING OF KEY CONCEPTS OF LINEARITY Carole Greenes, Kyung Yoon Chang and David Ben-Chaim Boston University, USA / Konkuk University, Korea / University of Hifa, Israel Developing students’ understanding of key concepts of linearity and their various representations is a major focus of first courses in algebra for secondary school students. Students’ difficulties with problems involving linearity on Massachusetts high stakes tests motivated an in-depth study of the nature and causes of these difficulties. The study population expanded to include more than 4000 students in Algebra I in the USA, Korea and Israel. A written test and clinical interviews were designed and administered to the population. Clinical interviews were conducted to gain greater insight into solution methods to selected test items. The study was an activity of the Focus on Mathematics project funded by the National Science Foundation (NSF/ EHR-0314692). INTRODUCTION Several attributes of a line, such as slope, y-intercept and equation of a line are considered to be core concepts in the secondary school mathematics curriculum. They are understood to have simple internal structure and they are taken to be the “foundations” out of which more complex concepts such as function are developed, or related to, as in the case of the relationship between the concepts of derivative and slope. The NCTM Principles and Standards for School Mathematics state that “Students should be able to use equations of the form y = mx + b to represent linear relationships, and they should know how the values of the slope (m) and the y-intercept (b) affect the line.” (NCTM, 2000, p.226-7). The study described here demonstrates that we are far from achieving this goal, not only in the U.S. but also internationally. MOTIVATION FOR THE STUDY Increasingly, school districts throughout the United States are calling for algebra for all secondary students (NCTM, 2000; National Mathematics Advisory Panel: Strengthening Math Education Through Research, 2006). Concomitant with the call are articles reporting huge student failure rates in Algebra I. This national problem was particularly noticeable in Massachusetts with secondary school students’ poor performance on linearity items on the Massachusetts Comprehensive Assessment System (MCAS) tests (Massachusetts DOE, 2000 – 2006). Identifying students’ difficulties with linearity concepts and skills and developing strategies for addressing those difficulties was the work of the Curriculum Review Committee (CRC), a committee of the Focus on Mathematics Project. In 2004, the CRC consisted of mathematics and mathematics education faculty from Boston University and mathematics curriculum coordinators from five school districts in the Boston 2007. In Woo, J. H., Lew, H. C., Park, K. S. & Seo, D. Y. (Eds.). Proceedings of the 31st Conference of the International Group for the Psychology of Mathematics Education, Vol. 2, pp. 273-280. Seoul: PME.
2-273
Greenes, Chang & Ben-Chaim metropolitan area. In 2005, the committee was joined by mathematics education faculty from Korea and Israel. To begin their work, the CRC “unpacked” each MCAS item dealing with linearity to identify the type of displays and formats that students had to interpret, and the mathematical concepts, skills and reasoning methods students were required to bring to bear to solve the problems. The CRC also speculated about reasons for students’ difficulties. To verify conjectures about the nature of student difficulties, the CRC designed, conducted and video-taped interviews of students solving selected MCAS problems and describing their thinking. Interviews were analysed and “real” difficulties were compared with the CRC’s speculations. The CRC was on target about 60% of the time; many student difficulties were totally unsuspected. To gain more information about the difficulties, the CRC developed a written assessment instrument as well as a clinical interview to probe students’ difficulties with selected items. TEST INSTRUMENTS To be successful with algebra, expectations are that students understand functions both as input/output rules and know how they are represented in graphs and tables; understand that linear functions are characterized by constant slope, and can plot graphs of linear functions given in the general ax + by = c form; can relate the slope of a linear function to the speed of an object represented in a time vs. distance graph; and understand the significance of the sign of the slope of a linear function in the previous context. It was this set of “understandings” that formed the basis for the design of the Mini-Assessment Test (MAT). The Mini-Assessment Test (MAT) consists of seven items that use the same formats (essay, short answer, and multiple-choice) as the MCAS tests. For each item In the MAT, scoring directions were developed to take note of specific types of errors. Essay Response (1 item): Given coordinates of a point and the equation of a line, students determine if the point is on the line and describe their decision-making process. (#1 in the test). Short Answer (3 Items): 1) Given an equation of a line with a negative slope, students create a table of values (coordinates) of points on the line. (#2 in the test). 2) Given a graph of a line, students identify the slope of the line. (#4 in the test). 3) Given a distance-time graph, students identify the part (one of three) of the graph that represents the car moving slowest (PartA).; the slope of another part of the graph (Part B).; and the car’s speed in that other part of the graph (Part C). (#7 in the test). Multiple-Choice (3 Items): 1) Given a table of (x, y) values representing points on a line, students identify one of four graphs that contains all points. (#3 in the test). 2) Given a table of values showing a relationship between number of weeks and number of cars sold, students identify one of four linear equations that represents the relationship. (#5 in the test). 3) Given a linear equation that is not in slope-intercept
2-274
PME31―2007
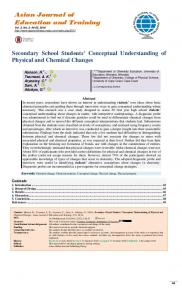
Greenes, Chang & Ben-Chaim form, students identify one of the five possibilities for the value of the y-intercept. (#6 in the test). SUBJECTS In the US, one week after students completed the MCAS tests in May, 2005, classroom teachers in the five districts administered the MAT to 752 Grade 8 students and scored the tests. In Korea, 405 Grade 8 students from five schools in Seoul similar in socio-economic status to the US schools took the Korean version of the MAT in October 2005. In Israel, since linearity is introduced to Grade 9 students, 575 Grade 9 students from seven representative schools took the Israeli version of the MAT in April 2006. RESULTS FROM 3 COUNTRIES Since the test conditions and the grade levels of the subjects were not equivalent across countries, data were analysed to identify trends. The results of % correct by country are shown in Figure 1.
%Correct
100 80 60 40 20 0 1A 1A 1 Problem #
1B 1 B2
23
34
4 5
계열1 US Grade8
56
6 7
7A 7A 8
계열3 Korea Grade 8
7B 7 B9
7C 7 C10
Israel Grade 9 계열5
Figure 1: FOM Algebra Test Results - % Correct Findings revealed that across the three countries, students have minimal understanding of two major topics: points on a line and slope. With regard to points on a line, many students didn’t know or weren’t sure that: 1) coordinates of points on a graph of a line satisfy the equation of the line, and 2) coordinates of points on a line that are presented in tabular form satisfy the equation for the line, and when plotted, produce a graph of the line. In a study conducted by Schoenfeld, Smith and Arcavi (1993) similar results were found. They asserted that this misunderstanding is caused by the absence of what they called the “Cartesian Connection.” With regard to slope, students in all countries demonstrated maximum difficulty determining if lines shown in the coordinate plane have positive or negative slopes. Particular difficulty was noted when lines with positive slopes were pictured in the PME31―2007
2-275
Greenes, Chang & Ben-Chaim third quadrant of the coordinate plane. As can be seen in what follow, in many cases the difficulties encountered by the students are in accord with Acuna’s (2001) claim that the visual information in the graph is an important part of graph comprehension. The students use their own “gestalt” relation that takes place on the visual identification level despite previous training or knowledge of the definition of slope. Another misconception demonstrated by the students is in line with Schoenfeld et al’s (1993) claim that “students can treat the algebraic and graphical representational domains as though they are essentially independent.” In the remainder of this paper, discussion will focus on the concept of slope. Difficulties with the concept of slope Many students had difficulty identifying slopes of lines from graphs of the lines (Problem 4 and 7B) and recognizing the relationship between slope and speed in a time versus distance graph in Problem 7, parts A and C. From our qualitative analysis and comparison of subjects’ incorrect answers to the two problems, several error patterns were revealed: •
•
•
• •
•
2-276
Some students did not attend to the direction of the x value change. For example, students counted the y value change from the point on the Y axis, and identified a negative slope (-3/1) in Problem 3 and a positive slope ( 90/3=30 (90 is wrong)) in Problem 7B. (See Figure 2) Students did not notice the relation between the direction of a line and the sign of its slope and only considered the changes of x and y values. They presented positive and negative slopes for lines slanting in the same direction, seemingly unconcerned with this inconsistency. As shown in Figure 3, one student produced a table of values and calculated the y difference as 3 and gave the answer as -3. Students’ calculations were often based on their visual judgement. For example, as shown in Figures 2 and 3, students used the estimated coordinate (1, 30) instead of the correct lattice point (3, 120) to calculate the slope of R in Problem 7B, and gave an answer of 30. Students did not take into consideration the scale factor on the Y axis (each unit represented 30 miles) in calculating slope. Many students answered 4/3 to Problem 7B instead of 4 x 30, or 120/3) as shown in Figure 4 From different results and different solution processes for Problem 7B and 7C, it is clear that many students did not realize the relationship between slope and speed in the distance-time graph. (See Figures 2, 3, and 4). Some students confused linearity with proportionality. For example, S4 wrote “Since the slope is (increment of y) /(increment of x), and x value and y value of point A are -3 and -5 respectively, the slope is 5/3.” The student presented the correct answer for Problem 7B: “In this graph, slope is speed, and speed is (distance)/(time). Therefore 120/3=40.” (Figure 5)
PME31―2007
Greenes, Chang & Ben-Chaim
Figure 2: Student’s Response-S1 to Problems # 4 and # 7B
Figure 3: Student’s Response-S2 to problems # 4 and # 7B
PME31―2007
2-277
Greenes, Chang & Ben-Chaim
Figure 4: Student’s Sample Response-S3 to Problem # 4 and #7B
Figure 5: Student’s Sample Response-S4 to Problem # 4 and #7B To validate suspicions about the nature of the errors on the test, the CRC conducted taped interviews of grade 8 students solving selected MAT problems; one to determine the slope of a line from its graph and the other to interpret slope in an application problem. The difficulties cited above were confirmed in the interviews. 2-278
PME31―2007
Greenes, Chang & Ben-Chaim The CRC next approached the problem of identifying factors that might be contributing to student difficulties, including problem format, the grade level of the students, and the type of instructional program. For example, in the original problem #4, no grid lines were shown, and although the axes had hash marks, the scales were not indicated. The CRC believed that the lack of grid lines and the unmarked axes presented a new situation for the students, one for which they were unprepared. To check out this hypothesis, three forms of that problem were developed and administered to 1000 grade 8 students. One of the forms was the original presentation of the problem, a second showed grid lines, and a third showed grid lines and scales on the axes. Scores were analyzed and no significant difference by format was found. Similar results of no significant difference were obtained for the factors of grade level and instructional program. Aptitude-Treatment Interactions (ATI) With regard to slope, two kinds of Aptitude-Treatment Interactions (ATI) were revealed among groups: 1) In Problem 4 and Problem 7B and 2) in Problem 7B and 7C. One type of ATI was in difficulty identifying slopes of lines in Problem 4 and in Problem 7B: 1) US students showed the same levels of difficulty with Problem 4 as with Problem 7B, 2) Korean students showed greater difficulty with Problem 4, and 3) Israeli students showed had greater difficulty with Problem 7B. 100
% Correct
80
US Grade 8 계열1 Korea 계열4 Grade 8 Israel Grade 9 계열7
75.3 68.4 65.9
60
58.6
58.3
43.5
40
33.8
49.9
48.3
40
39.5
32
20
0 1 Problem# 4
7A2
7B3
7C
4
Figure 6: FOM Results on Problem 4, 7A, 7B, and 7C As can be seen in Figure 6, additional ATI were shown in difficulty calculating slope and speed from the distance-time graph: 1) US and Israeli students showed greater difficulty with calculating slope in Problem 7B than with calculating the speed of a car from the distance-time graph in Problem 7C, but 2) Korean students showed greater
PME31―2007
2-279
Greenes, Chang & Ben-Chaim difficulty calculating the speed of a car from the distance-time graph (Problem 7C) than with calculating the slope of a line (Problem 7B). ATI might reflect the curriculum and instructional program for linearity in each country, as well as the methods and sequences of introducing linearity and the extent of connecting concepts to their applications. CONCLUSION Our results are in agreement with the assertion of Schoenfeld et al (1993) “that some aspects of the domain that we take to be trivial are major stumbling blocks for students”. Knowing what the underlying skills and perspectives actually are, has implications for mathematics curricula and can serve as a guide to developing curricula. In fact, the CRC has started this year to look at the elementary school mathematics curriculum with the intent of inserting introductory material that will enhance students’ understanding of the important key concepts of linearity. Another recommendation is related to strategies used to teach those concepts. To enable students to build deep and meaningful understanding of the key concepts of linearity, it is recommended that teachers use the spiral method and devote much more time to teaching and systematically reviewing concepts of slope, y-intercept and the connection between the algebraic and graphical representation of a line. ACKNOWLEDGMENTS The authors thank the teachers and students who participated in the study and the members of the CRC. They are Kathleen Bodie, Donna Chevaire, Charles Garabedian, Ann Halteman, Eileen Herlihy, Steve Rosenberg, Dan Wulf, and Kevin Wynn. REFERENCES Acuna, C. (2002). High school students’ identification of equal slope and Y-intercept in different straight lines. In A.D. Cockburn and E. Nardi (Eds.), Proceedings of the 26th Annual Conference of the International Group for the Psychology of Mathematics Education. (Vol. 2, pp. 2-8). Norwich, UK: PME. Massachusetts Department of Education (2000, 2001, 2002, 2003, 2004, 2005, 2006). Massachusetts comprehensive assessment system: Grades 8, 9 and 10. Malden, MA: State Department of Education. www.doe.mass.edu/mcas National Council of Teachers of Mathematics (NCTM). (1989). Curriculum and Evaluation Standards for School Mathematics. Reston, VA: NCTM. National Council of Teachers of Mathematics (NCTM). (2000). Principles and Standards for School Mathematics. Reston, VA: NCTM. National Mathematics Advisory Panel: Strengthening Math Education Through Research (December, 2006). http://www.ed.gov/about/bdscomm/list/mathpanel/factsheet.pdf Schoenfeld, A. H., Smith, J. P., & Arcavi, A. (1993). Learning: The microgenetic analysis of one student’s evolving understanding of a complex subject matter domain. In R. Glaser (ed.) Advances in Instructional Psychology. (Vol. 4, pp. 55-175). Hillsdale, NJ: Erlbaum.
2-280
PME31―2007