Sep 18, 2011 - 1Osama Z. Al-Hamdan, Fred B. Pierson, and Christopher J. Williams, ... USA; 2Osama Z. Al-Hamdan, Christopher J. Williams, and Jan Boll,.
This is not a peer-reviewed article International Symposium on Erosion and Landscape Evolution CD-Rom Proceedings of the 18-21 September 2011 Conference (Hilton Anchorage, Anchorage Alaska) Publication date, 18 September 2011 ASABE Publication Number 711P0311cd
SHEAR STRESS PARTITIONING OF OVERLAND FLOW ON DISTURBED AND UNDISTURBED RANGELANDS O.Z. Al-Hamdan1,2, F.B. Pierson 1, M.A. Nearing3, J.J. Stone3, C.J. Williams1,2, P.R. Kormos4, J. Boll2, M.A. Weltz5 ISELE Paper Number 11134
Presented at the
International Symposium on Erosion and Landscape Evolution Hilton Anchorage Hotel, Anchorage, Alaska September 18-21, 2011
A Specialty Conference of the
American Society of Agricultural and Biological Engineers Held in conjunction with the Annual Meeting of the
Association of Environmental & Engineering Geologists September 19-24, 2011
1
Osama Z. Al-Hamdan, Fred B. Pierson, and Christopher J. Williams, USDA-Agricultural Research Service, Northwest Watershed Research Center, Boise, Idaho 83712, USA; 2Osama Z. Al-Hamdan, Christopher J. Williams, and Jan Boll, Department of Biological and Agricultural Engineering, University of Idaho, Moscow, Idaho 83844, USA; 3Mark A. Nearing and Jeffry J. Stone, USDA-Agricultural Research Service, Southwest Watershed Research Center, Tucson, Arizona 85719, USA; 4Patrick R. Kormos, Department of Geosciences, Boise State University, Boise, Idaho 83725, USA; and 5Mark A. Weltz, USDA-Agricultural Research Service, Exotic and Invasive Weeds Research Unit, Reno, Nevada 89512, USA.
SHEAR STRESS PARTITIONING OF OVERLAND FLOW ON DISTURBED AND UNDISTURBED RANGELANDS O.Z. Al-Hamdan1,2, F.B. Pierson 1, M.A. Nearing3, J.J. Stone3, C.J. Williams1,2, P.R. Kormos4, J. Boll2, M.A. Weltz5
ABSTRACT Physically-based hillslope erosion models commonly estimate soil detachment and transport capacity based on overland flow shear stress applied to soil aggregates. However, vegetation and rock cover counteract the shear stress of overland flow where they occur. Accordingly, partitioning of total shear stress into components exerted on soil, vegetation, and rock cover is a key element for the erosion models. The objective of this study is to estimate the components of shear stress of overland flow on disturbed and undisturbed rangelands using field experimental data. In addition, this study investigates the vegetation cover limit at which the soil shear stress component is substantially reduced, limiting the erosion rate. The soil shear stress component was estimated based on the assumption that the ratio of soil shear stress to the total shear stress is equal to the ratio of hydraulic friction factor of soil to the friction factor of the composite surface. The total friction factor of the composite surface was estimated using empirical equations developed based on field experimental data over diverse rangeland landscapes within the Great Basin Region, United States. This equation logarithmically correlates the composite surface friction to the vegetation cover (plant base and plant litter) and rock cover components. Moreover, the hydraulic friction factor of each cover element was estimated based on its parameter in that equation. The soil hydraulic friction portion was assumed to be the logarithmic difference between the total friction and the friction of the cover elements. The result of this assumption was used to develop empirical equations that predict the ratio of soil shear stress to the total shear stress of concentrated flow and sheet flow in terms of bare soil fraction of total area. The predicting equation of total friction factor was improved by adding the slope and the flow discharge variables. The predicting equations of soil shear stress as a function of bare soil fraction did not change significantly when changing the assumption of a rectangular shape of cross section to a parabolic shape. The developed shear stress partitioning equations in this study are applicable across a wide span of ecological sites, soils, slopes, and vegetation and ground cover conditions and can be used by physically-based rangeland hydrology and erosion models. The results from the developed equations show that shear stress exerted on soil grains is significantly higher when bare soil exceeds 60% of the total surface area, while reduced significantly when bare soil area is less than 25% or when the plant base cover exceeds 20%. These percentages could be used as relative measures of hydrologic recovery for disturbed rangelands or triggers that indicate that a site is crossing a threshold where soil erosion might accelerate due to the high soil shear stress. KEYWORDS. Overland flow, Shear stress partitioning, Fire impact, Soil erosion, Rangeland.
1
Osama Z. Al-Hamdan, Fred B. Pierson, and Christopher J. Williams, USDA-Agricultural Research Service, Northwest Watershed Research Center, Boise, Idaho 83712, USA; 2Osama Z. Al-Hamdan, Christopher J. Williams, and Jan Boll, Department of Biological and Agricultural Engineering, University of Idaho, Moscow, Idaho 83844, USA; 3Mark A. Nearing and Jeffry J. Stone, USDA-Agricultural Research Service, Southwest Watershed Research Center, Tucson, Arizona 85719, USA; 4Patrick R. Kormos, Department of Geosciences, Boise State University, Boise, Idaho 83725, USA; and 5Mark A. Weltz, USDA-Agricultural Research Service, Exotic and Invasive Weeds Research Unit, Reno, Nevada 89512, USA.
INTRODUCTION Physically-based erosion models use hydraulic variables such as shear stress and stream power to predict soil detachment rates. Total shear stress is a function of the shear stress applied to a surface and the counteracting shear stress associated with surface hydraulic roughness features. Soil aggregates (grains) and surface topography (form roughness) dictate overall hydraulic roughness on bare soil areas, whereas rock, vegetation cover, and ground cover are the primary roughness elements influencing total shear stress where they occur. In most physically-based models only overland flow shear stress exerted on soil grains is used to estimate soil detachment rate and sediment transport capacity. Hence, further partitioning of total shear stress into components exerted on vegetation, ground cover, and rock is a key element for advancing erosion predictive technologies. Multiple approaches have been reported in literature that separate the effective shear stress exerted on soil grains from the total shear stress (see (Giménez and Govers, 2008)). Foster (1982) estimated the soil shear stress component based on the assumption that the ratio of soil shear stress to total shear stress is equal to the ratio of soil hydraulic friction factor to the friction factor of the composite surface: (1) where is the shear stress exerted on soil grains (N m-2), and are the Darcy-Weisbach hydraulic is the friction factor of soil and hydraulic friction factor of the composite surface respectively, and -2 total shear stress (N m ). The term is calculated at steady state conditions as: (2) where is the specific weight of water (N m-3), is the hydraulic radius of the flow (m) and is the slope (decimal). This method is based on the idea that the grain friction factor is independent of the presence of form shear stress and thus the total hydraulic resistance can be divided into that which occurs because of the soil grains and that which occurs because of form roughness (Einstein and Banks, 1950). A second method uses the measured mean velocity of the flow to estimate the corresponding hydraulic radius on a plane bed, which is then used to calculate the grain shear stress (Laursen, 1958; Foster et al., 1980, 1982): (3) where
is the effective hydraulic radius due to soil. Foster et al. (1982) used Manning’s equation to
calculate the
as: (4)
where
is flow velocity (m s-1), and
is Manning’s n of plane bed.
Raupach (1992) proposed using drag force partitioning theory to predict shear stress portions. Even though originally developed to deal with wind shear stress, Thompson et al. (2004) showed that Raupach’s method is applicable to runoff shear stress by
2
(5) is the soil particle drag coefficient, is the drag coefficient for a single vegetal element, and where is the roughness density which is related to number and size of vegetal elements per surface area. Foster’s (1982) approach has been commonly applied in physically-based erosion models such as WEPP (Nearing et al., 1989) and CREAMS/GLEAMS (Foster et al., 1980) were friction factor is accounted separately for the different effects of cover. In order to apply this method, the friction factor must be partitioned by surface elements. Several methods have been developed for partitioning of friction factor (e.g. Weltz et al., 1992; Gilley and Weltz, 1995; Hu and Abrahams, 2006; Li, 2009) but most of these approaches are difficult to implement in existing field-scale erosion models due to their high computational and input demands. The objectives of this study are: 1) to estimate the components of overland flow shear stress on disturbed and undisturbed rangelands by applying the Darcy-Weisbach friction partitioning method to field collected experimental data, and 2) to investigate the vegetation cover limit at which the soil shear stress component is substantially reduced, limiting the erosion rate.
MATERIALS AND METHODS Study sites The data used in this study were obtained from rangeland field experimental work by the USDA-ARS Northwest Watershed Research Center, Boise, Idaho. The work established hundreds of experimental plots. The data were collected from rangeland sites within the Great Basin Region, United States, and span a wide range of slope angles (5.6%-65.8%), soil types, and vegetative cover (Table 1). Many of the sites exhibit some degree of disturbance, such as tree encroachment, wildfire, prescribed fire, tree mastication, and/or tree cutting (See Table 1). Numerous rectangular plots (approximately 4 m long by 2 m wide) were selected at each site, encompassing all treatments for the respective site. Average slope, canopy and ground cover, and micro-topography were measured for each plot (see Pierson et al., 2007, 2009). Measurement and calculation of hydraulic parameters Overland flow was simulated on each experimental plot for a range of flow rates over near saturated surface soil conditions. Surface soils were pre-wet by artificial rainfall immediately prior to overland flow simulation (Pierson et al., 2007, 2009). Overland flow was released from a concentrated source centered 4 m upslope of the plot discharge outlet (see Pierson et al. 2007, 2009). Each inflow rate was applied for 12 min using a flow regulator. Except for Breaks 2004, in the early experiments (before 2006), the applied inflow rates were 3, 7, 12, 15, 21, 24 (L min-1), while they were 15, 30, 45 (L min-1) in the later experiments. The plot flow velocity (V) for each inflow rate was measured using a salt tracing method. A concentrated salt solution (CaCl2) was released into the fastest (as determined by visual tracer) flow path. The mean travel time of the salt solution between rill cross-sections at transects 1 and 3 m downslope of the release point was monitored instantaneously with conductivity probes. Flow velocity was calculated as the distance between conductivity probes (2 m) divided by the mean travel time of the salt solution between the 1 and 3 m transects. The width and depth of each flow path for each rate were measured at cross section transects located 1 and 3 m downslope of the flow release. Each flow path cross section was assumed to be rectangular. Multiple depth measurements were taken for each cross section where the depth was calculated as the average of these
3
measurements. The average width, depth, and hydraulic radius (Rh) of each flow path for each inflow rate was then calculated as the average of means from each cross section. Where R h was calculated as: (6) where A is the cross-sectional area (m2) and Pwet is the wetted perimeter (m). In the rectangular cross section case, Rh was calculated as: (7) where w, d are the average width and the average depth of each flow path respectively (m). Table 1. Land management treatments, dominant plant community, and soil type descriptions for rangeland field sites in this study. Site
State
Treatment
Landscape
Soil type
Denio
NV
Burned, Untreated
Sagebrush Steppe
sandy loam
Breaks
ID
Burned, Untreated
Sagebrush Steppe
course sandy loam
Steens
OR
Cut, Uncut
Western Juniper
silt loam
Onaqui
UT
Burned, Tree mastication, Cut, Untreated
Sagebrush Steppe Utah Juniper
gravely loam
Marking Corral
NV
Burned, Cut Untreated
Pinyon-Juniper Sagebrush Steppe
gravelly loam
Castlehead
ID
Burned, Cut, Untreated
Western Juniper Sagebrush Steppe
stony loam
Upper Sheep
ID
Burned, Untreated
Sagebrush Steppe
silt or silt loam
Experimental runs resulted in two runoff categories, concentrated flow runs and sheet flow runs. Concentrated flow paths were separated from sheet flow by comparing the hydraulic radius to the flow depth for the respective flow path. If the flow path was too shallow, the depth of the flow would be negligible with respect to the width (w). In this case the denominator in Equation (7) will be approximately equal to w and Rh is approximately equal to d. In our data, if Rh and d were significantly different (d is 5% higher than Rh or more) then the flow path was considered as concentrated flow. In some cases the flow would be concentrated at the top of the plot due to scouring at the inflow release point and then start to disperse downhill changing to sheet flow. In order to avoid considering such cases as concentrated flow or sheet flow, the criterion was applied on each path at transects 1 and 3 m from the top of the plot. In experimental runs that formed concentrated flow paths and sheet flow paths at the same time, the case was considered as concentrated flow only if the flow path that has the largest hydraulic radius was concentrated. After categorizing the experimental runs into concentrated flow runs and sheet flow runs, the hydraulic parameters were calculated using the calculated depth of the cross section from the measured flow discharge (Q), V, and w instead of the field measured depth. The overland flow discharge for each experimental run was calculated as the average of the inflow rate and the outflow rate of a plot. While the inflow rate was controlled and measured by the flow regulator, the outflow discharge rate was derived from timed runoff samples which were collected in bottles or buckets at the exit of the plot (see Pierson et al., 2007, 2009). The outflow discharge rate was calculated as sample volume divided by the collection time. For each experimental run, several timed runoff samples were collected and the average runoff value was calculated. In order to find the flow discharge in the flow path that corresponded to the measured velocity, the total overland flow discharge was distributed to the flow paths based on their hydraulic radius. Manning’s equation was used for 4
calculating the conveyance factor (K) for each component and then the total flow rate was distributed proportionally to each channel component based on its K value. For instance, an individual flow path with twice the conveyance factor as a second flow path would have twice the share of the collective flow. Finally the hydraulic parameters were also calculated assuming parabolic cross sections. The hydraulic radius was calculated using the calculated maximum depth of the cross section from the measured Q, V, and w instead of the field measured maximum depth. To calculate the soil shear stress we followed Foster’s (1982) method of partitioning the friction factor by combining Eq. (1) and Eq. (2): (8) The total friction factor ) was obtained from empirical equations developed by regressing the measured total friction against measured vegetation and rock cover, slope, and flow rate (see AlHamdan et al., in review). In order to estimate the friction factor of soil grains, the vegetation cover term was assumed as the friction contribution to the total friction factor. The intercept in the equation was assumed to be the friction factor due to soil grains, while flow discharge and slope terms were assumed effective in tracking the temporal and spatial variability of total hydraulic roughness given the temporal variability of flow discharge and the spatial variability of slope were available.
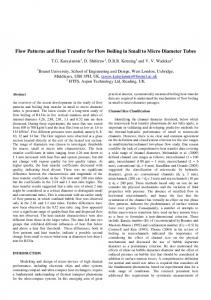
RESULTS AND DISCUSSION Hydraulic friction equations Total hydraulic friction was negatively correlated with flow discharge and the percentage of bare ground and was positively correlated with the presence of vegetation cover and slope. The flow discharge and slope in the total friction equation improved the prediction of the total friction and thus improved the prediction of the proportion of the assumed soil friction to total friction (Table 2). Equations that were developed from concentrated flow data have significantly different coefficient values than from those obtained from sheet flow data (Table 2). Adding the slope and flow discharge variables to the regression improved the prediction of the equations for both concentrated and sheet flow where the coefficient of determination increased (R2) from 0.41 in Equation (9) to 0.56 in Equation (11) and from 0.46 in Equation (12) to 0.54 in Equation (14). Shear stress partitioning equations Equations (9)-(14) were used to develop empirical equations that predict the ratio of soil shear stress to the total shear stress ( ) of concentrated flow and sheet flow in terms of percent bare soil area. Figure (1) shows the developed equations for concentrated flow. As can be seen in Figure (1), adding the slope and flow discharge in Equations (11) slightly changes the estimated values of shear stress portion exerted on soil grains from Equations (9). In addition, the results show that the assumption of the shape of cross section did not have significant influence in the resultant equation.
5
Table 2. Empirical functions for predicting ft and their corresponding assumed fs obtained from concentrated flow and sheet flow data. Flow
ft
Equation Number
fs
(9) Concentrated
(10)
(N=394) (11) (12) Sheet
(13)
(N=178)
(14) where res, bascry, and rock are the fractions of litter cover, basal plant and cryptogam cover, and rock cover to the total ground cover respectively,
is the slope, and
is the flow discharge (m3 S-1).
Figure 1. Empirical equations that predict the ratio of soil shear stress to the total shear stress (τs/τt ) of concentrated flow as a function of bare soil fraction of total area.
Figure (2) shows the total shear stress and soil shear stress portion as a function of bare soil using Equation (9). Shear stress exerted on soil grains estimated by the developed equations was significantly high when bare soil percentage exceeds 60% and was significantly small when bare soil is less than 25%. The same trend is evident in Figure (3) where soil shear stress as an average was relatively small, regardless the total shear stress value, when the basal plant cover exceeds 20%. These percentages could be used as relative targets in restoration of disturbed rangelands. The bare ground and basal cover targets on burned sites in this study were reached two seasons post-fire. 6
Figure 2. Total shear stress and soil shear stress as a function of bare soil using Equation (9).
Figure 3. Total shear stress and soil shear stress as a function of basal plant using Equation (9).
CONCLUSION In this study, the soil shear stress component was estimated based on the assumption that the ratio of soil shear stress to the total shear stress is equal to the ratio of hydraulic friction factor of soil to the friction factor of the composite surface. The total hydraulic friction factor was obtained from empirical equations developed by regressing the measured total friction against measured vegetation and rock cover, slope, and flow rate. The hydraulic friction factor of each cover element was estimated based on its parameter in that equation. Empirical equations that predict the ratio of soil shear stress to the total shear stress in terms of bare soil area were developed. The assumption of the shape of cross section did not significantly influence the resultant equations. The equations are applicable across a wide span of ecological sites, soils, slopes, and vegetation and ground cover conditions and can be used by physically-based rangeland hydrology and erosion models. This study shows that the shear stress exerted on soil grains estimated by those developed equations is significantly lesser when bare soil is less than 25% and is significantly greater when bare soil exceeds 60% of the total surface area or when the plant basal cover is less than 20%. These percentages could be used as relative measures of hydrologic recovery for disturbed rangelands or triggers that indicate that a site is crossing a threshold where soil erosion might accelerate due to the high soil shear stress. Acknowledgements This research was funded in part by the USDA NRCS/ARS Conservation Effects Assessment Project (CEAP) and the US Joint Fire Sciences program. This is Contribution Number 62 of the Sagebrush Steppe Treatment Evaluation Project (SageSTEP), funded by the U.S. Joint Fire Science Program. 7
REFERENCES 1.
Al-Hamdan, O. Z., F. B. Pierson, M. A. Nearing, J. J. Stone, C. J. Williams, C. A. Moffet, P. R. Kormos, J. Boll, and M. A. Weltz. In review. Characteristics of concentrated flow hydraulics for rangeland ecosystems: Implications for hydrologic modeling, Earth Surf. Proc. Land.
2.
Einstein, H. A., and R. B. Banks. 1950. Fluid resistance of composite roughness. Eos Trans. AGU 31: 603–610.
3.
Foster, G. R. 1982. Modeling the erosion process. In Hydrologic Modeling of Small Watersheds, 295-382. C. T. Haan, H. P. Johnson., and D. L. Brakensiek, eds. ASAE Monograph No. 5. St. Joseph, Mich: ASAE.
4.
Foster, G. R., L. J. Lane, J. D. Nowlin, J. M. Laflen, and R. A. Young. 1980. A model to estimate sediment yield from field sized areas: development of model, CREAMS — A Field Scale Model for Chemicals, Runoff, and Erosion from Agricultural Management Systems. Vol. I: Model Documentation. Conservation Research Report No. 26. USDA-Science and Education Administration: 36–64.
5.
Foster, G. R., C. B. Johnson, and W. C. Moldenhauer. 1982 Hydraulics of failure of unanchored cornstalk and wheat straw mulches for erosion control. Trans. ASAE 25(4): 940–947.
6.
Gilley, J. E., and M. A. Weltz. 1995. Hydraulics of overland flow. In USDA-Water Erosion Prediction project: Hillslope profile and watershed model documentation. D.C. Flanagan and M. A. Nearing, eds. NSERL Report No. 10. West Lafayette, Ind: USDA-ARS National Soil Erosion Research Lab.
7.
Giménez, R., and G. Govers. 2008. Effects of freshly incorporated straw residue on rill erosion and hydraulics. Catena 72(2): 214–223, DOI:10.1016/j.catena.2007.05.004
8.
Hu, S. X., and A. D. Abrahams. 2006. Partitioning resistance to overland flow on rough mobile beds. Earth Surf. Proc. Land. 31: 1280–1291.
9.
Laursen, E. M. 1958. The total sediment load of streams. Proc. ASCE, J. Hydraul. Div. 84: 15301-6.
10. Li, G. 2009. Preliminary study of the interference of surface objects and rainfall in overland flow resistance. Catena 78: 154–158. 11. Nearing, M. A., G. R. Foster, L. J. Lane, and S. C. Finkner. 1989. A process‐based soil erosion model for USDA Water Erosion Prediction Project technology. Trans. ASAE 32(5): 1587‐1593. 12. Pierson, F. B., J. D. Bates, T. J. Svejcar, and S. P. Hardegree. 2007. Runoff and erosion after cutting western juniper. Rangeland Ecol.Mgmt. 60: 285-292. 13. Pierson, F. B., C. A. Moffet, C. J. Williams, S. P. Hardegree, and P. E. Clark. 2009. Prescribed-fire effects on rill and interrill runoff and erosion in a mountainous sagebrush landscape. Earth Surf. Proc. Land. 34: 193-203. 14. Raupach, M. R. 1992. Drag and drag partition on rough surfaces. Boundary−Layer Meteorol. 60(4): 375−395. 15. Thompson, A. M., B. N. Wilson, and B. J. Hansen. 2004, Shear stress partitioning for idealized vegetated surfaces. Trans. ASAE 47 (3): 701–709. 16. Weltz, M. A., A. B. Awadis, and L. J. Lane. 1992. Hydraulic roughness coefficients for native rangelands. J. Irrig. Drain. Engrg., ASCE 118(5): 776–790. 8