Intervention in Agricultural Systems that Provide Positive Environmental Externalities: an Evaluation of Alternative Instruments Ignacio Atance e-mail:
[email protected]
Isabel Bardají e-mail:
[email protected]
Carlos Tio e-mail:
[email protected]
Paper prepared for presentation at the Xth EAAE Congress ‘Exploring Diversity in the European Agri -Food System’, Zaragoza (Spain), 28-31 August 2002
Copyright 2002 by Ignacio Atance, Isabel Bardají,and Carlos Tio. All rights reserved. Readers may make verbatim copies of this document for non-commercia l purposes by any means, provided that this copyright notice appears on all such copies.
INTERVENTION IN AGRICULTURAL SYSTEMS THAT PROVIDE POSITIVE ENVIRONMENTAL EXTERNALITIES: AN EVALUATION OF ALTERNATIVE INSTRUMENTS Ignacio Atance (
[email protected]) Agricultural Economics Department, E.T.S.II.AA, Universidad de Valladolid, Spain Avda. Madrid, 57. 34071 Palencia. Spain Isabel Bardají (
[email protected]); Carlos Tió (
[email protected]) Agricultural Economics Department, Universidad Politécnica de Madrid, Spain Avda. Complutense, s/n. 28040 Madrid. Spain ABSTRACT The Common Agricultural Policy (CAP) intervenes in most agricultural systems that provide positive environmental externalities using both direct payments and agrienvironmental schemes. In this context, the objective of this paper is to compare the efficiency of the current intervention system versus intervening using agri-environmental payments as a sole instrument. The cereal steppes agroecosystem of Tierra de Campos (Valladolid, Spain) has been selected to develop this comparison. A farm survey and a Positive Mathematical Programming Model have been combined to provide results of both alternative instruments. The farm survey was used to ask the farmers their payments demands to participate in the alternative instrument, supplying also qualitative information about how it is perceived by farmers. The payments demanded were simulated in the model to get environmental and economic indicators for both instruments. Instruments were evaluated using a cost-effectiveness approach were total public expenditure was conserved constant for both. The main conclusion of this research is that policy intervention effectiveness could be potentially increased using an agri-environmental scheme as the unique intervention instrument. Considering this finding, results transferability to other agricultural systems and policy consequences in the context of the CAP are finally discussed. KEYWORDS: CAP, agri-environmental schemes, policy instruments evaluation, farm surveys, Positive Mathematical Programming, cereal steppes. 1. INTRODUCTION Presently, agricultural systems that provide positive environmental externalities receive a “double treatment” under Common Agricultural Policy (CAP). Firstly, they are intervened through direct payments, according to their production. Secondly, most of these agroecosystems are object of specific agri-environmental schemes, thus receiving a treatment linked to the territory. Although these schemes can be implemented using a large range of instruments (Colman et al., 1992; Lactacz-Lohmann, 1998), finally they represent an incentive related more with the way of farming and not just with production.
1
In this context, the objective of this paper is to compare the efficiency of the current intervention system versus intervening using agri-environmental payments as a sole instrument. In recent years, several studies have measured the efficiency of agrienvironmental schemes (Whitby and Saunders, 1996; Hanley et al., 1999; Schramek et al., 1999; Van Huylenbroeck and Whitby, 1999). Although depending of the different schemes evaluated, there has arisen a common agreement about the capacity of these schemes to improve agri-environmental amenities provision respect to the unique use of CAP direct payments (Willis et al., 1995; Winter and Gaskell, 1998; Oltmer et al., 2000). However, it has been scarcely investigated the capacity of these instruments to improve efficiency in policy intervention if they are used alone. In this contest, only qualitative studies have been conducted (Potter et al., 1998). The pressures for further reforms in the CAP, specially oriented towards targeting the support to public goods provision, represents a first reason to evaluate these two alternative policy instruments. World Trade Organisation (WTO) negotiations, EU enlargement and internal legitimisation of CAP contribute deeply to the need of searching efficiency and effectiveness in the policy adopted. Agricultural multifunctionality would constitute a second motivation for this study. After the Agenda 2000 reform, multifunctionality has become a main objective and a basic justification of CAP. From a political analysis perspective, multifunctionality implies recognising that public intervention should aim at correcting market failures provoked by the existence of public goods that are positive externalities generated in agricultural production processes. Direct payments have proved to be useless to correct these failures, requiring the use of agri-environmental schemes where those externalities have an environmental nature. As far as CAP abandons its traditional production objectives and aims just at securing a correct provision of public goods, we find it necessary to study better the capacity of agri-environemental schemes of being used alone. Finally, it becomes quite convenient to study alternative intervention instruments once we see the problems derived from the simultaneous use of direct and agri-environmental payments. These problems had been detected both in terms of global efficiency and the opportunity cost that direct payments imply for the agri-environmental schemes (Brouwer and Lowe, 1998). To present this research, considerations about the efficiency of the current CAP to address market failures related with positive environmental externalities are made in the next section. Section three describes the case study area selected to develop this evaluation of policy instruments. This is the cereal steppes agroecosystem of Tierra de Campos (Valladolid, Spain). Policy scenarios considered and the methodology applied are presented in sections four and five. Section six shows the main results obtained, while the final section proposes some conclusions and a further discussion of the results, with a special emphasis in the transferability of these results and conclusions to other agricultural systems.
2
2. AGRICULTURAL POLICY CONSIDERATIONS Measures included under the different Common Markets Organisations (CMOs) are still the main political instruments affecting agroecosystems, both in terms of budgetary and territorial dimensions (Brouwer and Lowe, 1998). Farmers in agricultural systems that provide positive environmental externalities receive, first of all, the incentive of the CAP direct payments, according to their kind of production (crops rotation, livestock orientation) and its level (number of hectares, livestock units, reference yields assigned). This intervention has represented in some cases a tendency to intensify the production system (Hellegers and Godelschalk, 1998), but has also been a support to the maintenance of these systems, generally characterised by a low profitability (Baldock et al., 1996; Bardají et al., 2001). A large proportion of these systems is intervened using also agri-environmental schemes. In some cases these schemes have tried to counteract the intensification risk mentioned. In other, the agri-environmental aids have been required because direct payments were insufficient to secure agroecosystems maintenance or at least were insufficient to secure an adequate provision of the environmental amenities provided by these systems. Taking into account that simplification was one of the objectives of Agenda 2000 (European Commission, 1999a), the need of co-existence of these simultaneous use of both instruments should be questioned. In addition, several studies have found for some of these systems that direct payments are not only insufficient to reach social optima1, but displace the equilibrium toward a lower level of environmental quality through system intensification. This fact enhances the priority for looking at the policy intervention in terms of efficiency and effectiveness. In those agricultural systems where there exist a risk of partial or total abandon in the case of removal of public support, direct payments can be considered a valid instrument to correct this risk of market failure. This has been the situation of many agricultural systems that provide positive externalities, especially extensive systems with low agricultural productivity. The efficiency of this way of intervention will depend on the relative changes that it introduces in the production system and the changes required to get a correct provision of the environmental amenities, in relation to the absence of intervention and the risk of abandon. If the relative changes introduced by direct payments are those required to reach that correct provision, additional agri-environmental schemes should just consist of an increase in the amount of direct payments whenever they are insufficient. On the contrary, the fact that most of the agri-environmental schemes do not only consist of that increase reveals that direct payments do not usually induce the most environmentally desired changes.
1
It is not the purpose of this paper to discuss how to determinate social optima, but it is obviously not a simple task, including aspects as determining society’s preferences, values and finally marginal benefits from the environmental externalities and farmers costs of provision. Hodge (1995), Kline and Wilchelns (1996), Hanley et al. (1998) or Romstand et al. (2000), per example, can be consulted in this topic. 3
The revision of current agri-environmental schemes under Regulation 2078/92 gives a strong proof in this sense (European Commission, 1999b). Most of these schemes are directed towards introducing changes in the production systems followed by farmers, proving that there is not a positive and constant relation between private ands public goods in the existing patterns. In a research of 351 agri-environmental schemes in 8 EU countries, Gatto and Merlo (1999) found that just 22% of those schemes operate in a situation where an increase in the level of production rises the level of environmental provision. Furthermore, in most agricultural systems these relative changes between environmental and private goods production would differ for levels of private goods production. This would be the case of many extensive livestock systems, where the relation could be increasing for low stocking rates, constant along a certain range of rates and decreasing when rates exceed some environmentally advised maximum. Hence in the designing of policies to address agricultural multifunctionality, a big importance falls on the kind of relation between the production of private and public goods (Romstand et al, 2000). As far as this relation keeps closer to perfect jointness in production, instruments linked to private goods as those used in the different Common Markets Organisations (CMOs) of CAP, will be efficient. But when other kind of relation is present, such as complementarity or competitiveness, a source of miss-effectiveness appears, especially from possible competition between targets and/or opportunity costs between instruments. In this context, the first objective of this paper is to analyse the possible efficiency advantage of using agri-environmental payments as a unique instrument to intervene in those systems being currently affected also by CAP’s CMOs direct payments. Due to the different attitudes of farmers towards agri-environmental schemes existing (Brotherton, 1991; Drake et al., 1999), farmers’ attitude towards their use as unique instruments will be studied and thus will become the second objective of this research.
3. THE CEREAL STEPPES ECOSYSTEM The cereal steppes agricultural system of Tierra de Campos, Spain (see figure 2), can be ecologically qualified as a pseudo-steppe (Suárez et al., 1997; Petersen, 1998), particularly a cultivated steppe (Martinez and Purroy, 1993). Agricultural intensification in Europe has confined these ecosystems to the Iberian Peninsula where they extend along approximately 4 million hectares, 40% of which corresponds to the natural area of Tierra de Campos (JCYL, 1995). The ecological role of Tierra de Campos is crucial for steppe birds and especially for its most representative species, the Great Bustard (Otis tarda), because it shelters about one sixth of the total world population (Sanz-Zuasti and Sierra, 1993). The area has been declared of special interest for the protection of birds (ZSPB number 36) and several of its birds species are qualified under different degrees of threat (Birdlife International, 2000).
4
Figure 1: Location of the study area, Tierra de Campos de Valladolid (Castilla y León, Spain)
Castilla y León
The case study area is conformed by 120,000 Ha at the heart of Tierra de Campos, corresponding to 43 municipalities at the north of the Valladolid province. This agricultural system was intensified in the 50s and 60s decreasing substantially the share of fallow in rotations and increasing the tendency towards cereal monoculture –mainly barley. These changes have differentiated the “intensified alternative” followed by most farmers from the “traditional alternative”, closer to a 50% of fallow land and a much higher proportion of traditional, non-cereal crops (Díaz et al., 1993). Agricultural land represents more than 85% of total land uses in the area, being the almost unique responsible of the steppe habitat maintenance and quality. Several ecological studies (Alonso and Alonso, 1990; Naveso and Groves-Raines, 1992; Díaz et al., 1993) have identified the risks and threats for the habitat, emphasising the loss of the habitat itself as the main risk. The risks of land abandon and new irrigation and land consolidation projects are the main factors threatening the habitat maintenance. Cereal monoculture with abandon of traditional crops and an increasing use of fertilisers, insecticides and seeds treated using products potentially dangerous for birds have been pointed as main causes for habitat quality decline. The development of new infrastructures in the area, especially power lines is another major source of threats.
4. POLICY INSTRUMENTS EVALUATED The first instrument considered is the current intervention system, integrated by CAP arable payments per hectare and the Cereal Steppes Scheme (CSS), the agri-environmental programme existing in the area. The CSS was developed under Regulation 2078/92 to conserve the habitat quality and preserve it from the previously mentioned risks. It consists of an annual payment per hectare of 65 euros compatible with the perception of CAP area payments, which are 157,5 euros/Ha after Agenda 2000 reform. The farmer must sign a 5 5
years contract compromising to a fix set of requirements (see Appendix 1). The program limits the total percentage devoted to cereal and sunflower (56% maximum for their sum), assures a minimum percentage of alfalfa and fallow (10% minimum is required, existing an extra payment for alfalfa) and requests the farmer to leave at least 1% of surface as permanent field borders. The whole dryland area is entitled to apply for these payments and currently 36% is under agreement2. To simulate the alternative instrument it is not enough to consider just the current CSS, because both its payments and its requirements have been designed considering a coexistence with CAP direct payments. To re-adapt the scheme to the new scenario, we have considered its original ecological bases (JCYL, 1992), the proposal for this agrienvironmental scheme made by SEO, the Spanish Ornithology Society (Naveso and Groves, 1992) and also the positive valuation that the CSS has received (Sanz-Zuasti and Sierra, 1993; Petersen, 1998). Appendix 1 summarises the requirements of the current CSS and the alternative scheme simulated. Just two variations have been introduced in the alternative scheme: − The scheme has been simulated considering two tiers. Tier-1 looks to keep the environmental provision obtained from the current scheme. Tier-2 would aim to increase that provision through three different complementary payments targeted to get further extensification, long term set-aside and biodiversity promotion. While the first option for tier-2 is a continuation of measures included in tier-1, the other two correspond with measures included in the initial CSS but scarcely developed (Paniagua, 1999). − The maximum percentage of cereal and sunflower in tier-1 has been increased from the current 56% to 65% or 75% percent (both percentages were proposed to the farmer during the survey). This modification makes easier for some farms to get into the scheme while it does not increase the total area devoted to these crops considering the average between farms participating and not in the scheme. A higher participation rate also allows a major spatial continuity of all the environmental improvements arising from the requirements.
5. METHODOLOGY Mathematical programming is a useful tool to simulate the effects of the two alternative instruments considered. However, the contractual character of the agri-environmental payments emphasises the importance of the farmers’ participation decision (Falconer, 2000). Although this decision can be modelled attending to the economic factors that have a certain amount of influence, the presence of non-economic factors (Beedell and Rehman, 1999) and the influence of farms heterogeneity (Wilson, 1997) give some advantage to the use of farm surveys (Drake et al., 1999). In the other side, farm surveys do not allow to research several alternative scenarios and are subject to possible discrepancies between declared and actual behaviour of the respondents (Lactactz-Lohmann and Webster, 1999). 2
Although the initial objectives of the program included reaching a 50% of land under agreement, later financial restrictions have impeded higher participation. 6
Taking into account the advantages and disadvantages of surveys and models, the methodology finally adopted considers a jointly use of both instruments. The level of the payment in the alternative instrument was a major issue because it is a determinant factor for farmers’ participation and also for the total cost of the policy intervention. The farm survey was used to assess this level by asking the farmers which should be the minimum amount of payment per hectare that would induce them to participate in the scheme. The median of these demands was transferred to the model to complete the simulation of the instrument. The survey also supplies qualitative information about the farmer perception of the scheme proposed. The model simulates the effects of that payment in the representative farms selected quantifying the value of the indicators required in the evaluation process (see below). The farm survey was conducted during May and June 2000 through personal interviews to 60 farmers in the area. The sample represented around 10% of total farms and land in the case study area. After a pilot survey, the final questionnaire had three blocks. The first block surveyed structural data: municipality, farmer age, farm size and participation/not in CSS. The second block questioned about the tier-1 level of the alternative scheme. After being informed of the characteristics and requirements of the level, the farmer was asked about the minimum payment demanded to participate, and also about the qualitative perception of the payment proposed. For the qualitative perceptions a Likert Scale with three levels (agree/disagree/undecided) was used and a final open question. The third block repeated the same structure for the three options of tier-2, but replacing the open-ended question about the payment required by a take-it-or-leave-it offer of a fix amount per hectare for each one of the options. The model constructed (see Appendix 2) corresponds to a Positive Mathematical Programming (PMP) model, following the method proposed by Howitt (1995). In this case marginal decreasing yields functions have been used. The PMP objective function maximises farm gross margin subject to agricultural, CAP and labour availability constraints. CSS and the alternative scheme are simulated including their payments in the objective functions and their environmental requirements as new restrictions and changes in the technical coefficients. The 1999 agricultural direct payments database was used to calibrate the model in its linear sub-model. Three representative farms, small (75 Ha), medium (150 Ha) and large (240 Ha), were selected considering both the 1999 database and the information from a fieldwork previous to the survey. This last source provided also the technical coefficients used in the model. The results of the model provide the environmental and economic indicators to compare the two instruments evaluated. Results will be compared using a cost-effectiveness approach where total public expenditure is conserved constant for both instruments. A first set of environmental indicators corresponds to the percentage of land devoted to the four agricultural uses that are promoted by the schemes according to their importance for the habitat conservation: field borders, pulses, alfalfa and fallow. Estimated average nitrogen use per hectare is a secondary habitat quality indicator that also gives information about total input use. The percentage of farmers accessing each agri-environmental scheme, constitutes an environmental indicator about the proportion of land that would benefit from 7
the rest of requirements. Finally, gross margin per hectare is an economic indicator not only of the implicit income target of current intervention, but also of the possible tendency of farms to land abandon. From a methodological point of view, while the nitrogen and the participation rate indicators can be qualified respectively as a pressure and a response indicators (OECD, 1997), it is more debatable whether target-uses must be qualified as a pressure or a state indicator according to the OECD classification. It is a pressure indicator for the final steppe birds status provision, but is a state indicator itself for the landscape and flora biodiversity provision. Also, the responses to qualitative questions in the farm survey correspond to an attitudinal indicator with implications in the long-term consecution of environmental improvements (Lowe et al., 1999). 6. RESULTS Farm survey As it was said before, farmers surveyed were asked which would be the minimum payment that would induce them to participate in the basic level (tier-1) of the alternative agrienvironmental scheme presented. The mean of the answers for this question (n=50) was 177,96 euros/Ha, while the median was 180,30 euros/Ha, with a variation coefficient of 0,19. There was no statistical significant relation between these demands and structural characteristics of farms –size, age, municipality– or current participation in CSS. The survey included a sensitivity analysis for two environmental requirements that were considered transcendent for farmers participation: the maximum percentage of cereal and sunflower allowed in the rotation plans and the minimum compulsory rate of surface that should be devoted to field borders. The initial values were 75% for the first requirement and 1% for the borders requirement. Farmers were asked if they would participate in return of the same payment previously demanded in case that each of these requirements were risen to the higher levels of 65% and 3% respectively. In the case of the cereal and sunflower restriction, no one of the interviewed required a higher payment to participate under the new stricter level. For the borders restriction, just 3 farmers considered that payment should be increased to continue participating. In all three cases they asked for extra compensations for the area diverted to borders, compensations that would be equivalent to an increase of 2-4 euros/Ha in the tier-1 hectare payment. Table 1 shows the qualitative results about the perception of the tier-1 level of the alternative scheme and also the farmers’ disposition to participate and viewpoints of the different options proposed for the tier-2 level. As can be seen from the figures, farmers consider that the basic level of the scheme is adequate for the area and would get important environmental benefits. Considering the proximity between this level of the alternative scheme proposed and the current CSS, these positive perceptions could be easily transferred to the own CSS. Farmers also consider that there would be a high level of participation for a payment of the amount that they have demanded.
8
TABLE 1.- SURVEY RESULTS: QUALITATIVE PERCEPTION OF THE ALTERNATIVE AGRI-ENVIRONMENTAL SCHEME PROPOSED Measure proposed BASIC LEVEL PAYMENT (TIER-1): The measure is suitable for the area......... It would generate important environmental benefits............................. Participation would be large.....................
n
Agree
Disagree
Undecided
46
41.5
2
2.5
46 46
35.5 39.5
5 2
5.5 4.5
COMPLEMENTARY LEVEL (TIER-2): OPTION OF INCREASING EXTENSIFICATION: I would participate in the measure............ 35 27 5 The measure is suitable for the area......... 35 26 5 It would generate important environmental benefits............................. 35 28 2 Participation would be large..................... 35 18 4 The payment offered is enough................ 28 19.5 3 COMPLEMENTARY LEVEL (TIER-2): OPTION OF LONG TERM SET-ASIDE I would participate in the measure............ 32 3 The measure is suitable for the area......... 32 2 It would generate important environmental benefits............................. 32 6 Participation would be large..................... 32 3 The payment offered is enough................ 32 7
3 4 5 13 5.5
29 30
0 0
20 16 6
6 13 19
COMPLEMENTARY LEVEL (TIER-2): OPTION OF BIODIVERSITY IMPROVEMENT: I would participate in the measure............ 28 25 0 The measure is suitable for the area......... 27 21 2 It would generate important environmental benefits............................. 27 20 2 Participation would be large..................... 27 11 6 The payment offered is enough................ 27 20 2
3 4 5 10 5
- Decimals correspond to farmers answering two options at the same time (agree and undecided)
In relation to tier-2, figures in table 1 show the existence of a higher interest to participate and a very positive perception of the options aimed at increasing extensification and promoting biodiversity. On the contrary, farmers are scarcely interested in the option for long-term set-aside (20 years) which they consider unsuitable for the area and unable to provide important environmental benefits. In the final open question most of the farmers expressed that this option would mean a negative impact on the global level of economic activity in the area and that they could not understand its environmental benefits. Farmers do not refuse to participate in this option because they consider insufficient the payment offered (just 6 out of 32 express this opinion), which shows that participation could be not only determined by perceived profitability but also by perceived environmental and territorial suitability of the measures. These perceptions and observations have a great
9
importance because this measure is currently included in CSS, although very few agreements have been signed (Paniagua, 1999). PMP Model The PMP model was used to simulate the effects of both the current intervention system after Agenda 2000 reform and the alternative system. The median of the payments from the survey (180,30 euros/Ha) was considered to simulate the alternative scheme. Table 2 summarises the results of the simulations for the indicators selected. These figures correspond with average aggregated results for the whole area, considering the individual results for the different representative farms, the proportion of each of these in the agricultural system and the percentages of farming participating or not in the different schemes. The four first figures correspond with the percentage of area devoted to each target use (borders, pulses, alfalfa and fallow) and the next ones present the average estimated consumption of nitrogen per hectare, the percentage of farms participating in the environmental scheme and the average gross margin per hectare. First row in table 2 presents the results of the current intervention system after Agenda 2000. Rows 2-5 shows the results of the alternative system for different levels of the requirements and public expenditure allocation between both tiers as explained at the bottom of the table. The simulation of tier-2 corresponds to the option of increasing extensification, in both cases combined with the stricter level of requirements in tier-1 (65% and 3%). Survey and model results for the sensitivity analysis for requirements exigency have permitted this simplification. Extensification was selected among the three possible options for tier-2 due to its feasibility to be simulated using the model and after its positive acceptation in the farm survey (table 1). TABLE 2: AVERAGE PMP MODEL RESULTS FOR THE AREA Partic.
Gross Margin
48.17
36.0%
225,83
9.85
51.92
98.0%
231,57
13.68
14.14
48.41
98.0%
229,27
12.53
23.10
33.72
Environmental indicators ALF FAL N units
Instrument
BOR
PUL
Current intervention
0.36
5.82
6.20
17.51
Alternative scheme – Option A
0.98
4.88
12.43
Alternative scheme – Option B
2.94
5.83
Alternative scheme – Option C
2.20
5.52
73.5% 187,13 65.3% (t-1) Alternative scheme – Option D 2.69 5.73 13.30 17.13 43.51 24.5% (t-2) 215,22 Option A: 100% of public expenditure allocated in tier-1 contracts; lower level of requirements Option B: 100% of public expenditure allocated in tier-1 contracts; higher level of requirements Option C: 100% of public expenditure allocated in tier-2 contracts; higher level of requirements Option D: 2/3 of public expenditure allocated in tier-1 contracts and 1/3 in tier-2; lower level of requirements BOR, PUL, ALF, FAL: percentage of land devoted to field borders, pulses, alfalfa and fallow. N units: Units of nitrogen per hectare Partic: Percentage of farms participating in each agri-environmental scheme / tier Gross margin: measured in euros per hectare.
10
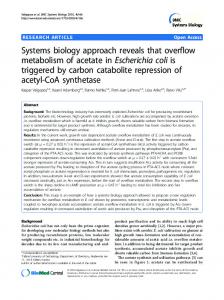
Results show the capacity of the exclusive use of agri-environmental payments to achieve a better environmental level without negative impacts on farm incomes. A more detailed study of the results allows to establish some important considerations. The first, model shows very few income differences between the two levels of environmental requirements for tier-1 (rows 2 and 3), but a significant larger environmental output in the case of the stricter levels. The low variation in gross margins is consequent with the results obtained in the survey, where farmers accepted these changes without modifying their compensation demands. It is important to note that the removal of area direct payments implied by the alternative scheme also involves a suppression of the compulsory set-aside rate (simulated at a 10% level for the current intervention instrument). This has immediate consequences over the fallow and nitrogen indicators, requiring the use of stricter levels in the alternative agri-environmental scheme to maintain their initial values. Tier-2 level yields a better environmental output, especially for those indicators (fallow, nitrogen) where the tier-1 level could not improve the results of the current intervention system. But this level is an expensive instrument, with a negative effect on the total percentage of farms that could have access to agri-environmental contracts. This lower participation rate has also a negative impact on average gross margins. The alternative-D case where public expenditure is shared among both tiers performs intermediate results, serving as an example of the possible use of the complementary level. Anyhow, the cost of this complementary level and its capacity to increase environmental output may advice a possible better use in more targeted areas where the agency looks for local and specific environmental improvements. Independently of expenditure distribution or level of requirements, alternative scheme allows important increases in participation rates. From an environmental point of view, higher participation rates mean that environmental improvements present a greater continuity along the ecosystem. Secondly, participation rate is also an indicator for the rest of the environmental requirements that are not covered by the selected indicators as the restrictions in the use of herbicides or treated seeds (see Appendix 1). Figure 2 resumes graphically this evaluation comparing the current intervention system with the alternative scheme in its option B (stricter requirements, 100% expenditure in tier1). Performance of the alternative scheme for the seven indicators (target-uses, nitrogen, participation rate and gross margin) is compared with the current intervention system using a logarithmic scale. The unit has been assigned to the indicators’ values of the current intervention system. Considering that total public cost is constant, the figure shows how the alternative instrument improves largely some environmental indicators, especially borders and alfalfa areas and participation rate, without negative consequences for the farms economic margins. Maintenance of economic margins would confirm survey results about farmers disposition to participate in the alternative scheme and also would avoid land abandon. The graphic reflects also the mentioned minimum decrease in the percentage of fallow land due to the suppression of the compulsory set-aside, which could be solved using the tier-2 level of payments as discussed before.
11
Figure 2: Multicriteria analysis of the instruments selected
Borders 10 Gross Margin
1
Pulses
0,1 Participation
Alfalfa
Nitrogen
Current
Fallow
Alternative
Finally, it is necessary to point out that the evaluation has considered only the public expenditure from the payments. The inclusion of agency’s transaction costs –administrative costs– should have required a specific research. In this case studied, administrative costs can be considered similar for both instruments analysed. Current CSS requires a written application submitted to the agency where the farmer proposes the rotation plan for the five years term and compromises with the rest of the requirements. Besides, farmer applies annually for the CAP area payments and the agency checks the compatibility between the annual crop plan and the one submitted for the agri-environmental contract. Monitoring uses in both cases –agri-environmental and area payments– a mix of teledetection techniques and in situ inspections. The alternative scheme would require similar administrative costs and its proximity to the current CSS minimises information costs. This similarity between transaction costs makes possible to compare both instruments considering just the payments costs. In any case, as Falconer and Whitby (1999) show, there are large differences in transaction costs among the different agri-environmental schemes implemented that could diminish the efficiency gains pointed at in this research for those schemes with higher transaction costs. 7. DISCUSSION AND CONCLUSIONS The main conclusion of this research is that policy intervention effectiveness could be potentially increased using an agri-environmental scheme as the unique intervention instrument. This conclusion confirms the intuitive findings from the policy considerations made in section two. The social optimum in this agroecosystem, does not only require more agricultural production but a change in the production pattern. Consequently, there is not a perfect joint-production between private and public goods in the agricultural system, and this creates a source of ineffectiveness in the use of payments which is linked to the
12
production and that can be avoided using only those payments linked to the public goods. As discussed previously, existing agri-environmental schemes confirm that this is the situation for most of the agricultural systems that provide positive environmental externalities. Society would benefit from a larger public goods provision without additional budgetary resources while farmers would maintain their present income. As concluded in previous studies (Ceña and Ortiz, 1999; Drake et al., 1999), farmers’ participation in this kind of schemes has proved to be based on profitability expectances. However, the survey has shown that farmers recognise the major or minor capacity of these programs to provide environmental benefits in the area. In this sense, farmers surveyed judged positively the current CSS and also most of the alternative scheme proposed, but not some measures as the long term set aside. Farmers are also able to accept certain increases in the requirement levels that have shown to provide larger environmental outputs, making final policy effectiveness very dependent of a correct design of those levels. Both farmers’ perception of the suitability of the program and acceptance of more restrictive requirements have important consequences on policy efficiency. Gasson and Potter (1988) concluded in a pioneer use of farm surveys to measure willingness to participate in agri-environmental schemes that attitudes could influence largely on it. Results reached in this research seem to support this idea, although sample size has been insufficient to get more robust conclusions. In any case, a positive perception of the schemes could also lead to a better compliance of the requirements and a more environmental oriented concern in the farmer, and this would have an effect on the environmental quality in the long-term. Therefore, it becomes quite clear how useful it can be to include farmers’ opinions and perceptions when designing or modifying these schemes, and this should be encouraged, as it has been proposed in this research by using a methodology that combines farm surveys with mathematical programming models. There is a strong coherence between results from the farm survey and the model, supporting the methodology employed. Farms gross margins for the alternative scheme are similar to those obtained with the current intervention, corroborating the intuition that farmers’ demands in the survey corresponds to the amount of payment which guarantees the maintenance of their incomes. This coherence enhances the validity of the model results used to evaluate the instruments and the probability that farmers would really participate in the alternative scheme proposed. Nevertheless, a larger sample in the survey would permit to investigate if differences in the payments demands among farmers could be explained by the structural characteristics of farms. However, the social impact of this kind of surveys about alternative policy instruments must be considered before enlarging the samples. From a political point of view, in the context of the CAP, the transfer of intervention towards the unique use of agri-environmental schemes would mean to open the debate about renationalisation. In opposition to the CAP direct payments, agri-environmental schemes must be cofinanced by member states. This has supposed a problem in the implementation of Regulation 2078/92 (Wilson et al., 1999), increased in countries with fewer budgetary resources as Spain (Paniagua, 2001). Without altering the cofinancing
13
restriction of increasing budgetary resources, results could have been different under the restriction of keeping constant the current national public expenditure. Finally it is convenient to discuss the possible transfer of the results from this research to other agricultural systems. This transference could be suitable in general terms for most of the agricultural systems under agri-environmental schemes. As Gatto and Merlo (1999) pointed in the previously quoted research, very few programs operate under perfect jointproduction conditions. As concluded in section two, the relation between private and public goods in each agricultural system becomes very important for this transferability. In those systems where this relation differs highly from perfect jointness, more policy efficiency must be expected from transferring the intervention to public good linked measures as proposed in this paper. From a global economic perspective, one final restriction should be formulated in the case that the externalities generated do not correspond with perfect public goods, demanding to research possible treatments based in the use of markets. REFERENCES – – – – – – – – – –
Alonso, J.C. and Alonso, J.A. (1990). Parámetros demográficos, selección de hábitat y distribución de la avutarda (Otis tarda) en tres regiones españolas. ICONA, Colección Técnica, Madrid. Baldock, D., Beaufoy, G., Brouwer, F. and Godeschalk, F. (1996). Farming at the margins. Institute for European Environmental Policy (IEEP) and Agricultural Economics Research Institute (LEI-DLO). London and The Hague. Bardají, I., Atance, I. and Tió, C. (2001). Des objectifs territoriaux de la politique d’élevage commune: études de cas espagnols. REM: Revue de L’Économie Méridionale 49-1: 25-41. Beedell, J.D.C. and Rehman, T. (1999). Explaining farmers’ conservation behaviour: Why do farmers behave the way they do? Journal of Environmental Management 57: 165-176. Birdlife International (2000). Threatened birds of the world. Barcelona and Cambridge. Lynx Edicions and Birdlife International. Brotherton, I. (1991). What limits participation in ESAs? Journal of Environmental Management 32: 241-249. Brouwer, F. and Lowe, P. (1998). CAP and the rural environment in transition. A panorama of national perspectives. Wageningen Pers, Wageningen. Ceña, F. and Ortiz, D. (1999). The effects of CAP on agri-environmental quality in livestock farming: the case of Andalusia. Medit 10(1): 54-63. Colman, D., Crabtree, J.R., Froud, J. and O’Carroll, L. (1992). Comparative Effectiveness of Conservation Mechanisms. Department of Agricultural Economics, University of Manchester. Díaz, M., Naveso, M.A. and Rebollo, E. (1993). Respuestas de las comunidades nidificantes de aves a la intensificación agrícola en cultivos cerealistas de la Meseta Norte (Valladolid-Palencia, España). Aegypius 11: 1-6.
14
– – – – – – –
– – – – – –
– – – –
Drake, L., Bergström, P. and Svedsäter, H. (1999). Farmers’ Attitude and Uptake. In G. Van Huylenbroeck and M. Whitby (eds) Countryside Stewardship: Farmers, Policies and Markets. Pergamon. European Commission (1999a). Agenda 2000: A policy for the future. DirectorateGeneral VI, Agricultural. Brussels. European Commission (1999b). State of application of regulation (EEC) 2078/92: Evaluation of Agri-environment Programmes. Directorate-General VI, Agriculture, Brussels. Falconer, K. and Whitby, M. (1999). Transaction Costs in Countryside Stewardship Policies: An Investigation for Eight European Member States. Research Report. Centre for Rural Economy, Newcastle. Falconer, K. (2000). Farm-level constraints on agri-environmental scheme participation: a transactional perspective. Journal of Rural Studies 16: 379-394. Gasson, R. and Potter, C. (1988). Conservation through land diversion: a survey of farmers’ attitudes. Journal of Agricultural Economics 39: 340-351. Gatto, P. and Merlo, M. (1999). The Economic Nature of Stewardship: Complementarity and Trade-offs with Food and Fibre Production. In G. Van Huylenbroeck and M. Whitby (eds) Countryside Stewardship: Farmers, Policies and Markets. Pergamon. Hanley, N., Kirkpatrick, H., Oglethorpe, D. and Simpson, I. (1998). Principles for the provision of public goods from agriculture. Land Economics 74: 102-113. Hanley, N., Whitby, M. and Simpson, I. (1999). Assessing the success of agrienvironmental policy in the UK. Land Use Policy 16: 67-80. Hellegers, P.J.G.J. and Godeschalk, F.E. (1998). Farming in High Nature Value Regions. The Role of Agricultural Policy in Maintaining HNV Farming Systems in Europe. Agricultural Economics Research Institute (LEI-DLO). The Hague. Hodge, I. (1995). Public Policies for Land Conservation. In D.W. Bromley (ed) The Handbook of Environmental Economics. Blackwell. Oxford. Howitt, R. (1995). Positive Mathematical Programming. American Journal of Agricultural Economics 77: 329-342. JCYL, Junta de Castilla y León (1992). Programa de Zona de Aplicación del Reglamento 2078/92 en las Estepas Cerealistas de Castilla y León. Consejería de Medio Ambiente y Ordenación del Territorio; Consejería de Agricultura y Ganadería. Valladolid. JCYL, Junta de Castilla y León (1995). Tierra de avutardas. La llanura cerealista de Castilla y León. Consejería de Medio Ambiente y Ordenación del Territorio. Valladolid. Kline, J. and Wichelns, D. (1996). Measuring public preferences for the environmental amenities provided by farmland. European Review of Agricultural Economics 23: 421436. Lactacz-Lohmann, U. (1998). Mechanisms for the Provision of Public Environmental Goods in the Countryside. In S. Dabbert, A. Dubgaard, L. Slangen y M. Whitby (eds) The Economics of Landscape and Wildlife Conservation. CAB International, Oxon. Lactacz-Lohmann, U. and Webster, P. (1999). Moral Hazard in Conservation Contracting. Contributed paper to the IX Congress of the European Association of Agricultural Economists, 24-28 August, Warsaw.
15
– – – – – – – – – – – –
–
– – – –
Lowe, P., Ward, N. and Potter, C. (1999). Attitudinal and Institutional Indicators for Sustainable Agriculture. In F.M. Brouwer and J.R. Crabtree (eds.) Environmental Indicators and Agricultural Policy. CAB International, Oxon. Martínez, C. and Purroy, F.J. (1993). Avifauna reproductora en los sistemas esteparizados ibéricos. Ecología 7: 391-401. Naveso, M.A. and Groves-Raines, S. (1992). Propuesta de declaración de la zona de Tierra de Campos como área medioambientalmente sensible. Sociedad Española de Ornitología y Plataforma de Ayuntamientos de Tierra de Campos. July 1992. OECD (1997). Environmental Indicators for Agriculture. OECD, Paris. Oltmer, K., Nijkamp, P., Florax, R. and Brouwer, F. (2000). A meta-analysis of environmental impacts of agri-environmental policies in the European Union. Tinbergen Institute Discussion Paper TI 2000-058/3. Paniagua, A. (1999). Remembrement de la propieté rurale et politique agrienvironnementale: le programme de “l’outarde” en Castille-Leon (Espagne). Medit 2/99: 16-23. Paniagua, A. (2001). Agri-environmental policy in Spain. The agenda of socio-political developments at the national, regional and local levels. Journal of Rural Studies 17 : 81-97. Petersen, J.E. (1998) Implementing agri-environmental legislation in the European Union: an analysis of regulation 2078/92EEC in Spain. PhD dissertation. University of East Anglia. Potter, C., Lobley, M. and Bull, R. (1998). Agricultural Liberalisation and its Environmental Effects. Environment Department, Wye College, University of London, June. Romstad, E., Vatn, A., Rørstad and Soyland, V. (2000). Multifunctional Agriculture. Implications for Policy Design. Report number 21. Department of Economics and Social Sciences, Agricultural of Norway, Ås. Sanz-Zuasti, J. and Sierra González, G. (1993). Avances en la conservación de la avutarda en Castilla y León. Quercus 92: 6-12. Schramek, J., Biehl, D., Buller, H. and Wilson, G. (1999). Implementation and Effectiveness of Agri-Environmental Schemes Established Under Regulation 2078/92. Project FAIR 1 CT95-274, Final Consolidated Report. Institut fuer laendkiche Strukturforschung. Frankfurt. Suárez, F., Naveso M.A. and De Juana, E. (1997). Farming in the drylands of Spain: birds of the “pseudosteppes”. In D. Pain and M. Pienkowski (eds.) Farming and Birds in Europe; The Common Agricultural Policy and its implication for bird conservation. Academic Press, London. Van Huylenbroeck, G. and Whitby, M. (1999). Countryside Stewardship: Farmers, Policies and Markets. Pergamon. Whitby, M. and Saunders, C. (1996). Estimating the Supply of Conservation Goods in Britain: A Comparision of the Financial Efficiency of Two Policy Instruments. Land Economics 72: 313-325. Willis, K.G., Garrod, G.D. and Saunders C.M. (1995). Benefits of Environmental Sensitive Area Policy in England: A Contingent Valuation Assessment. Journal of Environmental Management 44: 105-125. Wilson, G.A. (1997). Factors Influencing Farmer Participation in the Environmentally Sensitive Areas Scheme. Journal of Environmental management 50: 67-93. 16
– –
Wilson. G.A., Petersen, J.E. and Höll, A. (1999). EU member state responses to AgriEnvironment Regulation 2078/92/EEC – towards a conceptual framework? Geoforum 30: 185-202. Winter, M. and Gaskell, P. (1998). The Agenda 2000 debate and CAP reform in Great Britain. Is the environment being sidelined? Land Use Policy 15: 217-231.
Appendix 1: Environmental requirements in current and alternative agri-environmental scheme Current scheme (CSS) A. At least 44% of total agricultural land in the farm must be devoted to alfalfa or other pastures, grain leguminous or fallow. B. At least 10% of total agricultural land must be devoted to fallow or alfalfa. C. At least 1% of total agricultural land must be diverted towards permanent field borders. D. Restriction in the use of insecticides and plaguicides to those specifically authorised. E. Prohibition to use seeds treated with products potentially dangerous for the fauna. F. Prohibition of harvesting before July 15th and between sunset and sunrise. G. Stubble must not be burnt and must be incorporated to soil in those fields under fallow in the next year. Alternative scheme Basic Level (tier-1): 1. At least 25% (lower requirement) / 35% (stricter requirement) of total agricultural land in the farm must be devoted to alfalfa or other pastures, grain leguminous or fallow. 2. At least 1% (lower requirement) / 3% (stricter requirement) of total agricultural land must be diverted towards permanent field borders. 3. Measures B, D, E, F and G of current CSS. Complementary Level (tier-2): Option of increasing extensification: Payment offered: +60,10 euros per hectare (additional to basic level payment) 1. All measures of the basic level. 2. At least 50% of total agricultural land in the farm must be devoted to alfalfa or other pastures, grain leguminous or fallow. 3. At least 15% of total agricultural land must be devoted to fallow. 4. At least 15% of total agricultural land must be devoted to alfalfa. 5. At least 3% of total agricultural land must be diverted towards permanent field borders. 6. Limitation in nitrogen fertilisation to 60 units per hectare. Complementary Level (tier-2): Option of long-term set-aside: Payment offered: 150,25 euros per hectare (unique payment, not additional to basic level payment) 1. 20 years set-aside of a part or the whole agricultural land of the farm.
17
2. Vegetation in these fields must not be burned and must be ploughed to limit it to 25% of surface. 3. Grazing is allowed just during the February-June period. Complementary Level (tier-2): Option of biodiversity improvement: Payment offered: 240,40 euros per hectare (unique payment, not additional to basic level payment) 1. To sow or plant those vegetal species of biological interest that the responsible agency determines. 2. Prohibition to market the production obtained unless specific authorisation.
Appendix 2: Positive Mathematical Programming (PMP) model constructed A) LINEAR SUB-.MODEL: Objective function: max GM = ∑ (pc × yc – vcc + dpc) × Sc where GM represents the farm gross margin, being pc, yc, vcc, dpc and Sc the price, yield, variable costs, direct payments per hectare and surface of each crop. Subject to: S C ≤ H CC × S C
∑a
i c
≤ bi
C
ro × ∑ S C * ≤ S R ≤ rv × ∑ S C * C*
C*
where Hcc is a c× c matrix of crop succession coefficients, ac i represents the requirements of each crop c of land and labour and bi their availability (i=1, b1 = total agricultural land in the farm; i=2,3,4, b2,3,4 = labour available in the most restrictive periods of autumn, spring and June), SR the surface devoted to fallow, ro the CAP compulsory set-aside coefficient and rv the coefficient for voluntary set-aside and c* are those crops affected by these coefficients. And to an upper calibration constraint (Howitt, 1995): Sc ≤ Surc × 1,001 being Surc the surface devoted to c in year 1999 (obtained from 1999 area payments database).
18
B) PMP MODEL: Following the method proposed by Howitt, the calibration constraint dual values are use to construct a marginal decreasing yields function per each crop that is incorporated to build the final objective function: max GM = ∑ [pc × (βc – δc × NLSc)– vcc + dpc] × NLSc where NLSc is the new surface devoted to each crop and βc and δc are the coefficients of the marginal yields decreasing functions for each crop, obtained from the linear sub-model trough the next equations for normal crops (those with a positive dual value for the calibration restriction):
(DS
δC =
C
× (1 − Py c ) + QAd pC × S C
β C = QC + δ C × SC QAd
= Db
C
1
× (1 − APy
C
)
) × Var C
while the next equations give the value of βc and δc for marginal crops (those that are not assigned the maximum possible surface in the linear sub-model): QAd C pC × S C
δC =
β C = QC + δ C × SC QAd
C
= Db 1 × (1 − APy ) × Var C
In both sets of equations, DSc and Db1 represents the dual values of the calibration restriction for crop c and total surface respectively; Pyc and Apy are the proportion that payments represent in the gross margin of crop c and in the alternative; Varc is the average yields variation of the crop c during the period 1993-1998 and Qadc is the adjusted yield for crop c. C) AGRI-ENVIRONMENTAL SCHEMES SIMULATIONS: The PMP model structure allows to simulate the effects of the two agri-environmental schemes considered while keeping the model calibrated for the validation year (1999). The simulation of these schemes requires introducing changes in the technical coefficients of the representative farms, incorporating the agri-environmental payments to the objective function and adding the new constraints derived from the schemes environmental restrictions. The new technical coefficients are defined after the calculation of the decreasing marginal yields functions, while the objective function and constraints
19
transformed are just those of the PMP model. Thus, in the case of the current CSS, the new objective function is: max GM = BAP × b1 + ∑ [pc × (βc – δc × NLSc)– vcc + dpc + apc] × NLSc where BAP corresponds to the basic agri-environmental payment per hectare and apc the CSS agri-environmental complementary payment for alfalfa (ap=0 for c≠alfalfa). Finally, crop decisions requirements (named A, B and C in appendix 1) introduces three new constraints while the rest of requirements affect technical coefficients. These three new constraints are:
∑ SNLc ≤ 0,99 × b1 SNLF + SNLP + SNLA ≥ 0,44 × ∑ SNLc SNLF + SNLA ≥ 0,10 × ∑ SNLc where SNLF, SNLP and SNLA, correspond respectively to the surface assigned in the PMP model to fallow, pulses and alfalfa.
20