P u b l i s h i n g
Invertebrate Systematics C o n t i n u i n g I n v e r t e b r a t e Ta x o n o m y
Volume 16, 2002 © CSIRO 2002
All enquiries and manuscripts should be directed to:
Invertebrate Systematics CSIRO Publishing PO Box 1139 (150 Oxford St) Collingwood, Vic. 3066, Australia Telephone: +61 3 9662 7629 Fax: +61 3 9662 7611 Email:
[email protected] Published by CSIRO Publishing for CSIRO and the Australian Academy of Science
www.publish.csiro.au/journals/is
Invertebrate Systematics, 2002, 16, 637–653
IS02 15 JS.mNa.lA-.scHaolepseroangdebJ.ioAd.ivKernsityedpyaterns
Small-scale patterns of sponge biodiversity (Porifera) on Sunshine Coast reefs, eastern Australia John N.A. HooperA and John A. Kennedy Biodiversity Program, Queensland Museum, PO Box 3300, South Brisbane, Qld 4101, Australia. A To whom correspondence should be addressed. Email:
[email protected]
Abstract. Ten reefs off the Sunshine Coast, south-eastern Queensland (26.2–26.8°S, 153.2°E), Australia, were sampled from 1991 to 2000. They were found to contain a rich fauna of 247 species of marine sponges (Porifera) in 97 genera, 44 families and 14 orders, with 51% of species not yet recorded elsewhere from the Indo-west Pacific, representing a highly unique fauna in this biogeographic transition zone between the Solanderian and Peronian provinces. Reefs were relatively heterogeneous in species richness (18–83 species/reef, mean 41 species/reef), despite equivalent collection effort, and were highly heterogeneous in taxonomic composition (34% mean ‘apparent endemism’/reef), with only 15 species co-occurring in more than five reefs. Sixty per cent of species were ‘rare’ (found only on single reefs) and only 19% of species co-occurred in the adjacent Moreton Bay region. Gradients in species richness and taxonomic composition were not correlated with the distance between reefs or their latitude and only partially correlated with their distance from the shore, but they were highly correlated when sites were combined on the basis of both distance from shore and latitude. Two southern outer reefs (5.5–9 km from the coast) and four northern inner reefs (0.5–1.25 km from the coast) had highly distinctive faunas (richness and taxonomic composition), with a gradual gradient of dissimilarities for reefs intermediate between these two groups of sites, similar to sponge faunal patterns from other studies conducted at much larger spatial scales. One southern outer reef, Flinders Reef, was anomalous compared with the general regional fauna. Flinders Reef had low species richness, the highest taxonomic distinctness and the least heterogeneity in terms of taxonomic composition at species, genus and family levels, with affinities closer to the southern Great Barrier Reef than to the Sunshine Coast or Moreton Bay reefs. This finding is significant because Flinders Reef is the only designated highly protected marine area outside of Moreton Bay and is allegedly representative of the marine biodiversity of the whole region, yet contains few of the sponge genetic resources of the region, which has implications for the design and scale of marine reserves. Family-level taxa were poor surrogates of species diversity. Factors potentially responsible for spatial heterogeneity of sponge faunas between groups of reefs are discussed, including gradients in water quality (light, turbidity, siltation) and requirements for habitat specialisation by some species.
Introduction Tropical Indo-Pacific marine faunas are often thought to be highly diverse and to occupy a more-or-less uniform environment (reviewed in Taylor 1997). Yet we know that coral reefs in particular, and many other marine environments in general, are substantially heterogeneous in their diversity and faunal composition, often with little taxonomic overlap between adjacent areas, geographically and bathymetrically (e.g. Huston 1985; Grassle 1991; Guichard and Bourget 1998; Richer de Forges et al. 2000; Gray 2001). Good baseline data to support this hypothesis exist for a few marine taxa including corals, fishes and some groups of molluscs (e.g. Veron 1993, 1995; Meyer and © CSIRO 2002
Paulay 2000; Bellwood and Hughes 2001). However, for most marine phyla we are still uncertain even of the magnitude of marine biodiversity (Kohn 1997), let alone their dynamics and interdependencies, their interactions and responses to environmental factors, or the appropriate spatial scales needed to study them as essential prerequisites to address pressing conservation and management issues (e.g. Jensen et al. 1999; Anon. 2001). In this category are included the sponges (Porifera), a highly diverse and ancient group of primitive metazoans that have survived largely unchanged in their fundamental ‘bauplans’ since the Late Cambrian (509 million years ago). Once important reef builders during the Phanerozoic – a role 10.1071/IS02015
1445-5226/02/040637
638
subsequently usurped by the faster-growing scleractinarian corals during the late Mesozoic – sponges have radiated and diversified in Recent seas, with representatives now found in all aquatic habitats, from ephemeral (quasi-terrestrial) habitats to the more stable marine abyssal zones (reviewed in Hooper and Van Soest 2002). There are currently about 7000 described (‘valid’) species worldwide but recent estimates from the various museum collections suggest that the extant fauna is at least twice as diverse as this (e.g. Hooper and Lévi 1994; Hooper and Wiedenmayer 1994; Van Soest 1994). The renewed interest in the phylum and the accelerated discovery of species over the past few decades has largely been driven by their huge potential as sources of therapeutic drugs (e.g. Munro et al. 1999). Conversely, their systematic framework is still poorly resolved (Hooper and Van Soest 2002), and knowledge of their biodiversity (richness, endemism, spatial distributions) (e.g. Hooper et al. 2002) and historical biogeographic affinities (e.g. Van Soest and Hajdu 1997) is still rudimentary. Over the past decade there have been several studies on sponge biodiversity and biogeography (i.e. contributing data on species richness, abundance, endemism, taxonomic relationships between marine areas), at various spatial scales. These studies have revealed that sponges form spatially heterogeneous, relatively highly ‘apparently endemic’ communities, with potential connectivity between adjacent communities also hampered by their reportedly very limited sexual reproductive dispersal capabilities (e.g. Sarà and Vacelet 1973; Zea 1993, 2001; but see Davis et al. 1996). At larger spatial scales, sponge community patterns have been linked to such factors as historic and modern day water current patterns, historical biogeography of the faunas and the regions they occupy, introduced ‘exotic pests’ through human activity, etc. (e.g. Van Soest 1993, 1994; Maldonado and Uriz 1995; Van Soest and Hajdu 1997; Hooper et al. 1999b, 2000, 2002; Zea 2001). At smaller spatial scales, certain pivotal environmental variables have been linked to sponge community heterogeneity. These include light, depth, substrate quality, local reef geomorphology, water quality, food particle size availability, larval recruitment and survival, etc. (e.g. Wilkinson and Vacelet 1979; Wilkinson and Cheshire 1989; Hooper 1994; Maldonado and Young 1996; Roberts and Davis 1996; de Voogd et al. 1999; Lehnert and Fischer 1999). This demonstrates that many (although not all) sponge species have very specific habitat requirements, thus making them useful tools for monitoring environmental stress (reviewed in Carballo et al. 1996). This present study complements an earlier analysis that examined changes to the sponge community along a large spatial scale (seascape or γ-scale; see Gray 2001) throughout north-eastern Australia (Hooper et al. 1999b) (investigating patterns of richness, endemism and taxonomic composition), and a still larger, regional (continental or ε-scale) study of
J. N. A. Hooper and J. A. Kennedy
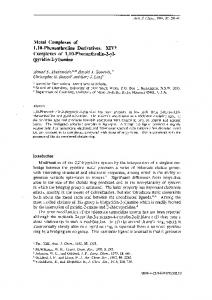
provincial faunas throughout tropical Australasia, the western Pacific and South-East Asia (Hooper et al. 2002). Here we focus on small-scale (intra-regional or α-scale) patterns of biodiversity by comparing sponge faunas from 10 more-or-less adjacent discrete reefs lying off the Sunshine Coast of Australia (26.2–26.8°S, 153.2°E) (Fig. 1). We investigate more closely the influence of high species heterogeneity between similar and/or adjacent reef systems, the taxonomic distinctness of the faunas that occupy these reefs, and the impact of unique or rare species on biodiversity (numerical) models and its implication for the design of small-scale marine protected areas. Methods Sponges were sampled from ten reefs lying off the greater Sunshine Coast region, extending from South Halls to the north (off Noosa; 26°22′S) to Hutchinson Shoals and Flinders Reef to the south (off Cape Moreton; 26°58′S) (Fig. 1). Sponges were collected using SCUBA between September 1991 and October 2000, photographed in situ, identified, registered and databased in the collections of the Queensland Museum (QM). Identifications were made to the lowest taxonomic level possible, with each ‘morphospecies’ assigned a unique code irrespective of whether it could be identified as a known (described) taxon or was new to science. The majority of the Australian sponge fauna (possibly >75%) still remains undescribed (Hooper and Wiedenmayer 1994). Conspecificity between regional faunas, at all spatial scales (Hooper et al. 1999b, 2002) was determined using the Museum’s unique taxonomic knowledge base (i.e. a propriety database describing and illustrating morphology, histology, life characteristics, locality and habitat information, etc. for every specimen collected, with emphasis on differentiating morphospecies). In this study, species diversity or biodiversity refers to the species richness, taxonomic composition, levels of ‘apparent endemism’ and taxonomic distinctness between small (α-scale) faunas occupying discrete reefs within an approximate 50 km radius of each other. It does not include a measure of abundance of species populations frequently used to derive a synthetic diversity measure (e.g. Clifford and Stephenson 1975), which was not possible to calculate using our diving protocols. Similarly, ‘apparent endemism’ refers to geographically restricted taxa that were not recorded outside a particular site relative to other sites investigated (Hooper et al. 2002) and does not necessarily imply a wider phylogenetic interpretation of ‘endemism’, which for the marine biome (and for sponges in particular) is still highly contentious (Hooper 1994; Van Soest and Hajdu 1997). Definitions of the spatial scale terminology follow Gray (2001), which were modified from his earlier classification (Gray 1997). These revised scales are defined as: point-diversity (a single sample within a habitat); α-scale diversity (within-habitat diversity, or a number of samples within a habitat, where species are presumed to interact and compete for similar limiting resources); γ-scale (within-region or landscape/seascape diversity, where evolutionary processes become increasingly important); and ε-scale diversity (regional or biogeographic provincial diversity, or the total species richness of a group of large areas). Gray’s (1997) previous use of the term β-scale diversity (between-habitat diversity, where community boundaries are crossed and sampling covers more than one habitat or community; used in a recent sponge biodiversity study; Hooper et al. 2002) has been abandoned as a spatial descriptor because β-diversity refers to changes in the identity of species or the spatial turnover of species, along an environmental gradient, such as from site to site (e.g. Gray 2001; Izsak and Price 2001); it is used here in this revised sense. This, then, leaves us with a gap in the terminology for groups of small-scale sites that
Small-scale sponge biodiversity patterns
encompass more than one habitat, or between-habitats, previously referred to by Gray (1997) as β-scale diversity. The term ‘meso-scale diversity’ is used here in the interim. Dichotomous (presence/absence) data were tabulated for each of the ten reefs investigated, providing information on intra-reef (α-scale diversity) and inter-reef differences (meso-scale diversity) in species diversity and levels of ‘apparent endemism’. These data provided information on numbers of species, number and percentage of ‘apparent endemic’ species in each site (Table 1). Collection effort refers to the number of dives made at each site multiplied by the number of divers used for each survey. Collection effort was obviously biased by depth, whereby dive times decrease with increasing depth, but this bias is consistent and definable, and collection effort was standardised accordingly. Median distances between reef sites were calculated using a GIS (geographic information system) mapping tool (BioLink, CSIRO Publishing: Melbourne). To initially test whether species distributions were heterogeneous, Cochran’s Q test (designed specifically for dichotomous variables; Zar 1999) was used. The null hypothesis was that there were no differences in sponge species distributions between different reef sites. Clustering, ordination and biodiversity statistical analyses were then conducted to examine biotic affinities between reef sites and to test hypotheses concerning area relationships and reef connectivity. To estimate faunal similarity between pairs of reefs, we firstly used the Jaccard coefficient or similarity index (a/(a + b + c), where b and c are the total number of species occurring at each reef and a is the number of species shared by both reefs; e.g. Clifford and Stephenson 1975). This index was used in preference to the Greig-Smith index, also known as the Sorensen’s, Dice’s and Bray–Curtis index (2 × a/(b + c)), used in some previous sponge biodiversity studies (e.g. Maldonado and Uriz 1995; Hooper et al. 1999b). Although both indices are apparently appropriate for dichotomous data, and both neglect conjoint absences of species between pairs of sites, the former gives equal weight to shared and non-shared groups of fauna, is semi-metric, the most suitable for presence/absence data and suitable for subsequent extrapolation to ordination spaces such as multi-dimensional scaling (MDS) (Pielou 1977, 1984) (Table 3). Although more widely employed, also metric and excluding conjoint absences, the Bray–Curtis index is not used here because it is more appropriate for semi-quantitative data (Maldonado and Uriz 1995), is conservatively biased when the sampling and number of species at two sites differs significantly (Richer de Forges et al. 2000) and overestimates the importance of shared taxa in the analysis of faunistic similarity (i.e. underestimates the contribution of unique or ‘apparently endemic’ species) (Pielou 1984). Similarity analysis (hierarchical clustering using unweighted group average linkage) was performed on the Jaccard similarity matrix to investigate faunistic relationships among the different sponge communities. Confidence limits for the cluster analysis classification were obtained from bootstrapping routines from PAUP (version 4.0b8; Swofford 2001), with bootstrap values >85% apparently equivalent to 95% confidence limits (Hillis and Bull 1993). PAUP analysis was set to perform a heuristic search with optimality set to distance, negative branch lengths set to zero for tree score calculation, distance measure set to mean character difference, starting tree via neighbour-joining, TBR branch swapping, multrees option, trees unrooted and 1000 bootstrap replicates calculated. Ordination analyses (2-D MDS) were also performed on the Jaccard matrix, with bubble plots used to depict species richness superimposed on MDS ordination space. The contribution of particular species to the observed assemblage differences from both cluster and MDS analyses was investigated using a similarity percentage (SIMPER) routine (Clarke and Warwick 2001), allowing species to be ranked in decreasing order of importance according to the overall percentage contribution each species makes to the average similarity (i.e. defining clusters) and dissimilarity between two groups (i.e. differentiating clusters).
639
Geographic and faunistic distances between pairs of reef sites were further explored using hypothesis tests on variation in biodiversity relationships as an indicator of potential dispersal and connectivity between these α-scale sponge communities. Initially, a regression analysis of all pairwise comparisons between sites was undertaken on tabulated data of distance between each reef site (km) and pairwise β-diversity (calculated as the number of species common to two sites for all pairwise permutations of sites over the total area sampled; e.g. Schlacher et al. 1998). Secondly, the two independent data matrices (pairwise comparisons of the Jaccard similarity index and the pairwise distances between reefs) were compared using a Kendall non-parametric correlation statistic (rho, ρ), which measures the relative degree of agreement or disagreement between pairs of variables, with –1 being perfect disagreement and +1 being perfect agreement. Pairwise comparisons between individual reefs were also examined using a Kendall rank correlation statistic (tau, τ). Thirdly, sites were grouped into classes according to a priori criteria (latitudinal clusters, distances from shore). Non-parametric one-way analyses of similarity (ANOSIM), roughly analogous to standard one-way ANOVA, provided a statistical test of the null hypothesis – that there are no assemblage differences between groups of samples (sites) – and because they are permutation/randomisation tests, they make minimum assumptions and focus on the ranks of the biotic similarity matrices that contain the primary information on assemblage relationships between samples (Clarke and Warwick 2001). According to these authors, the pairwise global R-value is the pivotal statistic because it gives an absolute measure of how separated the groups are, on a scale of 0 (indistinguishable) to 1 (all similarities within groups are less than any similarities between groups). These tests also identify which of the factors (groups of sites) are significantly different from other sites. Finally, a taxonomic distinctness analysis (Clarke and Warwick 2001) was conducted on presence/absence data for species-, genus- and family-level taxa. Taxonomic distinctness, an average measure of the relatedness between any two species in a community sample (Izsak and Price 2001), was measured using two indices: average taxonomic distinctness (AvTD or delta+) and variation in taxonomic distinctness (VarTD or lambda+) (Clarke and Gorley 2001). These indices incorporate taxonomic or phylogenetic information by computing a path length, or relative taxonomic distance, between any two species. They are independent of sampling effort and therefore less susceptible to possible biases from sampling than are species richness indices, including the Jaccard index of similarity (Clarke and Warwick 1998; Warwick and Clarke 1998; Clarke and Gorley 2001; Izsak and Price 2001), and provide effective comparisons of biodiversity between localities at various spatial scales. These indices reflect both the richness in higher taxa and the evenness component of diversity, but are ultimately a function of pure taxonomic relatedness of individuals (Warwick and Clarke 2001). Average taxonomic distinctness is the average taxonomic path length (in a Linnean or a phylogenetic classification) between any two randomly chosen species. The index is most effective for comparing sets of data where there are a restricted number of higher taxa for a given number of species, but is less effective when there is an uneven distribution of species taxa among higher taxa, where some taxa are over-represented and others under-represented in comparison to the species pool for the geographic region (e.g. effects of habitat heterogeneity). Variation in taxonomic distinctness therefore measures the evenness of the distribution of taxa across the hierarchical taxonomic tree, and is also independent of sample size. The two indices used together are considered to be a statistically robust summary of taxonomic relatedness patterns across an assemblage and appropriate to historical data and simple species lists (Warwick and Clark 2001). The null hypothesis tested is that a species list from a particular site, which may be incomplete, nonetheless has the same taxonomic distinctness structure as the master list from which it is drawn (i.e. for all species from all sites in that geographic region)
640
J. N. A. Hooper and J. A. Kennedy
Calculations were performed using several software packages: Primer 5.0 (Plymouth routines in multivariate ecological research) (Primer-E Ltd, Plymouth Marine Laboratory, UK); Statgraphics (STSC Corp., New York, USA); and Systat 9.0 (SPSS Inc., Chicago, USA).
Results Species composition
Fig. 1. Location of reefs sampled off the Sunshine Coast, south-eastern Queensland in the present study (with abbreviated site names) and those studied in other surveys of south-eastern Queensland (mentioned in the text). (Clarke and Gorley 2001). Using a series of randomisation tests that sample the whole data set from the geographic region, repeated for a range of random sample subsets (M = 20–100), a 95% confidence range of possible (‘expected’) values of both AvTD and VarTD was calculated. These probability envelopes (funnel and ellipse functions) were plotted over the real data set for each set of taxa (sites), with samples below or above these intervals representing biodiversity measures below or above expectation respectively. These data were compared at species, genus and family levels. Table 1.
Our various surveys of sponges from the Sunshine Coast region recorded 247 species in 97 genera, 44 families and 14 orders associated with fringing coral reefs, hard (rocky) bottoms and soft bottom substrata. Saenger (1991) and Banks and Harriott (1995) provide more detailed descriptions of the habitats. Of these sponge species, 226 were collected from reefs lying directly off the Sunshine Coast (Fig. 1), and an additional 21 species were collected from the more southern reefs lying off Moreton Island (Hutchinson Shoal and Flinders Reef, approximately 50 km south of the Sunshine Coast reefs). Of the Sunshine Coast reefs 115 species (51%) were ‘apparent endemics’, i.e. restricted to these reefs, and 47 were also previously recorded from the Moreton Bay fauna. Species richness varied considerably between each of the 10 localities (Table 1), ranging from 18 species (Outer Gneering Shoals) to 83 species (Jew Shoal; Fig. 1) (mean 41 species). Only fifteen species were ‘common’, i.e. co-occurred in more than five different sites (or 50% of sites), and can be considered as the ‘typical’ Sunshine Coast fauna: Acanthella cavernosa; Acanthella klethra; Agelas mauritiana; Aplysinella sp. (# 1194); Cliona (Rhaphyrus) hixonii; Dendrilla rosea; Echinoclathria (Echinoclathria) intermedia; Echinodictyum mesenterinum; Halichondria, sp. nov. (#1437); Haliclona sp. (#1381); Ianthella quadrangulata; Leucetta microrhaphis; Raspailia (Clathriodendron) digitatus; Rhabdastrella globostellata; Rhaphidotethya enigmatica; and Trachycladus digitatus. The majority of species (147, or 60%) are ‘rare’, found only from a single reef system (Fig. 2).
Summary statistics for the 10 reefs surveyed for sponges off the Sunshine Coast, eastern Australia, ordered by distance from shore Median coordinates of latitude and longitude are averages from several collection sites on each reef
Locality
North Halls (Nth) Jew Shoal (Jew) Peregian Reef (Per) Mudjimba Island (Mud) Sunshine Reef (Sun) Inner Gneering Shoals (Ing) Flinders Reef (Fli) Outer Gneering Shoals (Out) Murphy's Reef (Mur) Hutchinson Shoal (Hut) Total
Depth range sampled (m)
Median distance from shore (km)
Median latitude (decimal deg. S)
Median longitude (decimal deg. E)
Collecting effort (person dives)
No. species
No. ‘endemic’ species
% ‘endemic’ species
12–24 12–29 12–17 10–16 20–27 10–19 04–20 25–28 25–30 18–28
0.50 1.20 1.20 1.25 3 5 5.50 8.50 9 9
26.205 26.218 26.290 26.367 26.245 26.388 26.586 26.395 26.406 26.560
153.040 153.066 153.060 153.068 153.083 153.095 153.292 153.129 153.141 153.290
08 08 07 14 13 11 14 07 07 07 64
030 083 023 067 067 044 028 018 032 021 247
011 034 009 024 024 014 016 004 006 005 147
37 41 39 36 36 32 57 22 19 24 Mean 34.3%
Small-scale sponge biodiversity patterns
641
Fig. 2. Frequency distribution of sponge species co-occurring in the 10 reef sites.
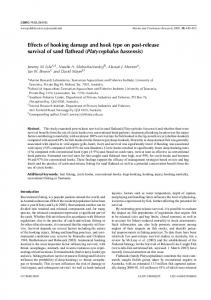
Given the close proximity of some of these reefs to each other, it was initially hypothesised that this observed heterogeneity might be a result of variable collection efforts, such as depth bias where deeper reefs were sampled for a shorter duration than shallow reefs, or differences in person-dives between localities. Superficial comparison of collection effort versus species richness between sites (Fig. 3) indicates that these data may be dependent (i.e. the increase in species richness corresponds to an increase in collection effort for a particular site), but regression analyses show that correlations were not statistically significant (R2 = 0.1987, P > 0.05; Fig. 3A). Removal of the two extreme data points from the analyses (the most diverse site, Jew Shoal, and the least diverse site, Flinders Reef) (Fig. 3B) produced a highly significant correlation (R2 = 0.9406, P < 0.0001), inferring that species richness was not completely dependent on collection effort. Other factors, such as local (small-scale) environmental differences between reefs (geomorphology, water quality, substrate type, etc.), may also influence sponge species composition and richness, even at the small scale (point- and α-scales of diversity). However, it is presently impossible to separate the relative contribution of these factors without accompanying data on species’ abundances (which are not routinely acquired during museum biodiversity surveys where the ultimate aim is to maximise discovery of new taxa using the most efficient collection effort). Species richness was generally lowest on the outer-most reefs (5.5–9 km from nearest shore) and some of the innermost reefs (0.5–1.25 km) (Table 1), with some innerand both the mid-shelf reefs (3–5 km) containing the richest faunas. To some extent, these trends correlate with physical
Fig. 3. A, Regression analysis of species diversity against collection effort (person dives) for all 10 reef sites (R2 = 0.1987, P > 0.05); B, regression analysis for eight reef sites, the most diverse and least diverse sites (Flinders Reef and Jew Shoal) are excluded from analysis (R2 = 0.9406, P < 0.0001). (Refer to Fig. 1 for key to abbreviated site names.)
differences between reefs and proximity to the coast, whereby outer reefs (Outer Gneering Shoals, Hutchinson Shoal, Flinders Reef, Murphy’s Reef) have a relatively low diversity of habitats (mostly hard corals) and relatively uniform topography (i.e. they are either completely flat or have only slight slope). Similarly, two of the inner reefs (Peregian Reef and North Halls) are situated closer to river outflows with consequent higher impacts from turbidity and siltation. Reefs with the highest species richness (two inner reefs, Mudjimba Island and Jew Shoal; and two middle reefs, Inner Gneering Shoals, Sunshine Reef) also have a greater diversity of habitat types and rugged topography (i.e. containing habitats with overhangs, caves, gullies, greater slope etc.), providing refuge to cryptic taxa such as the encrusting and sciaphilic communities. This is especially true of Jew Shoal, which has the highest species richness and greatest variability in bottom topography. Although this site is also in proximity to the Noosa River, it is not directly in its path, as is the case for North Halls, where the heterotrophic filter-feeding sponge community potentially benefits from the higher nutrient river discharge. Both these reefs had identical collection effort but the former had nearly three times species richness (Table 1). These hypotheses about changes in community patterns along two environmental gradients (latitude of sites and their distance from the coast) are specifically tested further below.
642
J. N. A. Hooper and J. A. Kennedy
Fig. 4. Regression analysis of species richness against the number of unique species collected from each reef site (R2 = 0.8998, P < 0.0001). (Refer to Fig. 1 for key to abbreviated site names.)
Generally, ‘apparent endemism’ (numbers of unique species found at a particular site), appears to be closely related to the total species richness at each site, such that the effects of the two parameters could not be differentiated reliably (R2 = 0.8998; P < 0.0001; Fig. 4). In other words, although middle- and some inner-reef sites had highest ‘apparent endemism’, they also contained the greatest numbers of species compared with other inner- and the outer-reefs. An exception is Flinders Reef, which had comparatively low species diversity but high levels of ‘apparent endemism’, and in this case its unique fauna may partially be a result of its more southerly, isolated location, more closely connected to the Moreton Bay faunas than to those of the Sunshine Coast. Unfortunately, no abundance data were collected to test whether species accumulation curves were saturated (reaching an asymptote), to ascertain the impact of potential sampling bias on unique species versus total numbers of species at each site. These data also indicate that unique or rare species may significantly bias biodiversity estimates when applied to small (α-scale)
faunas (point collection data and single reef systems). The significant contribution of rare or unique species to small-scale faunas is illustrated by their frequency distributions (Fig. 2), showing that of the 247 species collected from 10 sites, 81% (202 species) are ‘unique’ or ‘rare’, occurring in only one or two sites, and only 19% (45 species) are found in three or more sites. Hence, the 147 (60%) ‘apparently endemic’ species (i.e. found only in one site) do not contribute to biodiversity models using similarity analyses, with analyses based on affinities between sponge communities solely dependent on information from the 100 species that occur at two or more sites. To some extent, these questions are answered using the non-parametric taxonomic distinctness analysis, below. Community classification Sponge community structure (mean diversity) differed significantly over all reef sites (ANOVA, F = 65.337, d.f. = 10,237, P < 0.0001; Cochran’s Q statistic = 133.25, P < 0.0001). Cluster analysis of reef sites (Fig. 5) based on Jaccard similarity matrix (Table 2) yielded three groups, although bootstrapping support for branch dichotomies was low (36%, 48%, 23%), probably reflecting the high proportion of ‘unique’ or ‘rare’ species on all reefs (mean value of 34% ‘apparent endemism’ for all reefs). The outer reefs (Group 1 cluster) are most similar, with the southern reefs of Flinders and Hutchinson having strong bootstrap support, and the Outer Gneerings less similar within this group. This pattern is also reflected in the MDS ordination (stress of configuration 0.15, proportion of variance (RSQ) = 0.804; Fig. 6, with higher species richness represented by larger bubbles). The Outer Gneerings Shoals is closest and most similar in depth and habitat profile to Murphy’s Reef (Fig. 1) (Table 1), yet surprisingly both cluster and MDS show they are dissimilar in both species richness and
Table 2.
Similarities in composition of sponge species between 10 reef sites off the Sunshine Coast, eastern Australia Pairwise comparisons between sites show numbers of co-occurring species (upper half of matrix, roman text) and percentage similarity between faunas (lower half of matrix, italic text); the latter are based on the Jaccard similarity index. Species richness at each site is shown in bold (numbers in diagonal row) Locality North Halls (Nth) Jew Shoal (Jew) Sunshine Reef (Sun) Peregian Reef (Per) Mudjimba Island (Mud) Inner Gneerings (InG) Murphy’s Reef (Mur) Outer Gneerings (Out) Hutchinson Reef (Hut) Flinders Reef (Fli)
Nth
Jew
Sun
Number of shared species Per Mud InG Mur
30.99 11.99 08.99 02.88 10.78 83.88 22.99 08.77 08.99 17.19 67.88 02.77 03.92 8.16 02.27 23.88 11.49 13.64 15.52 05.88 05.71 11.40 09.90 01.52 06.90 13.86 12.50 07.84 04.35 07.45 11.84 02.50 04.08 07.22 04.76 02.33 01.75 03.74 03.26 00.00 Jaccard similarity index (%)
10.88 18.77 18.77 05.88 67.00 13.27 07.61 08.97 07.32 02.15
04.99 13.99 10.99 01.88 13.99 44.66 04.11 01.64 10.17 02.86
04.77 14.88 11.66 04.88 07.55 03.77 32.66 02.04 06.00 05.26
Out 02.66 07.88 09.88 01.77 07.66 01.66 01.66 18.66 05.41 04.55
Hut
Fli
02.88 07.88 04.77 01.66 06.66 06.66 03.66 02.77 21.66 16.67
01 04 03 00 02 02 03 02 07 28
Small-scale sponge biodiversity patterns
643
}
Group 1
}
Group 2
} Group 3 Fig. 5. Cluster analysis of similarities between sponge communities on the Sunshine Coast (Jaccard similarity index). Numbers refer to bootstrapping (from PAUP), where 85% is roughly equivalent to 95% confidence limits. (Refer to Fig. 1 for key to abbreviated site names.)
Fig. 6. Multi-dimensional scaling (MDS) ordination of similarity matrix (Jaccard index) for sponge communities on the Sunshine Coast (refer to Fig. 1 for key to abbreviated site names). Final stress of configuration = 0.15; proportion of variance (RSQ) = 0.804. Bubble plots depict species richness at each site.
taxonomic composition, with Murphy’s Reef being more similar to the inshore Peregian Reef (with 50% bootstrap support; Fig. 5) (Group 3 cluster), although this trend is not so strong in ordination space (Fig. 6). The middle cluster (Group 2) has very low bootstrap support (23%; Fig. 5), with sites not showing any strong affinities in ordination space (Fig. 6), and with North Halls and the Inner Gneerings relatively more dissimilar than the other three reefs (Mudjimba Island, Jew Shoal, Sunshine Reef) – the latter supported by 42% and 62% bootstrapping respectively. Multi-dimensional scaling ordination of this group is more informative (Fig. 6), with the likelihood that the former two reefs should be excluded from this similarity cluster (this is tested further below). Interestingly, MDS ordination patterns were identical irrespective of whether the Jaccard or Bray–Curtis indices were used, although percentage
Fig. 7. Regression of β-diversity (number of species common to two sites for all pairwise permutations of sites over the total area sampled) in relation to distance (km) between reefs, from pairwise comparisons between each reef system (R2 = 0.1127, P = 0.011).
similarities were significantly higher using the Bray–Curtis index (data not shown). Patterns of sponge community structure between reef sites (measured as the number of species common to two sites for all pairwise permutations), was not uniformly related to the distance between reefs, such that the most adjacent reefs do not, on average, have the most similar faunas (R2 = 0.1127, P > 0.01; Fig. 7). In some cases, there is an obvious relationship between faunal similarity and proximity between reefs, such as between the adjacent reefs of Jew Shoal and Sunshine Reef, only 2.5 km apart, as evidenced by both cluster and MDS analyses (Figs 5, 6), in which case there is clearly some level of connectivity between their respective faunas. In other cases the inverse is true, such as the adjacent reefs of Inner Gneerings and Outer Gneerings Shoals, only 1.1 km apart, which have low faunal similarities and which is presumably indicative of some significant environmental and/or geomorphological differences between these two reef sites. These conclusions are supported by the less powerful but possibly also less
644
J. N. A. Hooper and J. A. Kennedy
Table 3.
Summary of correlation analysis testing sponge faunal affinities between pairs of reef sites off the Sunshine Coast, eastern Australia Pairwise comparisons between sites show median distances between each reef (upper half of matrix, roman text) and Kendall rank correlation coefficient (upper numeral) and significance level (italicised lower numeral, lower half of matrix), with sample size = 247 for all sites. Species richness at each site is shown in bold (numbers in diagonal row) Locality North Halls (Nth) Jew Shoal (Jew) Sunshine Reef (Sun) Peregian Reef (Per) Mudjimba Island (Mud) Inner Gneerings (InG) Murphy's Reef (Mur) Outer Gneerings (Out) Hutchinson Reef (Hut) Flinders Reef (Fli)
Nth
Jew
Sun
30 2.600 5.100 9.500 18.6000 21.0000 0.0241 83 2.500 6.900 16.0000 18.4000 0.7053 –0.0038 –0.0099 67 4.400 13.5000 15.9000 0.9520 0.8764 –0.0338 0.0080 –0.1328 23 9.1000 11.5000 0.5955 0.9001 0.0372 0.0519 –0.0485 –0.0036 –0.0388 67000 2.4000 0.4155 0.4471 0.9554 0.5426 –0.0435 –0.0400 –0.0461 0.0491 0.0491 44 0.4155 0.5305 0.4701 0.4409 0.4409 0.0042 0.0829 0.0629 –0.0184 –0.0851 –0.0851 0.9477 0.1937 0.3238 0.7724 0.1820 0.1820 –0.0089 0.0314 0.1442 0.0742 –0.0898 –0.0898 0.8892 0.6227 0.0237 0.2447 0.1589 0.1589 –0.0245 –0.0017 –0.0227 –0.0477 0.0426 0.0857 0.7012 0.9782 0.7214 0.4541 0.5044 0.1789 –0.0939 –0.1462 –0.1320 –0.1146 –0.1320 –0.0997 0.1410 0.0218 0.0384 0.0723 0.0384 0.1178 Kendall rank correlation coefficient (and significance level)
Table 4. Global R-values and significance levels for analysis of similarity (ANOSIM) tests, comparing groups of sites arranged a priori by site characteristics Group A, Latitude B, Distance from coast C, Latitude + distance
Median distance between reefs (km) Per Mud InG Mur
Global R value
Significance level
0.14 0.19 0.63
21.7% 13.8% 06.4%
A, Latitude (northern, central and southern reefs); B, distance from coast (inner, mid and outer reefs); C, combined latitude and distance from coast (northern inner, northern mid, northern outer and southern outer reefs).
biased non-parametric Kendall rank correlation statistic (ρ = –0.263, P > 0.025), which found that in fact only six pairs of reef sites had any significant positive or negative correlation between them with regard to their relative proximity and similarity in species composition. Sites showing negative correlation were Peregian Reef v. Sunshine Reef, and Flinders Reef v. Jew Shoal, Sunshine Reef and Mudjimba. Sites showing positive correlation were the Outer Gneering Shoals v. Sunshine Reef, and Flinders Reef v. Hutchinson Reef; Table 3). Analysis of Similarity (ANOSIM) found no significant differences in faunal similarity between sites grouped according to their latitudinal position (i.e. northern, central and southern reefs; global R = 0.14, P = 0.217), or distance from the coast (i.e. inner, mid and outer reefs; global R = 0.19, P = 0.138), that were not greater than within-group
Out
Hut
Fli
24.3000 21.7000
22.1000 19.5000
46.1000 43.5000
49.3 46.7
19.2000
17.0000
41.0000
44.2
14.8000
12.6000
36.6000
39.8
5.7000
3.5000
27.5000
30.7
3.3000
1.1000
25.1000
28.3
32
2.2000
21.8000
25.0
–0.0618 0.3326 0.0121 0.8498 –0.0239 0.7082
18
24.0000
27.2
0.0262 0.6808 –0.0020 0.9751
21
03.2
0.2115 0.0009
28
similarities. By comparison, when sites were grouped using both factors there were slightly more significant differences between sites (global R = 0.33, P = 0.064), particularly between the southern outer reefs (Flinders and Hutchinson) and the northern inner reefs (North Halls, Jew, Peregian, Mudjimba) (R = 0.821, P = 0.067; Table 4; Fig. 8). A posteriori grouping of sites based on latitude and distance criteria produced four ‘meso’-scale faunas (northern-inner, northern-mid, northern-outer and southernouter reefs). Similarity percentage (SIMPER) analysis showed that only a relatively small proportion of species common to all pairwise comparisons within and between these sites were significant contributors to their similarities (Table 5) (i.e. defining within-group similarities), or dissimilarities (Table 6) (i.e. differentiating between groups), with groups determined by both cluster (Fig. 5) and MDS analyses (Fig. 6). Not surprisingly, many of these species that both define and differentiate the cluster groups are also the most ‘typical’ species for the Sunshine Coast reefs. In other words, the contribution of the 60% of ‘rare’ species in defining and differentiating these ‘meso’-scale faunas is negligible. Taxonomic distinctness analyses For species-level taxa (Fig. 9A–B) most sites fall within the 95% predicted range for average taxonomic distinctness (AvTD, or delta+), with only Flinders Reef (highest
645
Frequency
Frequency
Frequency
Small-scale sponge biodiversity patterns
R
Fig. 8. Frequency histograms of analysis of similarity (ANOSIM) tests, comparing groups of sites arranged a priori by site characteristics. A, Latitude (northern, central and southern reefs); B, distance from coast (inner, mid and outer reefs); C, combined latitude and distance from coast (northern inner, northern mid, northern outer and southern outer reefs). Refer to Table 4 for global R-values and significance levels.
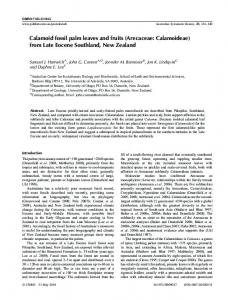
distinctness) and Mudjimba Island (lowest distinctness) deviating from the general area pattern. By comparison, Flinders is under-represented and Mudjimba is over-represented in terms of habitat heterogeneity (or unevenness), as measured by variation in taxonomic distinctness (VarTD, or lambda+): the former the least heterogenous and the latter the most heterogeneous. Both these sites, for both indices, are statistically significant (P < 0.002 and 0.01 for Flinders, P < 0.042 and 0.006 for Mudjimba, for AvTD and VarTD respectively). The simulated means (dashed lines, Fig. 9A–B) are also close to the master list values of 94.8 (AvTD) and 191 (VarTD), reflecting independence of the statistic on differing sample size between sites (Warwick and Clarke 1998). At the genus level (Fig. 9C–D), only Flinders Reef deviates from the expected null distribution (P < 0.008 (AvTD) and 0.028 (VarTD)). At the family level (Fig. 9E–F), Flinders Reef, again, is significantly different (P < 0.032 (AvTD) and 0.02 (VarTD)), as is Peregian Reef (P < 0.013 (AvTD) and 0.019 (VarTD)), the latter result suggesting that the distribution of samples within family groups at Peregian Reef differs significantly from the geographic region in general. Two-dimensional plots of 95% probability ellipses from the simulated distribution (for sampling subsets M = 20–100), with real values of the AvTD and VarTD pairs superimposed
within probability ellipses (Fig. 10), show that for species-level taxa, all faunas lie within the M = 50 simulation envelopes, except Flinders (well outside the M = 30 envelope), and Peregian and Mudjimba (outside M = 50). These data simply reflect the higher taxonomic distinctness (AvTD) and unevenness (VarTD) of Flinders Reef, and the converse for Mudjimba and Peregian Reefs. For genus-level taxa, the Flinders Reef fauna is again exceptional (with Peregian marginal), whereas for family-level taxa only Peregian Reef lies outside of the 95% contour at M = 20 owing to the highly uneven taxonomic distribution of its fauna, as noted earlier. Thus, with the exception of Flinders Reef at the species and genus level, and Peregian Reef at the family level, the modelled 95% probability contour is a reasonable fit for these sponge faunal distributions. Discussion Sunshine Coast benthic faunas and their biogeographic affinities The Sunshine Coast benthic fauna is rich (Banks and Harriott 1995), although its taxonomic description is still rudimentary in comparison with the adjacent, better-known Moreton Bay region and the southern Great Barrier Reef. Existing collections from this region far exceed taxa
646
J. N. A. Hooper and J. A. Kennedy
Table 5. Summary of similarity percentage (SIMPER) analysis, ranking species according to the overall percentage contribution each makes to the average within-group similarity (i.e. contributing to defining groups from cluster (Fig. 5) and multi-dimensional scaling (MDS) analyses (Fig. 6)) Cluster and MDS group
Sites included
A. Northerninner reefs
No. Species that contribute >95% similarity spp. to define within-group similarity (% contribution) in group
No. spp. contributing significantly to within-group similarity (% contribution)
North Halls (Nth), 16.75% Jew Shoals (Jew), Peregian Reef (Per), Mudjimba Island (Mud)
149
35 (95% similarity) (11 spp accounting for 55.1% similarity)
B. Northernmid reefs
Sunshine Reef (Sun), Inner Gneering Shoals (Ing)
18.02%
101
C. Northernouter reefs
Murphys Reef 28.57% (Mur), Outer Gneering Shoals (Out) Flinders Reef (Fli), 28.57% Hutchinson Reef (Hut)
049
D. Southernouter reefs
Average withinsite similarity
028
Cliona (Rhaphyrus) hixonii (7.39%), Psammocinia sp. #1407 (5.41%), Haliclona sp. #1381 (5.41%), Raphidotethya enigmatica (5.14%), Raspailia (Clathriodendron) digitatus (5.14%), Raspailia (Raspaxilla) sp. #1081 (5.14%), Phakellia cavernosa (5.14%), Echinodictyum mesenterinum (5.14%), Aplysinella sp. #814 (5.14%), Hyattella sp. #2763 (3.75%), Dysidea sp. #1400 (2.21%) Trachycladus digitatus (10%), Siphonochalina sp. #2672 (10%), Raphidotethya enigmatica (10%), Phakellia klethra (10%), Euryspongia deliculata (10%), Dysidea sp. #2669 (10%), Cribrochalina sp. #2666 (10%), Cinachyrella sp. #180 (10%), Agelas sp. #2480 (10%), Aplysinella sp. #1194 (10%) Haliclona sp. #1381 (94.6%), Strongylacidon sp. #2900 (2.4%), Stylinos sp. #252 (1.5%), Stylotella sp. #2514 (1.5%)
10 (100%)
4 (100%)
Rhabdastrella globostellata (14.29%), Myrmekioderma 7 (100%) granulata (14.29%), Erylus amissus (14.29%), Desmapsamma sp. #1125 (14.29%), Cliona sp. #2337 (14.29%), Cribrochalina sp. #2178 (14.29%), Agelas mauritiana (14.29%)
formally described in the literature (QM database). This rich fauna is a product of mixing of biota from the major northern (Solanderian) and southern (Peronian) biogeographic provinces, as well as a suite of endemic species (e.g. Davie and Hooper 1998; Davie 1998). There is also an observed depth stratification of tropical and temperate faunas in shallow and deeper waters on many reefs off the greater Brisbane area respectively (J. N. A. Hooper, personal observation). With the possible exception of algae and scleractinian corals, much remains to be done to achieve anything approaching a comprehensive inventory of its biota. Some pertinent literature includes: macroalgae (Cribb and Cribb 1985; Saenger 1991; HERBRECS in Dennison and Abal 1999); sponges (Hooper 1991, 1996; Hooper et al. 1999b); coralliomorpharians, actiniarians and zoantharians (Carlgren 1950; Richardson et al. 1997); hydroids (Pennycuik 1959); scleractinian corals (Wallace 1978; Veron 1993; Banks and Harriott 1995); and ascidians (Kott 1985, 1990, 1992) (with additional literature cited in Davie and Hooper 1998). A few studies have also explored community structure of these reefs. Banks and Harriott (1995) determined patterns of scleractinian coral distributions (and also reworked Saenger’s 1991 macroalgae dataset), delineating four communities with different faunal patterns: (1) off-shore
(Murphy’s Reef and Outer Gneering Shoals); (2) near-shore (Point Cartwright); (3) sites intermediate between near-shore and off-shore (Inner Gneering Shoals and Maroochy Reef); and (4) Mudjimba Island (refer to these localities marked in Fig. 1). They also found that coral and algal species diversity at the Inner Gneerings was lower than that on Flinders Reef, and also the southern Great Barrier Reef (about 300 km to the north). Algae contributed most to benthic cover at the majority of these sites, and the dynamics of the algal community was apparently a key determinant for the whole of their community classification. Richardson et al. (1997) found for subtropical giant anemones that offshore sites generally had comparatively higher species diversity than in-shore sites, and that diversity was lower on reefs off the Sunshine Coast than those further to the north, in the tropics. Similarly, patterns of change (or β-diversity) and biogeographic affinities of the sponge communities were explored by Hooper et al. (1999b) for 18 ‘meso’-scale faunas (clustered groups of α-scale communities), extending from Sydney (34°S, 151°E) to the Gulf of Carpentaria (11°S, 141°E), and including some sites on the Sunshine Coast. They delineated six distinct regional (or γ-scale) sponge faunas in NE Australia. Most of the 18 ‘meso’-scale faunas contained relatively high proportions (mean 33%) of ‘apparently endemic’ species (i.e. species found in only one
Small-scale sponge biodiversity patterns
647
Table 6. Summary of similarity percentage (SIMPER) analysis, ranking species according to the overall percentage contribution each makes to the average between-group dissimilarity (i.e. their proportional contributions to differentiating ‘meso’-scale groups, as defined by cluster (Fig. 5) and multi-dimensional scaling (MDS) analyses (Fig. 6)) Refer to Table 4 for key to group and site nomenclature Pairwise group comparisons
Average group dissimilarity
Species contributing most to defining between-group similarity (% contribution)
No. spp. accounting for between-group dissimilarity (% dissimilarity)
A v. B
82.92%
12 (12.8%)
A v. C
85.61%
A v. D
92.66%
B v. C
86.37%
B v. D
89.58%
C v. D
89.93%
Siphonochalina sp. #2672 (1.22%), Euryspongia deliculata (1.22%), Dysidea sp. #2669 (1.22%), Cinachyrella sp. #180 (1.22%), Agelas sp. #2480 (1.22%), Phakellia klethra (1%), Cribrochalina sp. #2666 (1%), Aplysinella sp. #1194 (1%), Cliona (Rhaphyrus) hixonii (0.97%), Psammocinia sp. #1407 (0.86%), Raspailia (Raspaxilla) sp. #1081 (0.83%), Aplysinella sp. #814 (0.83%) Psammocinia sp.#1407 (1.21%), Hyattella sp.#2763 (1.16%), Raphidotethya enigmatica (1.13%), Raspailia (Clathriodendron) digitatus (1.13%), Raspailia (Raspaxilla) sp.#1081 (1.13%), Phakellia cavernosa (1.13%), Aplysinella sp.#814 (1.13%), Spirastrella vagabunda (0.98%), Plakinastrella sp.#2677 (0.98%), Ircinia wistari (0.98%), Euplacella sp.#2675 (0.98%), Cliona sp.#2676 (0.98%) Myrmekioderma granulata (1.61%), Erylus amissus (1.61%), Desmapsamma sp.#1125 (1.61%), Cliona sp.#2337 (1.61%), Cribrochalina sp.#2178 (1.61%), Cliona (Rhaphyrus) hixonii (1.32%), Psammocinia sp.#1407 (1.12%), Haliclona sp.#1381 (1.12%), Rhabdastrella globostellata (1.07%) Trachycladus digitatus (1.48%), Siphonochalina sp.#2672 (1.48%), Raphidotethya enigmatica (1.48%), Euryspongia deliculata (1.48%), Dysidea sp.#2669 (1.48%), Cribrochalina sp.#2666 (1.48%), Cinachyrella sp.#180 (1.48%), Agelas sp.#2480 (1.48%), Aplysinella sp.#1194 (1.48%) Trachycladus digitatus (1.43%), Rhabdastrella globostellata (1.43%), Siphonochalina sp.#2672 (1.43%), Phakellia klethra (1.43%), Myrmekioderma granulata (1.43%), Euryspongia deliculata (1.43%), Dysidea sp.#2669 (1.43%), Erylus amissus (1.43%), Desmapsamma sp.#1125 (1.43%) Haliclona sp.#1381 (2.3%), Erylus amissus (2.3%), Desmapsamma sp.#1125 (2.3%), Cliona sp.#2337 (2.3%), Cribrochalina sp.#2178 (2.3%), Xestospongia testudinaria (1.32%)
of the 18 regions), with geomorphology and biogeographic factors suggested to be largely responsible for inter-regional differences. Of the Sunshine Coast sites, they reported a fauna consisting of 106 species, of which 35 species (33%) were ‘apparent endemics’. Not surprisingly, the fauna was most similar in terms of species composition to the adjacent Moreton Bay region, with 13% (31) of species shared from a combined fauna of 241 species (approximately 10% Jaccard similarity). On this basis, the two regions were subsequently combined into a single ‘Moreton Bay Provincial fauna’ (Hooper et al. 1999b). Subjectively, however, these data were questioned by the authors given some substantial differences between the Sunshine Coast and Moreton Bay regions in terms of the diversity, environmental conditions and geomorphologic structures of their marine habitats, irrespective of their relatively close proximity (i.e. potential connectivity between their faunas). From the present data we suggest that the high levels of ‘apparent endemism’ of sponges observed on Sunshine Coast reefs, and relatively low similarities with adjacent regions, indicate that this sponge fauna is only marginally more closely related to the Moreton Bay province than with other coastal and reef
12 (12.9%)
09 (12.7%)
09 (13.3%)
09 (12.85%)
06 (12.84%)
faunas further to the north and south, and there is probably no justification to combine their faunas into a single homogeneous marine area (i.e. only 19% of species from the Sunshine Coast reefs are also found in Moreton Bay (11% Jaccard similarity; present data), 7% are found in the coastal fauna from the Fraser Island–Hervey Bay region (6% Jaccard similarity; Hooper et al. 1999b), 7% in the Capricorn–Bunker Group fauna, southern Great Barrier Reef (6% Jaccard similarity; Hooper et al. 1999b), and 9% further south in the Tweed River–Byron Bay region (8% Jaccard similarity; Hooper et al. 1999b). Sponge biodiversity The present study more than doubles the region’s known sponge diversity (247 species) with an additional 141 species discovered since the earlier study (Hooper et al. 1999b), and reveals significantly higher levels of spatial heterogeneity between reefs at the α-scale than previously acknowledged for sponges within the Indo-west Pacific fauna (e.g. Wilkinson 1983, 1988; Wilkinson and Cheshire 1989; Hooper 1994; Hooper et al. 1999b), although also recently reported for a Caribbean sponge fauna (Zea 2001). Of these
648
J. N. A. Hooper and J. A. Kennedy
Fig. 9. Probability funnels (95% confidence interval) of average taxonomic distinctness (delta +) and variation in taxonomic distinctness (lambda +) values for species-level (A–B), genus-level (C–D) and family-level taxa (E–F). Dotted lines indicate the simulated mean value from 5000 random selections from the master list of 247 species for each sublist (M = 10–100). Intervals within which 95% of the simulated values lie are represented by a probability funnel (solid lines).
species, 115 (51%) are so far only known from this region (consisting mostly of the rare species found from single sites), with 47 (19%) of species also occurring in the Moreton Bay fauna. This level of ‘apparent endemism’ is exceptional compared with the lower proportion of endemic taxa of other phyla known from this region (e.g. Davie and Hooper 1998), but is possibly over-inflated given that some of these ‘apparently endemic’ taxa are periodically discovered elsewhere throughout tropical Australasia as our ongoing surveys become more comprehensive (but see Hooper et al. 1999b, 2002), and it is anticipated that this number might decrease to about 30% ‘apparent endemism’, as a median observation for many other sponge faunas in the Indo-west Pacific (e.g. Hooper and Lévi 1994; Hooper et al. 2000). Patterns of similarities in taxonomic composition between reefs were not generally related to the distance between them, such that the most adjacent reefs often did not have the most similar faunas. Other environmental gradients appear to be more significant to community patterns of richness, endemism and taxonomic affinities. To some extent, species richness is inversely correlated with distance from the nearest shore, where the outer-most reefs (5.5–9 km from the coast) contain lower species richness than the mid-shelf reefs (1.25–5 km) and some of the inner reefs (0.5–1.25 km) (although one inner reef, Jew Shoals, was also the richest, another inner reef, North Halls, was the least rich of reefs with comparable collection effort). This pattern was also partially evident from similarity analyses (clustering, MDS) of taxonomic composition between sites, with three groups of faunas delineated. Outer-reef sites were well
differentiated from the others, but the inner- and middle-reef site clusters were not fully resolved, nor was there complete agreement between clustering and MDS ordination of these latter data. By comparison, neither numerical similarity data nor non-parametric analyses (ANOSIM) found any significant patterns or trends in β-diversity based on latitudinal gradients, although this is probably not unexpected given that the most distant reefs were only about 50 km apart. However, when sites were grouped by both latitude and distance from the coast, there were slightly more significant differences in taxonomic composition between some groups, the southern outer reefs (Flinders and Hutchinson) and the four northern inner reefs in particular, with a gradual gradient of dissimilarities for reefs intermediate between these two groups of sites. This pattern may partially reflect that these two groups of reefs are also the most distant from each other, but it is also likely that they are a result of the different prevailing environmental conditions. Some of these include geomorphology and physico-chemical differences between sites. The outer-most reef sites are dominated by hard corals, have flatter reef topography and probably clearer waters (this latter assumption has not yet been empirically tested). The innermost reef sites are situated closer to river discharge with higher impacts from siltation and turbidity. Both groups of sites have lowest species richness, whereas the middle-reef sites have conditions intermediate to these and highest richness. An anomaly to this pattern is Jew Shoals, an inner-reef site, with the highest richness and comparable collection effort to other sites. It is hypothesised that its location in proximity to, but not in the path of the Noosa
Small-scale sponge biodiversity patterns
Fig. 10. Average taxonomic distinctness (delta +) and variation in taxonomic distinctness (lambda +) plots of species-level (A), genus-level (B) and family-level (C) taxa for reef sites, superimposed on 95% probability ellipses from simulated data for each sublist (M = 20–100). Number of species in each site is indicated in brackets.
River may benefit its heterotrophic sponge community through higher nutrient discharge, without the more severe impacts of scouring, turbidity and siltation that may occur for reefs in the direct path of the river (e.g. North Halls). There is now a significant body of literature in which many deterministic and stochastic processes have been used to explain observed heterogeneity among sponge communities. These include terrestrial influences (such as impacts of freshwater runoff, nutrient levels, turbidity etc.), geomorphological differences between reefs (microhabitat availability, aspect of seabed, exposure to waves and currents etc.), and random events (such as patterns and timing of arrival and survival of larvae and asexual propagules, effects of severe storm events on fragmentation and dispersal etc.). Of relevance here are the reports on environmental gradients across the shelves of the Great Barrier Reef and Spermonde Archipelago, Indonesia (Wilkinson 1983; Wilkinson and Evans 1989; Wilkinson and Cheshire 1989; de Voogd et al. 1999), temperate reefs in south-eastern Australia (Roberts et al. 1994; Roberts and Davis 1996), coral reefs in the
649
Caribbean (reviewed in Zea 2001) and soft bottom communities in the Indian Ocean (Van Soest 1993). The studies of Wilkinson et al. (listed above) found that inner reefs (approximately 20 km from the coast) had highest richness and biomass, middle reefs had highest abundance and outer reefs (up to 200 km from shore) were poorest in sponge diversity. However, their inner reefs are probably more closely comparable to our middle reefs in terms of proximity to the coast and terrestrial influences on the marine fauna. Their studies are also not directly comparable to the present data or to the findings of Hooper et al. (1999b) given that they surveyed only the highly visible, largely phototrophic sponge fauna, ignoring the many hundreds of other megabenthic, cryptic and heterotrophic species present in each reef system. De Voogd et al. (1999) also observed that sponge species richness and abundance increased with distance from shore, up to about 20 km offshore, and then decreased in outer reefs (40 km from the coast). These and other authors (e.g. Roberts and Davis 1996) also noted a positive correlation between species richness and abundance with increasing depth. Wilkinson and Cheshire (1989) and de Voogd et al. (1999) hypothesised that excessive turbulence and light may be responsible for the depth-related environmental gradient, owing to factors such as higher nutrient levels and lower wave action in near-shore waters, and with communities further from the coast, in the clearer, more oligotrophic conditions, dominated more by phototrophic species. In Caribbean coral reefs, at least, this bathymetric gradient reverses at about 40–60 m depth (Lehnert and Fischer 1999), depending on light penetration through the water column from site to site, where sponge diversity decreases and taxonomic composition changes significantly with increasing depth. There are as yet no directly comparable ecological studies of sponge β-diversity across similar depth profiles for tropical Indo-Pacific reefs, but studies of temperate sponge populations in south-eastern Australia (intertidal to 50 m depth) found that species richness increased with depth, abundance decreased and growth forms became increasingly erect in deeper waters (Roberts et al. 1994; Roberts and Davis 1996). This was suggested to be a result of differences in habitat micro-topography related to exposure to wave energy, turbulence and siltation. Zea (2001) found weak correlation between environmental variables and the observed heterogeneity in sponge community structure on three isolated Caribbean seamounts, but reported that most sponges had strong habitat preferences despite patchy α-scale (within-habitat) distributions. Van Soest (1993) suggested changes in species composition and abundance of soft bottom sponge communities of the Mauritian shelf were partly a result of restricted larval dispersal imposed by mud barriers separating adjacent sites, and Uriz et al. (1998) showed that differences in the distribution of particular species in the Mediterranean were related to the dispersal
650
ability of their respective larvae. Zea (1993, 2001) further suggested that small-scale random factors related to larval dispersal and settlement in Caribbean sponge communities were also pivotal to unexplained heterogeneity among these communities. Small-scale endemism Small-scale endemism is less widely reported in the sponge literature, perhaps in part due to the appalling difficulties associated with sponge taxonomy, such as the uncertainty of conspecificity when comparing faunas described by different authors, especially from literature published over several generations (Hooper and Van Soest 2002), and also in part because marine taxonomists tend to describe faunas at larger spatial scales (e.g. biogeographic provinces), compared with many ecological studies for example. Over the last two centuries, taxonomic collections made at pointand α-scales were frequently (mis-)interpreted as being ‘representative’ of faunas over much larger spatial scales. For example, for many decades the Low Isles sponge fauna (Cairns Sector, Great Barrier Reef) was considered to be ‘typical’ of the entire Great Barrier Reef, until a comprehensive survey (Hooper et al. 1999a) found that only 23% of species were ‘typical’ (from a fauna of 134 species): 48% were found only in the northern Great Barrier Reef and 32% were ‘apparent endemics’ to this α-scale fauna. As the geographic gaps in our knowledge of Indo-Pacific marine biodiversity are gradually being filled, we have increasingly recognised both high spatial heterogeneity (richness and abundance) and ‘apparent endemism’ among and between sponge faunas, even at small spatial scales. On the Sunshine Coast reefs the contribution of unique or rare species to local or small-scale patterns in sponge biodiversity is considerable; up to 60% of species are found only on one or two reefs. As previously noted, this proportion of rare species is expected to fall over time as further sponge surveys of tropical Australasia are completed, but nevertheless this proportion is exceptional and may reflect the unique biogeographic transition zone in the Moreton Bay region, with mixing and potential hybridisation of Solanderian and Peronian faunas (Davie and Hooper 1998). Species that contributed most to defining ‘meso’-scale faunas (i.e. α-scale faunas grouped according to various factors) were also the most common or ‘typical’ of the whole Sunshine Coast fauna. Northern-inner reefs had only 11 species accounting for over 50% of their similarity (from a combined ‘meso’-scale fauna of 149 species); northern-mid reefs had 10 species accounting for 100% similarity (with a total fauna of 101 species); northern-outer reefs had only four species defining 100% similarity (with a total fauna of 49 species); and southern-outer reefs had seven species accounting for 100% of similarity (with a total fauna of only 28 species). Clearly, the grouped (‘meso’-scale) sites of northern-mid and northern-outer reefs are artificial given
J. N. A. Hooper and J. A. Kennedy
their low within-group taxonomic similarities (from cluster, MDS and SIMPER analyses and ANOSIM hypothesis testing), lending support to Banks and Harriott’s (1995) suggestion (based on scleractinian coral and macroalgae distributions) that these northern-mid and -outer reefs are ‘sites intermediate between near-shore and off-shore’ and deserve no other formal recognition as distinct zones. The proportion of unique species (‘apparent endemism’) for most sites is generally related to the total species richness of each site, such that sites containing greater diversity also contained a greater proportion of species not found elsewhere. A notable exception to this pattern was Flinders Reef (with low diversity but high ‘apparent endemism’), which might be explained by its greater distance offshore and/or its closer proximity to the Moreton Bay fauna than to more northerly reefs. This observation is supported by the findings of Banks and Harriott (1995), who recorded a significantly higher number of scleractinian coral species from Flinders Reef than from any other reefs on the Sunshine Coast or in Moreton Bay. They suggested that its location further off-shore provided greater exposure to the East Australian Current, carrying warmer water and larvae (and probably, in the case of sponges, asexual propagules) from the tropics and thus also resulting in a better coral reef structure than any of the other sites. This phenomenon may explain the relatively high proportion of unique sponge species on Flinders Reef, but not its relatively low sponge diversity in comparison to reefs further north. Conversely, the adjacent Hutchinson Shoal (only 3.2 km away, but slightly deeper than Flinders Reef) has both low richness and low ‘apparent endemism’. Flinders Reef is clearly anomalous compared with the general regional fauna. It is the most taxonomically distinct (AvTD) and least heterogeneous (VarTD) in terms of sponge taxonomic composition (for species-, genus- and family-level taxa), and may have closer taxonomic affinities to the southern Great Barrier Reef than to the Sunshine Coast or more southerly sites. By comparison, Mudjimba Island (at species level) and Peregian Reef (at species, genus and family levels) have the least taxonomically distinct and most heterogeneous faunas. These differences in taxonomic distinctness at different taxonomic levels also indicate that family-level taxa are not effective surrogates for true (species level) taxonomic diversity. Implications of heterogeneity to conservation biology It has been suggested that rare or unique species may significantly bias biodiversity models when using only similarity index data to explore β-diversity or community patterns across environmental gradients (Clarke and Gorley 2001). In the present study, only 40% of species were found at two or more sites, with 60% of species not contributing to cluster or MDS groups. A posteriori (SIMPER) analyses showed that only a relatively small proportion of species
Small-scale sponge biodiversity patterns
common to all pairwise comparisons within and between sites were significant contributors to defining or differentiating these hypothesised spatial groups, and many of these species were also the most ‘typical’ for the region as a whole. This is a general problem for sponge ecological and biogeographic studies given the observed high taxonomic heterogeneity between habitats and high ‘apparent endemism’, even at small spatial scales (Wilkinson and Cheshire 1989; Alcolado 1990; Zea 1993, 2001; Hooper 1994; Carballo et al. 1996; Hooper et al. 1999b), even when there are no obvious environmental gradients (e.g. Reed and Pomponi 1997) and even for cases in which abundance data are collected that may provide more informative assessments of community evenness and dominance (Maldonado and Uriz 1995; Roberts et al. 1998; de Voogd et al. 1999; Lehnert and Fischer 1999) than solely presence/absence data. Without abundance data to demonstrate that species acquisition curves are saturated for every study site, it is equivocal whether samples are accurate representations of the true biodiversity, or to what extent local biodiversity estimates are biased by these rare or unique species. An increasingly popular alternative, the use of broad-scale (RAPD) survey techniques (e.g. Ward et al. 1998), is also generally unreliable for studies on sponges where it is essential that histological comparisons are made to verify identifications, or better still, genetic markers are used to detect cryptic species hidden among sponge morphospecies. For example, it is becoming increasingly evident that the sponge genotype is not necessarily manifested at the phenotypic level (e.g. Alvarez et al. 2002), and conversely, that even small morphometric differences may translate into significant genetic differences (e.g. Wörheide et al. in press). Thus, any measure of biodiversity based solely on morphology, as presented here, is likely to be an underestimate of true taxonomic diversity and community patterns presented here are probably minimal hypotheses. The preponderance of unique or rare species at the α-scale of diversity has implications on the effectiveness of designated small-scale marine reserves, which (from our data at least) may not contain an adequate representation of the ‘meso’-scale regional biodiversity. A case in point is Flinders Reef, which is the only legislated highly protected marine area (Protection zone) outside of Moreton Bay, but contains few of the sponge genetic resources found in the adjacent Sunshine Coast reefs (or for that matter, reefs within Moreton Bay; Davie and Hooper 1998). This finding supports previous contentions that small, isolated reefs contain unique sponge genetic resources that are not necessarily contained within broad ‘coral reef ’ conservation strategies (Hooper 1994), but when α-scale sponge biodiversity data are amalgamated into broader γ- and ε-spatial scales (e.g. Hooper et al. 1999b, 2002), it is possible to obtain more accurate estimates of regional biodiversity since the data sets are much larger and a greater proportion
651
of species occur in more than one site. There is an increasing likelihood that species accumulation curves approach saturation over larger scales, and thus rare or unique species are less significant to biodiversity analyses. One of the primary considerations for implementing marine reserves concerns protecting critical habitats and special features representative of the particular biogeographic zone, including consideration of the rarity of the species to be protected (Anon. 2001). Clearly, for sponges, small-scale reserves like Flinders Reef fail to meet this criterion. Furthermore, assumptions about wide connectivity between marine protected areas (compared with terrestrial protected areas, which have more discrete boundaries; Anon. 2001) are largely based on phyla capable of widespread dispersal (e.g. Palumbi 1992). Taxa with reportedly very limited larval dispersal potential, such as sponges (e.g. Zea 1993), require management on much finer spatial scales than previously assumed (Anon. 2001). These considerations are pivotal to the design and size of marine reserves (Roberts and Hawkins 1997) that need to take into account the scale of the reserve and biology of the species that inhabit them (Ray 1999), and place them into the larger context of the ecosystems they allegedly represent (Anon. 2001). References Alcolado, P. M. (1990). General features of Cuban sponge communities. In ‘New Perspectives in Sponge Biology’. (Ed. K. Rützler.) pp. 351–357. (Smithsonian Institution Press: Washington DC.) Alvarez, B., Bergquist, P. R., and Battershill, C. N. (2002). Taxonomic revision of the genus Latrunculia Du Bocage (Porifera: Demospongiae: Latrunculiidae) from New Zealand. New Zealand Journal of Marine and Freshwater Research 36, 151–184. Anonymous (2001). ‘Marine Protected Areas. Tools for Sustaining Ocean Ecosystems.’ (Committee on the Evaluation, Design and Monitoring of Marine Reserves and Protected Areas in the United States; Ocean Studies Board, Commission on Geosciences, Environment and Resources, National Research Council and National Academy Press: Washington DC.) Banks, S. A., and Harriott, V. J. (1995). Coral communities of the Gneering Shoals and Mudjimba Island, south-eastern Queensland. Journal of Marine and Freshwater Research 46, 1137–1144. Bellwood, D. R., and Hughes, T. P. (2001). Regional-scale assembly rules and biodiversity of coral reefs. Science 292, 1532–1534. Carballo, J. J., Naranjo, S. A., and García-Gómez, J. C. (1996). Use of marine sponges as stress indicators in marine ecosystems at Algeciras Bay (southern Iberian Peninsula). Marine Ecology Progress Series 135, 109–122. Carlgren, O. (1950). Corallimorphia, Actiniaria and Zoantharia from New South Wales and south Queensland. Arkiv für Zoologi 1, 131–149. Clarke, K. R., and Gorley, R. N. (2001). ‘Primer Version 5: User Manual/Tutorial.’ (Primer-E: Plymouth, UK.) Clarke, K. R., and Warwick, R. M. (1998). A taxonomic distinctness index and its statistical properties. Journal of Applied Ecology 35, 523–531. Clarke, K. R., and Warwick, R. M. (2001). A further biodiversity index applicable to species lists: variation in taxonomic distinctness. Marine Ecology Progress Series 216, 265–278.
652
Clifford, H. T., and Stephenson, W. (1975). ‘An Introduction to Numerical Classification.’ (Academic Press: New York.) Cribb, A. B., and Cribb, J. (1985). ‘Plant Life of the Great Barrier Reef and Adjacent Shores.’ (University of Queensland Press: Brisbane.) Davie, P. J. F. (Ed.) (1998). ‘Wild Guide to Moreton Bay, Wildlife and Habitats of a Beautiful Australian Coast – Noosa to the Tweed.’ (Queensland Museum: Brisbane.) Davie, P. J. F., and Hooper, J. N. A. (1998). Patterns of biodiversity in the marine invertebrate and fish communities of Moreton Bay. In ‘Moreton Bay and Catchment’. (Eds I. R. Tibbetts, N. J. Hall and W. Dennison.) pp. 331–346. (School of Marine Science, The University of Queensland Press: Brisbane.) Davis, A. R., Ayre, D. J., Billingham, M. R., Styan, C. A., and White, G. A. (1996). The encrusting sponge Halisarca laxus: population genetics and association with the ascidian Pyura spinifera. Marine Biology 126, 27–33. Dennison, W. C., and Abal, E. G. (1999). ‘Moreton Bay Study: A Scientific Basis for the Healthy Waterways Campaign.’ (South East Queensland Regional Waterways Quality Management Strategy: Brisbane.) de Voogd, N. J., Van Soest, R. W. M., and Hoeksema, B. W. (1999). Cross-shelf distribution of southwest Sulawesi reef sponges. Memoirs of the Queensland Museum 44, 147–154. Grassle, J. F. (1991). Deep-sea benthic biodiversity. The ocean bottom supports communities that may be as diverse as those of any habitat on Earth. Biodiversity 41(7), 464–469. Gray, J. S. (1997). Gradients in marine biodiversity. In ‘Marine Biodiversity: Patterns and Processes’. (Eds R. F. G. Ormond, J. D. Gage and M. V. Angel.) pp. 18–34. (Cambridge University Press: Cambridge.) Gray, J. S. (2001). Marine diversity: the paradigms in patterns of species richness examined. Scientia Marina 65 (Supplement 2), 41–56. Guichard, F., and Bourget, E. (1998). Topographic heterogeneity, hydrodynamics and benthic community structure: a scale dependent cascade. Marine Ecology Progress Series 135, 89–100. Hillis, D. M., and Bull, J. J. (1993). An empirical test of bootstrapping as a method for assessing confidence in phylogenetic analysis. Systematic Biology 42(2), 182–192. Hooper, J. N. A. (1991). Revision of the family Raspailiidae (Porifera: Demospongiae), with description of Australian species. Invertebrate Taxonomy 5(6), 1179–1415. Hooper, J. N. A. (1994). Coral reef sponges of the Sahul Shelf – a case for habitat preservation. Memoirs of the Queensland Museum 36(1), 93–106. Hooper, J. N. A. (1996). Revision of Microcionidae (Porifera: Poecilosclerida: Demospongiae), with description of Australian species. Memoirs of the Queensland Museum 40, 1–626. Hooper, J. N. A., and Lévi, C. (1994). Biogeography of Indo-west Pacific sponges: Microcionidae, Raspailiidae, Axinellidae. In ‘Sponges in Time and Space’. (Eds R. W. M. Van Soest, T. M. G. Van Kempen and J. -C. Braekman.) pp. 191–212. (Balkema: Rotterdam.) Hooper, J. N. A., and Van Soest, R. W. M. (Eds) (2002). ‘Systema Porifera. A Guide to the Classification of Sponges.’ (Kluwer Academic/Plenum Publishers: New York.) Hooper, J. N. A., and Wiedenmayer, F. (1994). ‘Porifera.’ Zoological Catalogue of Australia. Vol. 12. (CSIRO Publishing: Melbourne.) Hooper, J. N. A., List-Armitage, S. E., Kennedy, J. A., Cook, S. D., and Valentine, C. A. (1999a). Sponges of the Low Isles, Great Barrier Reef: an important scientific site, or a case of mistaken identity ? Memoirs of the Queensland Museum 44, 249–262. Hooper, J. N. A., Kennedy, J. A., List-Armitage, S. E, Cook, S. D., and Quinn, R. (1999b). Biodiversity, species composition and distribution of marine sponges in northeast Australia. Memoirs of the Queensland Museum 44, 263–274.
J. N. A. Hooper and J. A. Kennedy
Hooper, J. N. A., Kennedy, J. A., and Van Soest, R. W. M. (2000). Annotated checklist of sponges (Porifera) of the South China Sea region. Raffles Bulletin of Zoology, Supplement 8, 125–207. Hooper, J. N. A., Kennedy, J. A., and Quinn, R. J. (2002). Biodiversity ‘hotspots’, patterns of richness and endemism, and taxonomic affinities of tropical Australian sponges (Porifera). Biodiversity and Conservation 11, 851–885. Huston, M. (1985). Patterns of species diversity on coral reefs. Annual Review of Ecology and Systematics 16, 149–177. Izsak, C., and Price, A. R. G. (2001). Measuring β-diversity using a taxonomic similarity index, and its relation to spatial scale. Marine Ecology Progress Series 215, 69–77. Jensen, R., Borowitzka, L., Bray, N., Davies, P., Fandry, C., Jeffriess, B., Johnson, C., Hudlow, T., Lennard, D., Marsh, H., Pigram, C., and Reichelt, R. (1999). ‘Australia’s Marine Science and Technology Plan.’ The Marine Science and Technology Plan Working Group. (Ausinfo, Commonwealth of Australia: Canberra.) Kohn, A. J. (1997). Why are coral reef communities so diverse? In ‘Marine Biodiversity: Patterns and Processes’. (Eds R. F. G. Ormond, J. D. Gage and M. V. Angel.) pp. 201–215. (Cambridge University Press: Cambridge.) Kott, P. M. (1985). The Australian Ascidiacea. Part 1, Phlebobranchia and Stolidobranchia. Memoirs of the Queensland Museum 23, 1–438. Kott, P. M. (1990). The Australian Ascidiacea. Part 2, Aplousobranchia (1). Memoirs of the Queensland Museum 29(1), 1–266. Kott, P. M. (1992). The Australian Ascidiacea. Part 3, Aplousobranchia (2). Memoirs of the Queensland Museum 32, 375–620. Lehnert, H., and Fischer, H. (1999). Distribution patterns of sponges and corals down to 107 m off North Jamaica. Memoirs of the Queensland Museum 44, 307–316. Maldonado, M., and Uriz, M. J. (1995). Biotic affinities in a transitional zone between the Atlantic and the Mediterranean: a biogeographical approach based on sponges. Journal of Biogeography 22(1), 89–110. Maldonado, M., and Young, C. M. (1996). Effects of physical factors on larval behaviour, settlement and recruitment of four tropical demosponges. Marine Ecology Progress Series 138, 169–180. Meyer, C., and Paulay, G. (2000). Indo-west Pacific diversity: phylogenetic evidence from cowries for a mozaic of causes. In ‘Ninth International Coral Reef Symposium. World Coral Reefs in the New Millennium: Bridging Research and Management for Sustainable Development’. (Eds D. Hopley, P. M. Hopley, J. Tamelander and T. Done.) p. 45. (State Ministry for the Environment, Indonesia, Indonesian Institute of Sciences and The International Society for Reef Studies: Bali, Indonesia.) Munro, M. H. G., Blunt, J. W., Dumdei, E. J., Hickford, S. J. H., Lill, R. E., Li, S., Battershill, C. N., and Duckworth, A. R. (1999). The discovery and development of marine compounds with pharmaceutical potential. Journal of Biotechnology 70, 15–25. Palumbi, S. R. (1992). Marine speciation on a small planet. Trends in Ecology and Evolution 7, 114–118. Pennycuik, P. R. (1959). Faunistic records from Queensland. Part V. Marine and brackish water hydroids. University of Queensland Papers, Department of Zoology 1(6), 141–210. Pielou, E. C. (1977). ‘Mathmatical Ecology.’ (John Wiley & Sons: New York.) Pielou, E. C. (1984). ‘The Interpretation of Ecological Data.’ (John Wiley & Sons: Edmonton, Canada.) Ray, G. C. (1999). Coastal-marine protected areas: agonies of choice. Aquatic Conservation Marine and Freshwater Ecosystems 9, 607–614. Reed, J. K., and Pomponi, S. (1997). Biodiversity and distribution of deep and shallow water sponges in the Bahamas. In ‘Proceedings of
Small-scale sponge biodiversity patterns
653
the 8th Coral Reef Symposium, Panama, Volume 2’. (Eds H. A. Lessios and I. G. Macintyre.) pp. 1387–1392. (Smithsonian Tropical Research Institute: Balboa, Panama.) Richardson, D. L., Harriott, V. J., and Harrison, P. L. (1997). Distribution and abundance of giant sea anemones (Actinaria) in subtropical eastern Australian waters. Marine and Freshwater Research 48, 59–66. Richer de Forges, B., Koslow, J. A., and Poore, G. C. B. (2000). Diversity and endemism of the benthic seamount fauna in the southwest Pacific. Nature 405, 944–947. Roberts, C. M., and Hawkins, S. P. (1997). How small can a marine reserve be and still be effective? Coral Reefs 16, 150. Roberts, D. E., and Davis, A. R. (1996). Patterns in sponge (Porifera) assemblages on temperate coastal reefs off Sydney, Australia. Marine and Freshwater Research 47, 897–906. Roberts, D. E., Fitzhenry, S. R., and Kennelly, S. J. (1994). Quantifying subtidal macrobenthic assemblages on hard substrata using a jump camera method. Journal of Experimental Marine Biology and Ecology 177, 157–170. Roberts, D. E., Smith, A., Ajani, P., and Davis, A. R. (1998). Rapid changes in encrusting marine assemblages exposed to anthropogenic point-source pollution: a ‘Beyond BACI’ approach. Marine Ecology Progress Series 163, 213–224. Saenger, P. (1991). Dynamism in nearshore subtidal algal communities off Mooloolaba, Queensland, Australia. Proceeding of the Royal Society of Queensland 101, 125–136. Sarà, M., and Vacelet, J. (1973). Écologie des Démosponges. In ‘Traité de Zoologie. Anatomie, Systématique, Biologie. III. Spongiaires’. (Eds P. Brien, C. Lévi, M. Sarà, O. Tuzet and J. Vacelet. Ser. Ed. P. -P. Grassé.) pp. 462–576. (Masson et Cie: Paris.) Schlacher, T. A., Newell, P., Clavier, J., Schlacher-Hoenlinger, M. A., Chevillon, C., and Britton, J. (1998). Soft-sediment benthic community structure in a coral reef lagoon – the prominence of spatial heterogeneity and ‘spot endemism.’ Marine Ecology Progress Series 174, 159–174. Swofford, D. L. (2001). ‘PAUP*. Phylogenetic Analysis Using Parsimony (*and Other Methods). Version 4.’ (Sinauer Associates: Sunderland, Massachusetts.) Taylor, J. D. (1997). Diversity and structure of tropical Indo-Pacific benthic communities: relation to regimes of nutrient input. In ‘Marine Biodiversity: Patterns and Processes’. (Eds R. F. G. Ormond, J. D. Gage and M. V. Angel.) pp. 178–199. (Cambridge University Press: Cambridge.) Uriz, M. J., Maldonado, M., Turon, X., and Marti, R. (1998). How do reproductive output, larval behaviour, and recruitment contribute to adult spatial patterns in Mediterranean encrusting sponges? Marine Ecology Progress Series 167, 137–148. Van Soest, R. W. M. (1993). Distribution of sponges on the Mauritanian continental shelf. In ‘Ecological Studies in the Coastal Waters of Mauritania’. (Eds W. J. Wolff, J. van der Land, P. H. Nienhuis and P. A. W. J. de Wilde.) Hydrobiologia 258, 95–106. Van Soest, R. W. M. (1994). Demosponge distribution patterns. In ‘Sponges in Time and Space’. (Eds R. W. M. Van Soest, T. M. G. van Kempen and J. -C. Braekman.) pp. 213–224. (Balkema: Rotterdam.)
Van Soest, R. W. M., and Hajdu, E. (1997). Marine area relationships from twenty sponge phylogenies. A comparison of methods and coding strategies. Cladistics 13, 1–20. Veron, J. E. N. (1993). A biogeographic database of hermatypic corals. Australian Institute of Marine Science Monograph Series 10, 1–433. Veron, J. E. N. (1995). ‘Corals in Space and Time. The Biogeography and Evolution of the Scleractinia.’ (University of New South Wales Press: Sydney.) Wallace, C. (1978). The coral genus Acropora in the central and southern Great Barrier Reef Province. Memoirs of the Queensland Museum 18(2), 273–320. Ward, T., Kenchington, R., and Margueles, C. (1998). ‘Marine BioRAP.’ (CSIRO: Hobart.) Warwick, R. M., and Clarke, K. R. (1998). Taxonomic distinctness and environmental assessment. Journal of Applied Ecology 35, 532–543. Warwick, R. M., and Clarke, K. R. (2001). Practical measures of marine biodiversity based on relatedness of species. In ‘Oceanography and Marine Biology: an Annual Review’. (Eds R. N. Gibson, M. Barnes and R. J. A. Atkinson.) Vol. 39. pp. 207–231. (Taylor and Francis: London). Wilkinson, C. R. (1983). Net primary productivity in coral reef sponges. Science 236, 1654–1657. Wilkinson, C. R. (1988). Foliose Dictyoceratida of the Australian Great Barrier Reef. 2. Ecology and distribution of these prevalent sponges. Marine Ecology 9(4), 321–327. Wilkinson, C. R., and Cheshire, A. C. (1989). Patterns in the distribution of sponge populations across the central Great Barrier Reef. Coral Reefs 8, 127–134. Wilkinson, C. R., and Evans, E. A. (1989). Sponge distributions across Davies Reef, Great Barrier Reef, relative to location, depth and water movement. Coral Reefs 8, 1–7. Wilkinson, C. R., and Vacelet, J. (1979). Transplantation of marine sponges to different conditions of light and current. Journal of Experimental Marine Biology and Ecology 37, 91–104. Wörheide, G., Hooper, J. N. A., and Degnan, B. M. (In Press). Phylogeography of western Pacific Leucetta ‘chagosensis’ (Porifera: Calcarea) from ribosomal DNA sequences: implications for population history and conservation of the Great Barrier Reef World Heritage Area (Australia). Journal of Molecular Ecology. Zar, J. H. (1999). ‘Biostatistical Analysis.’ (Prentice Hall: New Jersey.) Zea, S. (1993). Recruitment of demosponges (Porifera, Demospongiae) in rocky and coral reef habitats of Santa Marta, Colombian Caribbean. Marine Ecology 14(1), 1–21. Zea, S. (2001). Patterns of sponge (Porifera, Demospongiae) distribution in remote, oceanic reef complexes of the southwestern Caribbean. Revista de la Academia Colombiana de Ciencias Exactas, Físicas y Naturales 25(97), 579–592.
Manuscript received 4 April 2002; revised and accepted 24 June 2002.
http://www.publish.csiro.au/journals/is