Journal of Urban Health: Bulletin of the New York Academy of Medicine doi:10.1007/s11524-010-9537-2 * 2011 The New York Academy of Medicine
Investigating Environmental Determinants of Diet, Physical Activity, and Overweight among Adults in Sao Paulo, Brazil Patricia Constante Jaime, Ana Clara Duran, Flávia Mori Sarti, and Karen Lock ABSTRACT There is worldwide recognition that the burden of noncommunicable diseases (NCDs) and obesity-related health problems is rapidly increasing in low- and middle-income countries. Environmental determinants of obesity are likely to differ between countries, particularly in those undergoing rapid socioeconomic and nutrition transitions such as Brazil. This study aims to describe some built environment and local food environment variables and to explore their association with the overweight rate and diet and physical activity area-level aggregated indicators of adults living in the city of Sao Paulo, the largest city in Brazil. This formative study includes an ecological analysis of environmental factors associated with overweight across 31 submunicipalities of the city of Sao Paulo using statistical and spatial analyses. Average prevalence of overweight was 41.69% (95% confidence interval 38.74, 44.64), ranging from 27.14% to 60.75% across the submunicipalities. There was a wide geographical variation of both individual diet and physical activity, and indicators of food and built environments, favoring wealthier areas. After controlling for area socioeconomic status, there was a positive correlation between regular fruits and vegetables (FV) intake and density of FV specialized food markets (r=0.497; pG0.001), but no relationship between fastfood restaurant density and overweight prevalence was found. A negative association between overweight prevalence and density of parks and public sport facilities was seen (r=−0.527; pG0.05). Understanding the relationship between local neighborhood environments and increasing rates of poor diet, physical activity, and obesity is essential in countries undergoing rapid economic and urban development, such as Brazil, in order to provide insights for policies to reduce increasing rates of NCDs and food access and health inequalities. KEYWORDS Obesity, Diet, Food, Physical activity, Environment
INTRODUCTION The rising prevalence of overweight and obesity is currently one of the major public health concerns, linked to worsening rates of chronic noncommunicable diseases (NCDs) worldwide. Rates of overweight and obesity have been increasing both in developed and developing countries.1 In Brazil, between 1975 and 2003, the Jaime is with the Department of Nutrition, School of Public Health, University of Sao Paulo, São Paulo, Brazil; Duran is with the Public Health Nutrition Program, School of Public Health, University of Sao Paulo, Sao Paulo, Brazil; Sarti is with the School of Arts, Sciences and Humanities, University of Sao Paulo, Sao Paulo, Brazil; Lock is with the Department of Public Health and Policy, London School of Hygiene and Tropical Medicine, University of London, London, UK. Correspondence: Patricia Constante Jaime, Department of Nutrition, School of Public Health, University of Sao Paulo, São Paulo, Brazil. (E-mail:
[email protected])
JAIME ET AL.
prevalence of adult overweight (body mass index≥25 kg/m2) increased from 18% to 41% in men and from 27% to 40% in women. The obesity trends in Brazil also show increasing health inequalities as the highest burden of obesity is shifting towards those adults with the lowest income and the least education.2 From a biological perspective, obesity arises from an imbalance between energy input and output.3 Changes in lifestyles that result in poor diet and lack of physical activity are the main risk factors thought to explain this.4 Until recently, much public health research and policy have concentrated on changing individual-level determinants of obesity-related behaviors. Factors such as taste preferences, knowledge, intentions, attitudes, self-efficacy, and a number of other individual factors were considered primarily to drive what and how people eat or the amount of physical activity they undertake.5 Research to date suggests that individually focused interventions attempting to prevent or reduce adult obesity have had mixed or limited results.6,7 Although some educational, psychological, behavioral, and pharmacological approaches to treat obesity appear to be potentially effective, they will not be sufficient to reduce rising obesity prevalence because people are constrained in their ability to adopt healthy behaviors by urban environments, which increasingly promote poor diet and sedentary behaviors.4,8 Central to understanding the impact of environment on obesity is the theoretical concept of the “obesogenic environment” which has been defined as “the sum of influences that the surroundings, opportunities, or conditions of life have on promoting obesity in individuals or populations.”4 Several studies have shown that physical activity and dietary patterns and obesity rates vary between areas of residence within towns or countries. The most consistent evidence available of a relationship between obesity and factors in the urban environment comes from American studies;9–13 however, it is not clear whether these geographical associations are also true in other countries.13–15 For example, the ease of access to supermarkets and the availability and variety of healthy food in shops have been associated with a higher intake of fruit and vegetables (FV)10 and a lower prevalence of obesity and overweight.12 The picture outside the United States, however, seems to be different and suggests a need for caution in extrapolating research on environmental influences from one setting to another. For instance, the relationship between neighborhood retail provision, cost of healthy foods, and food intake has been shown to differ between deprived communities in the United States and the United Kingdom, and researchers have attempted to explain these differences due to differences in demographics, population density, geographical characteristics of neighborhoods, food cultures, and shopping patterns.16,17 There is particularly a lack of evidence about the association of environmental factors with obesity-related behaviors and trends in low- and middle-income countries. The extrapolation of conclusions from studies conducted in the USA and other developed countries might lead to inaccurate insights about how urban environmental determinants can influence diet behaviors and obesity rates in other countries, particularly those undergoing rapid socioeconomic and nutrition transitions, such as Brazil, Russia, India, and China. Therefore, a formative study is proposed describing the obesity- and physicalactivity- related food and built environments, and exploring how they are related to area-aggregated, individual-level indicators. Moreover, as obesity trends in Brazil have been shown to be strongly associated with income and education,2 we present an analysis adjusted by the socioeconomic status (SES) of the area.
INVESTIGATING ENVIRONMENTAL DETERMINANTS AMONG ADULTS IN SAO PAULO
This study aims to describe some built environment and local food environment indicators and to explore their association with the overweight rate and diet and physical activity area-level aggregated indicators of adults living in the city of Sao Paulo, Brazil. Furthermore, the present study aims to describe how chosen built and food environment indicators vary across areas of different socioeconomic status.
MATERIALS AND METHODS This study is a formative ecological analysis of local environmental factors associated with overweight and individual risk factor behaviors among adults living in the 31 submunicipalities of the city of Sao Paulo. We chose to use this data aggregation (submunicipalities of the city of Sao Paulo) because of the limitations of data available in the secondary databases regarding both socioeconomic and built and food environments. Besides that, since population density is not equal across the city of Sao Paulo, using smaller areas would not permit variance analyses to be performed as the number of individuals per area would be too small in less populated regions. Additionally, Sao Paulo, being a large metropolis, is counted with submunicipalities to allow for better resources allocation and for decisions to be made locally. Thus, the chosen aggregation also is able to devolve local information for policy makers. We used 3 data sources: (1) individual-level anthropometric, diet, and physical activity data gathered from a probabilistic sample of 2,122 women and men, aged 18 years or older, who had been interviewed in a validated telephone-based surveillance system for chronic disease (VIGITEL System), organized by the Brazilian Ministry of Health in 2003;18,19 (2) Brazilian census data (reference year 2000) to describe area-level socioeconomic characteristics; and (3) data on the built environment and local food environment from both routine government and commercial sources available in 2003. The probabilistic sampling of the database where individual-level variables was taken from was performed in 2 steps: random selection of households with landline telephones and random selection of prospective interviewees. Individual-level overweight rate was estimated by body mass index (BMI) in kilograms per square meter. The classification of BMI proposed by the World Health Organization was applied; overweight was defined as BMI≥25.0 kg/m2.20 Data on height and weight were self-reported, which have been widely used in epidemiological studies.21 Use of self-reported height and weight on telephone surveys has been previously validated for Brazilian adults. High correlation rates were found when directly measured and self-reported data were compared, with also good results presented in the sensitivity and specificity analyses.22 Moreover, individual-level diet and physical activity data gathered on the telephone survey have been validated.23,24 Two individual-level diet indicators were considered: regular FV intake (≥5 days per week) and regular soft drink consumption (≥5 days per week), which were assumed to be proxy indicators of healthy and unhealthy diet behaviors, respectively. The indicator of physical activity was defined as the proportion of the population that undertake at least 30 minutes of moderate or vigorous physical leisure activity 3 times or more per week. To the prevalence of all individual-level variables by each of the 31 submunicipalities, we applied sample weighting factors that take into account demographic and socioeconomic differences between the
JAIME ET AL.
adult population with telephones and the entire adult population of the local area, as proposed by Monteiro et al.18 Finally, we used area-level aggregated individual indicators constructed with the means of all individual-level indicators of the 31 submunicipalities, after geocoding them with the help of ArcView 9.3 software (Lab Kit ArcView 9.3 software, ESRI, Redlands, USA), by boundary, since we had the information regarding the city district where the interviewed people resided and consequently in which submunicipality they belonged. From the Brazilian census data, the administrative areas of the city were described according to the SES, using the Human Development Index (HDI) of the area. Though this is a known index for international comparisons between countries,25 it has been constructed from local data for the city of Sao Paulo available on the 2000 census.26 It combines normalized measures of life expectancy, educational attainment, and income per capita.25 The HDI varies from 0 to 1, and the higher the index, the better social and living conditions an area or country has. The HDI information is available per area already aggregated to the level of the submunicipality, and it has been modified to be constructed for submunicipalities and districts of the city of Sao Paulo. It includes 3 domains: education (average schooling rates of the individual with highest income in the household [one third of the education indicator]+average illiteracy rate of the population older than 15 years old [two thirds of the education indicator]), longevity (life expectancy), and income (average per capita income of the submunicipality in purchasing power parity of American dollars).26 We also looked at 2 other area measures that are linked to deprivation and social context: crime rate (number/1,000 inhabitants) and percentage of houses without clean water (%) and sewage (%). Crime rate data specifically refer to homicide rate per 1,000 inhabitants in each of the 31 administrative areas in the year 2003 and were collected from the Sao Paulo Foundation of Data Analysis.27 High levels of these indicators represent poor social conditions. Thirdly, indicators of the local community food environment and built environment were area density (per 1,000 inhabitants). Food environment indicators included the density of large supermarket chains, local grocery stores, and FVspecialized food markets (including FV street market and public food markets); total retail food store density (including all retail outlets combined: large supermarket chains, local grocery stores, and FV-specialized food markets; density of large fastfood restaurant chains, such as McDonald’s, Bob’s, Burger King, and Pizza Hut; and the density of food courts located inside shopping malls. Data for constructing these indicators were gathered from the City Council Secretariat for Infrastructure and Planning of São Paulo.28 Built environment indicators selected as being relevant to the research question were density of parks and public sports facilities and accessibility of public transport system (defined as the number of train, metro, and bus stations per 1,000 inhabitants). Such information was gathered from the city bus and metro/train companies of the city.29,30 Information on parks and public sports facilities was compiled from the Secretariat of Environment and Natural Resources of both the City Council and the State of São Paulo, the Secretariats of Wellness and Sports of both the City Council and the State of São Paulo, and the City Council Secretariat for Infrastructure and Planning of São Paulo databases.31–34 Built and food environment data were geocoded by the postal code available in the databases with the help of ArcView 9.3 software (Lab Kit ArcView 9.3 software, ESRI, Redlands, USA).
INVESTIGATING ENVIRONMENTAL DETERMINANTS AMONG ADULTS IN SAO PAULO
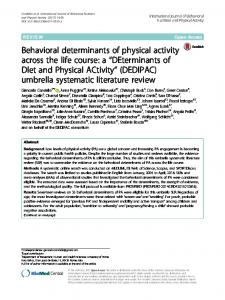
Ecological analyses were performed to explore associations between the food and built environment with overweight, diet, and physical activity behaviors. In the analysis, overweight, diet, and physical activity behavior rates were aggregated, and their prevalence were estimated by area. The Kolmogorov–Smirnov test was used to investigate the adherence of the study variables to normal distribution, and all dependent variables (overweight prevalence, FV regular intake, soft drink regular intake, physical activity, and HDI) showed a normal distribution. SES indicator was the HDI in tertiles. Analysis of variance at a 5% procedure-wise error rate was used to examine differences across submunicipalities by SES (low, first tertile of HDI [most disadvantaged]; mid, second tertile of HDI; or high, third tertile of HDI [most advantaged]). Correlation analyses between food and built environment factors and individual-level variables were performed with the use of the Pearson correlation coefficient, and for a controlled correlation by the HDI area level (SES variable), a partial correlation coefficient was estimated. Statistical analyses were performed using SPSS 17.0 software (SPSS Inc., Chicago, IL, USA). Theme maps were used to describe the spatial distribution of environmental variables like parks and sports facilities and FV specialized food markets and quartiles of prevalence of overweight and intake of FV across the city areas with the help of ArcView 9.3 software (Lab Kit ArcView 9.3 software, ESRI, Redlands, USA). RESULTS There were important socioeconomic discrepancies across the city, as presented in Table 1. The HDI ranges from 0.744 to 0.956. The percentage of houses without sewage ranges from 0.37% to 82.70%. Differences can also be seen in the area distribution of food and built environment indicators, as well as in the individuallevel variables. The mean prevalence of overweight was 41.69% (95% confidence interval 38.74; 44.64), with an increasing tendency in this rate from least deprived to most deprived areas, as seen on Table 2. Rates of overweight ranged from 46% in the most deprived areas to 38% in the least deprived areas. FV intake was higher in the least deprived areas with a clear gradient of reduced consumption as deprivation increased (pG0.001). In contrast, rates of soft drink consumption did not vary by area SES (Table 2). We found that the least deprived areas had higher densities of all types of food retail establishments, public transport links, parks, and public sports facilities. Unsurprisingly, these more affluent areas also had a higher percentage of houses with clean water or sewage and the lowest crime rates (Table 2). There were also significant associations between area-level aggregated individual indicators and food, built, and socioeconomic environmental indicators (Table 3). A positive association was found between regular FV intake and density of all retail food stores, as well as for each type of food retail establishment, in the univariate analysis. However, when controlled by area SES (using HDI), the only significant correlation with FV intake found was for FV-specialized food markets (rpartial =0.497). Overweight prevalence was inversely correlated with density of parks and sport facilities, adjusted for the HDI of the area. Moreover, physical activity areaaggregated rate was inversely correlated with crime level (r=−0.395; pG0.05). Figure 1 spatially describes the density of parks and public sports facilities and
JAIME ET AL.
TABLE 1
Variation in area-level and individual-level indicators in Sao Paulo City, Brazil
Variables Socioeconomic status and area deprivation HDI Houses without clean water (%) Houses without sewage (%) Crime rate (n/1,000 inhab.) Area-level aggregated individual indicators (%)b Overweight (BMI ≥25 kg/m2) FV intake (≥5 days/week) Soft drink consumption (≥5 times per week) Physical leisure activity (≥30 min in 3 times or more/week) Food environment (density n/1,000 inhabit.) Large supermarket chains Local grocery stores FV-specialized food markets All retail food storesc Fast-food restaurants Built environment (density n/1,000 inhabit.) Public transport system (metro, train, and bus stations) Parks and public sports facilities
Mean (n=31)a
95% CI
0.859 2.981 20.48 0.515
Minimum value
Maximum value
0.744 0.270 0.370 0.073
0.956 9.670 82.75 0.899
0.836 2.161 14.585 0.435
0.813; 1.341; 8.689; 0.356;
41.69 36.33
38.8; 44.6 32.9; 39.7
27.14 20.37
60.75 57.74
21.73
19.2; 24.3
11.55
34.58
16.43
14.13; 18.74
5.06
30.55
0.095 0.172 0.089 0.356 0.089
0.076; 0.148; 0.080; 0.310; 0.009;
0.114 0.196 0.098 0.402 0.026
0.016 0.099 0.036 0.190 0.000
0.217 0.412 0.159 0.730 0.087
0.013
0.008; 0.017
0.000
0.064
0.009
0.007; 0.012
0.000
0.022
HDI Human Development Index a N=31 administrative areas of Sao Paulo City b Weighted area prevalence c Includes large supermarkets chains, local grocery stores, and FV-specialized food markets
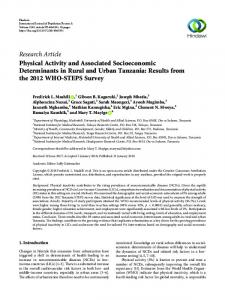
regular physical leisure activity and overweight rates across Sao Paulo City. Most of the submunicipalities with higher concentration of parks and public sports facilities, which are also located in the central and wealthier area of the city, presented lower average area-aggregated rates of obesity. However, as the map shows, when peripheral and central areas are compared, the relationship with physical activity area-aggregated rates is less clear as some areas with lower prevalence of physical activity also have access to large amounts of sports equipments and parks. Finally, the density of fruits and vegetables specialized food markets and the distribution of the intake of FV across the 31 submunicipalities of the city are presented in Figure 2. Again, submunicipalities where the intake of FV is higher are located at the central and wealthier areas of the city. Areas with a higher concentration of FV specialized food markets are also the ones where the intake of FV is higher. Table 2 shows differences in availability of FV-specialized food markets according to the socioeconomic status of the area. Like most of the other built and food environment equipment, more FV-specialized food markets are available in
INVESTIGATING ENVIRONMENTAL DETERMINANTS AMONG ADULTS IN SAO PAULO
TABLE 2 Analysis of variance between individual-level, food and built environments, and area deprivation indicators in Sao Paulo City, Brazil Area socioeconomic status (Human Development Index tertiles) Variables Area-level aggregated individual indicators (%)b Overweight (BMI≥25 kg/m2) FV intake (≥5 days/week) Soft drink consumption (≥5 times per week) Physical leisure activity (≥30 min in 3 times or more/week) Food environment (density n/1,000 inhabit.) Large supermarket chains Local grocery stores Fruits and vegetables specialized food markets Retail food stores (total stores without fast-food restaurants) Fast-food restaurants Built environment (density n/1,000 inhabit.) Public transport system (metro, train, and bus stations) Parks and public sports facilities Area deprivation Houses without clean water (%) Houses without sewage (%) Crime rate (n/1,000 inhab.)
1st
2nd
3rd
pa
46.285 28.756
40.906 35.210
37.974 45.135
0.058 G0.001
21.406
22.208
21.530
0.963
15.039
15.267
19.119
0.267
0.052 0.140 0.071
0.082 0.155 0.084
0.151 0.223 0.112
G0.001 0.005 G0.001
0.263
0.322
0.486
G0.001
0.001
0.009
0.042
G0.001
0.006
0.009
0.023
0.002
0.004
0.008
0.016
G0.001
4.219 29.698 0.666
1.424 11.047 0.428
0.913 3.362 0.213
G0.001 G0.001 G0.001
a
ANOVA Weighted area prevalence
b
richer areas. Furthermore, a positive and HDI-adjusted correlation between FV intake and presence of FV-specialized food markets is seen (rpartial =0.497, pG0.05) (Table 3). DISCUSSION An increased risk of overweight and obesity has been linked to income inequality35,36 and lower social capital.37 The relationship between individual-level behaviors, income, and overweight and obesity rates is well established in Brazil.2 Our study hypothesized that area-level differences in deprivation and aspects of the built environment may be associated with area-level differences in obesity rates, dietary intake, and rates of physical leisure activity. Our results show some significant and plausible associations between the area deprivation, features of the food and built environments, and rates of overweight, diet, and physical activity behaviors. The reduction of social and income inequalities
JAIME ET AL.
TABLE 3 Correlation between individual-level variables and environmental factors among adults in Sao Paulo City, Brazil Area-level aggregated individual indicators FV intake (≥5 days/week)
Soft drink consumption (≥5 times per week)
Physical leisure activity (≥30 min in 3 times or more/week)
Overweight (BMI≥25 kg/m2)
Correlation (r) Environmental factors
a
Density of large supermarket chains Density of local grocery stores Density of FV-specialized food markets Density of retail food stores (total stores without fast-food restaurants) Density of public transport system (metro, train, and bus stations) Density of large supermarket chains Density of local grocery stores Density of retail food stores (total stores without fast-food restaurants) Density of fast-food restaurants Houses without clean water (%) Density of green areas, parks, and public sports facilities Density of public transport system (metro, train, and bus stations) Crime rate Density of large supermarket chains Density of local grocery stores Density of specialized public food markets selling fresh FV Density of retail food stores (total stores without fast-food restaurants) Density of fast-food restaurants Density of public transport system (metro, train, and bus stations) Density of parks and public sports facilities Houses without sewage (%) Crime rate
Crude 0.668** 0.501* 0.746** 0.679**
Partialb 0.025 0.129 0.497* 0.217
0.322
−0.293
−0.044 −0.099 −0.052
−0.041 −0.101 −0.047
0.086 0.167 0.239
0.212 0.183 0.054
0.105
−0.111
−0.395* −0.232 −0.129 −0.090
−0.300 0.158 0.088 0.198
−0.179
0.158
−0.264 −0.289
0.047 −0.101
−0.592** 0.294 0.260
−0.527* 0.102 −0.078
a
Area density (number/1,000 inhabitants) in the 31 areas of the city Partial correlation controlled by Human Development Index *pG0.05; **pG0.001
b
in Sao Paulo city may be the most important contextual change required to tackle the rising prevalence of overweight. There are huge socioeconomic discrepancies across the city. For instance, some administrative areas in Sao Paulo have high HDI scores (90.950), comparable to that of Japan and Sweden. In contrast, the lowest HDI (0.744) found in areas of Sao Paulo is similar to some developing countries, such as Tonga and Grenada, in 2008.25 Recent evidence suggests that the socioeconomic environment of an area might impact the prevalence of overweight through potential community-level mediators that influence individual behaviors, such as access to food stores, healthy and unhealthy restaurants, sports facilities, parks, and price and availability of healthy food.9,10,35 People living in more affluent areas of Sao Paulo City appear to have
INVESTIGATING ENVIRONMENTAL DETERMINANTS AMONG ADULTS IN SAO PAULO
FIGURE 1. Density of parks and public sports facilities and rates of physical leisure activity and overweight across submunicipalities of the city of Sao Paulo, Brazil.
JAIME ET AL.
FIGURE 2. Density of fruits and vegetables specialized markets and fruits and vegetables intake across submunicipalities of the city of Sao Paulo, Brazil.
better access to all kinds of food shops, including specialized public food markets selling fresh FV, which are regulated by the City Council. Access to the public transport system, parks, and public sports facilities is also better in wealthier areas, even though these are also regulated and funded by the municipal government. Our findings suggest that local funding of and access to these community facilities reinforce the socioeconomic inequalities already observed across the city. When exploring the contributions of food availability to overweight rates and dietary intake, we found a clear association between the density of FV-specialized food markets and FV aggregated-level average intake. Sao Paulo has a large number of FV-specialized street food markets, which are located in all districts of the city, because of a city council regulation. Some public food markets specialized in FV can also be seen in some areas of the city, but not as equally spread. However, as Figure 2 shows, though regulated by the city council, the density of FV specialized food markets is still greater in the wealthier areas. Density of large chain supermarkets and local grocery store was also positively correlated to FV aggregated-level average intake. The lack of association in the adjusted analysis may be due to the strong correlation between area SES and the presence of retail establishments in Sao Paulo, as Table 3 shows. Although availability of specifically FV-specialized food markets and its association with FV intake is still scarce, some studies have shown associations between presence of grocery stores and FV intake.38 Zenk et al. 39 found that the presence of a grocery store in the neighborhood was associated with, on average,
INVESTIGATING ENVIRONMENTAL DETERMINANTS AMONG ADULTS IN SAO PAULO
0.69 more daily FV servings in the full sample. Availability of fresh FV also seem to be greater in more advantaged areas.40 This same group in Australia has shown higher density of FV stores in high-income areas when compared with low-income neighborhoods, whereas no differences were found when grocery store density was compared. Moreover, Latino neighborhoods are also the ones with greater availability and variety of fruits and vegetables, when compared with African-American neighborhoods.41 Our results bring interesting insights on how the presence of FV-specialized food markets affects FV intake, regardless of the SES status of the area. Further studies are needed to describe in depth the availability, quality, and prices of FV across diverse SES areas of a metropolis like Sao Paulo. Unlike previous US studies, 42,43 we did not found an association between area availability of large chain supermarkets and diet or overweight. In Brazil, supermarket and other food retail establishments are strongly determined by the economic market and tend to be located in the higher-income areas, where the prevalence of overweight is lower. There was no consistent association between density of fast-food restaurants and soft drink consumption (an indicator of unhealthy diet) and overweight. Previous studies have shown mixed results about the relationship between access to fast food and BMI or overweight.13,44–47 Our study was limited to large fast-food outlets (namely, McDonalds, Burger King, and Pizza Hut) and to local fast-food restaurants in shopping malls’ food courts available in Brazil. This may have biased the relationship because these venues are relatively expensive places to eat in Brazil and therefore are likely to be mainly found in high-income areas, unlike the distribution of fast food in the United States and elsewhere. A Brazilian nationwide survey showed that “sit-down meals,” which in Brazil refer to hot meals regularly eaten for lunch or dinner, which usually include rice, beans, meat or poultry, and vegetables, were the most frequent out-of-home eating pattern reported by adults living in urban areas. The intake of fast food was only reported by 9.6% and 7.2% of men and women investigated.48 This study consider fast-food restaurants to be defined as a relatively limited menu and food preparation options, quick service, paying for meals before they are received, no wait staff, and the option to consume the meal at the restaurant or take it out.43 In future studies in lower-income countries, this definition should be expanded to include street food, including sweets and deep-fried snack stores and smaller local fast-food restaurants, in order to analyze the relationship between unhealthy eating and the out-of-home food environment. Social and cultural dietary behaviors must be taken into account when environmental effects are studied in any population.49 The lack of relationship between density of parks and public sport facilities and leisure physical activity also contrasts with the results of many US studies that showed a positive association among both adolescents50,51 and adults.52–54 However, we did find areas with higher concentration of parks and public sports facilities, located at the central and wealthier areas of the city, with lower rates of overweight, even after adjusting by area SES. A possible reason for these apparently contradictory findings is our measurement of physical activity, specifically the use of a perceived, instead of objective, measure of physical activity. Even though the validity of indicators of physical activity and sedentariness obtained by the telephone-based surveillance system had been established,23 there is a potential information bias. Therefore, the statistical correlation between density of parks and public sport facilities and overweight suggests that the relationship with physical activity, obesity, and environment in Sao Paulo may still be consistent with previous studies conducted in developed countries.54
JAIME ET AL.
We found a significant inverse correlation between crime rates and physical leisure activity (r=−0.395) at univariate analysis. Neighborhood safety and esthetic appeal have also been associated with rates of physical activity and obesity prevalence in other countries, as public open spaces in unsafe areas may actually discourage physical activity.55,56 The study is subject to some limitations. First, it is cross-sectional in nature and thus cannot prove causality. Secondly, we used secondary data gathered by government and commercial sources to describe features of the food and built environment. The use of secondary datasets is a challenge due to their potential inaccuracies and also because food and physical activity environments are not static on time.49 Moreover, we did not have any data regarding walkability available for the city of Sao Paulo in the secondary datasets, though we understand its importance in describing physical activity-related built environment. Though we have carried out autocorrelation analyses with the individual-level area-aggregated variables such as overweight, fruits and vegetables intake, soda intake, and physical activity, we decided not to include them in the analyses as similar results to the partial correlations were found. Another concern is that we only used density as an indicator of availability of food stores, parks, and sports facilities, but we did not consider other measures of access to or quality of those urban services. Finally, one must consider whether the data aggregation used (31 administrative areas of Sao Paulo city) is the most appropriate to test our hypotheses. Sao Paulo is the largest city in Brazil and one of the largest cities in the world by population. The average population density observed was 10,036.22 inhabitants per square kilometer by area, ranging from 308.02 to 16,501.82 inhabitants per square kilometer in the 31 submunicipalities (data not shown). We could not study smaller areas, for instance the 96 city districts, because the number of individuals investigated by the telephone-based survey was too small to disaggregate to this level (n=2122) and would not permit comparisons across areas. The submunicipalities of the city were created in 2002, respecting the city district’s boundaries, political and cultural identity of the city districts, and a limit of 500,000 inhabitants per submunicipality in order to promote a local development, to bring the policy makers and the city council closer to the population, and for the political decisions in regard to resources’ allocation and priorities selection to be undertaken more efficaciously. Thus, the submunicipalities have autonomy in regard to political decisions, so choosing to present data to the level of the submunicipality provides more precise information for public policies.57 In conclusion, this formative ecological study showed that some features of the built environment and food-related environment vary across areas of different SES of a large metropolis in a middle-income country and present significant associations with some dietary behaviors and rates of overweight in Sao Paulo, Brazil. These initial findings warrant further in-depth study by collecting primary data on community environments by using environmental assessment tools designed and validated for the Sao Paulo context, so differences in more culturally relevant aspects of the food and built environments and their impact on behaviors and health can be investigated. Nonetheless, we decided to devolve the information up to now gathered, as we understand such data could help us plan and collect primary data and, consequently, carry on more in-depth analyses such as multi-level in the future. As for now, we were aware of our limitations regarding statistical power; thus, we
INVESTIGATING ENVIRONMENTAL DETERMINANTS AMONG ADULTS IN SAO PAULO
decided to include descriptive analyses, along with simpler correlations, yet adjusted by the socioeconomic status of the area The better understanding of the relationship between the local neighborhood environment and overweight is essential to design more effective interventions and policies to reduce obesity in Brazil, taking into account the context of a society in rapid economic transition. ACKNOWLEDGEMENTS We are grateful to the Fundação de Amparo à Pesquisa do Estado de São Paulo for the fellowship grant to PC Jaime at the London School of Hygiene and Tropical Medicine (process number 2009/06955-7) and to the Conselho Nacional de Desenvolvimento Científico e Tecnológico for the research grant (process number 473318/2008-3). We also thank Chris Grundy from the Centre for Spatial Analysis for Public Health of LSHTM for his advice on GIS analysis and Andreia dos Reis Lemos for her help with data collection.
REFERENCES 1. World Health Organization. Diet, nutrition and the prevention of chronic diseases. Technical report series 916. Joint FAO/WHO Expert Consultation, Geneva; 2003 2. Monteiro CA, Conde WL, Popkin BM. Income-specific trends in obesity in Brazil: 1975– 2003. Am J Public Health. 2007; 97(10): 1808–1812. 3. Prentice AM, Jebb SA. Obesity in Britain: gluttony or sloth? BMJ. 1995; 311: 437–439. 4. Swinburn B, Egger G, Raza F. Dissecting obesogenic environments: the development and application of a framework for identifying and prioritizing environmental interventions for obesity. Prev Med. 1999; 29: 563–570. 5. Armitage CJ, Conner M. Social cognition models and health behaviour: a structured review. Psychol Health. 2000; 15: 173–189. 6. Lemmens VE, Oenema A, Klepp KI, Henriksen HB, Brug J. A systematic review of the evidence regarding efficacy of obesity prevention interventions among adults. Obes Rev. 2008; 9(5): 446–55. 7. Shaw KA, O’Rourke P, Del Mar C, Kenardy J. Psychological interventions for overweight or obesity. Cochrane Database of Systematic Reviews 2005; 2:CD003818. doi: 10.1002/ 14651858.CD003818.pub2 8. Booth KM, Pinkston MM, Carlos Poston SW. Obesity and the built environment. J Am Diet Assoc. 2005; 105: S110–S117. 9. Diez-Roux AV, Link BG, Northridge ME. A multilevel analysis of income inequality and cardiovascular disease risk factors. Soc Sci Med. 2000; 50: 673–687. 10. Drewnowski A. Obesity and the food environment: dietary energy density and diet costs. Am J Prev Med. 2004; 27: 154–162. 11. Block JP, Scribner RA, De Salvo KB. Fast food, race/ethnicity, and income: a geographic analysis. Am J Prev Med. 2004; 27(3): 211–217. 12. Wang MC, Kim S, Gonzalez AA, MacLeod KE, Winkleby MA. Socioeconomic and foodrelated physical characteristics of the neighbourhood environment are associated with body mass index. J Epidemiol Community Health. 2007; 61: 491–499. 13. Inagami S, Cohen DA, Brown AF, Asch SM. Body mass index, neighborhood fast food and restaurant concentration, and car ownership. J Urban Health. 2009; 86(5): 683–695. 14. Cummins S, Macintyre S. Food environments and obesity—neighborhood or nation? Int J Epidemiol. 2006; 35: 100–104. 15. Giskes K, Kamphuis CBM, Van Lenthe FJ, Kremers S, Droomers M, Brug J. A systematic review of associations between environmental factors, energy and fat intakes among
JAIME ET AL.
16.
17.
18. 19.
20. 21.
22. 23. 24. 25. 26.
27.
28. 29.
30. 31.
32. 33.
34.
35.
adults: is there evidence for environments that encourage obesogenic dietary intakes? Public Health Nutr. 2007; 10(10): 1005–1017. Cummins S, Petticrew M, Higgins C, Findlay A, Sparks L. Large scale food retailing as an intervention for diet and health: quasi-experimental evaluation of a natural experiment. J Epidemiol Community Health. 2005; 59(12): 1035–1040. Stafford M, Cummins S, Ellaway A, Sacker A, Wiggins RD, Macintyre S. Pathways to obesity: identifying local, modifiable determinants of physical activity and diet. Soc Sci Med. 2007; 65(9): 1882–1897. Monteiro CA, de Moura EC, Jaime PC, et al. Surveillance of risk factors for chronic diseases through telephone interviews. Rev Saude Publica. 2005; 39(1): 47–57. Moura EC, Malta DC, Morais Neto OL, Monteiro CA. Prevalence and social distribution of risk factors for chronic non communicable diseases in Brazil. Rev Panam Salud Pública/Pan Am J Public Health. 2009; 26: 17–22. World Health Organization. Obesity: preventing and managing the global epidemic. Report of a WHO consultation. WHO Tech Rep Ser. 2000; 894(i–xii): 1–253. Gorber SC, Tremblay M, Moher D, Gorber B. A comparison of direct vs. self-report measures for assessing height, weight and body mass index: a systematic review. Obesity Rev. 2007; 8: 307–326. Lucca A, Moura EC. Validity and reliability of self-reported weight, height and body mass index from telephone interviews. Cad Saúde Pública. 2010; 26(1): 110–122. Monteiro CA, Florindo AA, Claro RM, Moura EC. Validity of indicators of physical activity and sedentariness obtained by telephone survey. Rev Saúde Pública. 2008; 42(4): 575–581. Monteiro CA, Moura EC, Jaime PC, Claro RM. Validity of food and beverage intake obtained by telephone survey. Rev Saúde Pública. 2008; 42(4): 582–589. United Nations Development Program. The human development index (HDI). http://hdr. undp.org/en/statistics/indices/hdi. Accessed on: March 14, 2010. United Nation Development Program [UNDP]. Atlas de desenvolvimento humano do Brasil. http://www.undp.org.br/HDR/HDR2000/Metodologias%20-%20IDH-M%20e% 20ICV.pdf. Accessed on: March 14, 2010. Fundação Sistema Estadual de Análise de Dados, SEADE. Secretaria de Economia e Planejamento do Estado de São Paulo. Informações dos distritos da capital. http://www. seade.gov.br/produtos/distritos/imp.php?page=consulta&action=ordem. Accessed on: April 5, 2010. Secretaria Municipal de Planejamento. Prefeitura de São Paulo. Infocidade. http://sempla. prefeitura.sp.gov.br/infocidade/. Accessed on: September 30, 2009. Companhia do Metropolitano de São Paulo. Governo do Estado de São Paulo. Mapa da rede metroviária de São Paulo. http://www.metro.sp.gov.br/redes/teredes.shtml. Accessed on: September 30, 2009. São Paulo Transportes S.A. Terminais urbanos. http://www.sptrans.com.br/sptrans08/ terminais/. Accessed on: September 30, 2009. Secretaria Municipal do Verde e Meio Ambiente. Prefeitura de São Paulo. Mapa Verde. Parques Municipais de São Paulo. http://www9.prefeitura.sp.gov.br/sitesvma/ 100_parques/regiao/index.php?p=25. Accessed on: September 30, 2009. Secretaria do Meio Ambiente. Governo do Estado de São Paulo. Parques estaduais e institutos florestais. http://www.ambiente.sp.gov.br/. Accessed on: September 30, 2009. Secretaria Municipal de Esportes. Prefeitura de São Paulo. Clubes e Unidades/Clubesescola. http://portal.prefeitura.sp.gov.br/secretarias/esportes. Accessed on: September 30, 2009. Secretaria do Esporte, Lazer e Turismo do Estado de São Paulo. Governo do Estado de São Paulo. Conjuntos desportivos. http://www.selt.sp.gov.br/conjuntos_desportivos.php. Accessed on: September 30, 2009. Regidor E, Gutiérrez-Fisac JL, Ronda E, Calle ME, Martínez D, Domínguez V. Impact of cumulative area-based adverse socioeconomic environment on body mass index and overweight. J Epidemiol Community Health. 2008; 62: 231–238.
INVESTIGATING ENVIRONMENTAL DETERMINANTS AMONG ADULTS IN SAO PAULO
36. Subramanian SV, Kawachi I, Smith GD. Income inequality and the double burden of under- and overnutrition in India. J Epidemiol Community Health. 2007; 61: 802–809. 37. Holtgrave DR, Crosby R. Is social capital a protective factor against obesity and diabetes? Findings from an exploratory study. Ann Epidemiol. 2006; 16: 406–408. 38. Morland K, Wing S, Diez Roux A. The contextual effect of the local food environment on residents’ diets: the atherosclerosis risk in communities study. Am J Public Health. 2002; 92: 1761–1767. 39. Zenk SN, Lachance LL, Schulz AM, Mentz G, Kannan S, Ridella W. Neighborhood retail food environment and fruit and vegetable intake in a multiethnic urban population, subpopulations. Am J Health Promot. 2009; 23(4): 255–264. 40. Ball K, Timperio A, Crawford D. Neighborhood socioeconomic inequalities in food access and affordability. Health Place. 2009; 15(2): 578–85. 41. Grigsby-Toussaint DS, Zenk SN, Odoms-Young A, Ruggiero L, Moise I. Availability of commonly consumed and culturally specific fruits and vegetables in African-American and Latino neighborhoods. J Am Diet Assoc. 2010; 110(5): 746–52. 42. Powell LM, Auld C, Chaloupka FJ, O’Malley PM, Johnston LD. Associations between access to food stores and adolescent body mass index. Am J Prev Med. 2007; 33(4S): S301–S307. 43. Morland K, Diez Roux AV, Wing S. Supermarkets, other food stores, and obesity: the Atherosclerosis Risk in Communities study. Am J Prev Med. 2006; 30(4): 333–339. 44. Maddock J. The relationship between obesity and the prevalence of fast food restaurants: state-level analysis. Am J Health Prom. 2004; 19: 137–143. 45. Simmons D, McKenzie A, Eaton S, et al. Choice and availability of takeaway and restaurant food is not related to the prevalence of adult obesity in rural communities in Australia. Int J Obes. 2005; 29(6): 708–710. 46. Jeffery RW, Baxter J, McGuire M, Linde J. Are fast food restaurants an environmental risk factor for obesity? Int J Behav Nutr Phys Act. 2006; 3: 2. 47. Mehta NK, Chang VW. Weight status and restaurant availability. A multilevel analysis. Am J Prev Med. 2008; 34(2): 127–133. 48. Bezerra NI, Sichieri R. Eating out of home and obesity: a Brazilian nationwide survey. Public Health Nutr. 2009; 12: 1–7. 49. McKinnon RA, Reedy J, Handy SL, Rodgers AB. Measuring the food and physical activity environments: shaping the research agenda. Am J Prev Med. 2009; 36(4S): S81–S85. 50. Powell LM, Chaloupka FJ, Slater SJ, Johnston LD, O’Malley PM. The availability of local-area commercial physical activity-related facilities and physical activity among adolescents. Am J Prev Med. 2007; 33(4S): S292–S300. 51. Gordon-Larsen P, McMurray RG, Popkin BM. Determinants of adolescent physical activity patterns. Pediatrics. 2000; 105: E83. 52. Jilcott SB, Everson KR, Laraia BA, Ammerman AS. Association between physical activity and proximity to physical activity resources among low-income, midlife women. Prev Chronic Dis. 2007; 4(1): A04. 53. Kaczynski AT, Potwarka LR, Saelens BE. Association of park size, distance, and features with physical activity in neighborhood parks. Am J Public Health. 2008; 98(8): 1451– 1456. 54. McAlexander KM, Banda JA, McAlexander JW, Lee RE. Physical activity resource attributes and obesity in low-income African Americans. J Urban Health. 2009; 86(5): 696–707. 55. Piro FN, Noess O, Claussen B. Physical activity among elderly people in a city population: the influence of neighbourhood level violence and self perceived safety. J Epidemiol Community Health. 2008; 60: 626–632. 56. Bennett GG, McNeill LH, Wolin KY, Duncan DT, Puleo E, Emmons KM. Safe to walk? Neighborhood safety and physical activity among public housing residents. PLoS Med. 2007; 4(10): 1599–1606. 57. São Paulo (city). Article no. 13.399 of 1 August 2002. Refers to the creation, structure, and activities of the Sub municipalities of the city of São Paulo. Câmara Municipal de São Paulo. July 18, 2002.