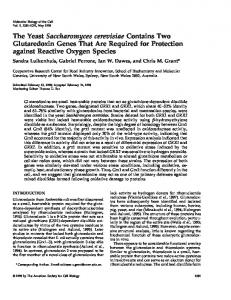
Jun 21, 2006 - available in a query format at http://biopuce.insa-toulouse.fr/jmf/ .... Zymolyase sensitivity test and cell wall composition of yeast cells after drugs treatment. A. Early ..... biogenesis and stress, whereas less than 2% of the dif-.
Molecular Microbiology (2006) 61(5), 1147–1166
doi:10.1111/j.1365-2958.2006.05300.x First published online 1 August 2006
Investigating the caffeine effects in the yeast Saccharomyces cerevisiae brings new insights into the connection between TOR, PKC and Ras/cAMP signalling pathways Klaudia Kuranda,1,2 Veronique Leberre,2,3 Serguei Sokol,3 Grazyna Palamarczyk1 and Jean François2,3* 1 Institute of Biochemistry and Biophysics, Warsaw, Poland. 2 Laboratoire de Biotechnologie et Bioprocédés, UMR-CNRS 5504 & INRA792, Toulouse, France. 3 Biochips – Platform Toulouse Génopole, Toulouse, France. Summary Caffeine is a natural purine analogue that elicits pleiotropic effects leading ultimately to cell’s death by a largely uncharacterized mechanism. Previous works have shown that this drug induces a rapid phosphorylation of the Mpk1p, the final mitogen-activated protein (MAP) kinase of the Pkc1p-mediated cell integrity pathway. In this work, we showed that this phosphorylation did not necessitate the main cell wall sensors Wsc1p and Mid2p, but was abolished upon deletion of ROM2 encoding a GDP/GTP exchange factor of Rho1p. We also showed that the caffeineinduced phosphorylation of Mpk1p was accompanied by a negligible activation of its main downstream target, the Rlm1p transcription factor. This result was consolidated by the finding that the loss of RLM1 had no consequence on the increased resistance of caffeine-treated cells to zymolyase, indicating that the cell wall modification caused by this drug is largely independent of transcriptional activation of Rlm1pregulated genes. Additionally, the transcriptional programme elicited by caffeine resembled that of rapamycin, a potent inhibitor of the TOR1/2 kinases. Consistent with this analysis, we found that the caffeine-induced phosphorylation of Mpk1p was lost in a tor1D mutant. Moreover, a tor1D mutant was, like Accepted 21 June, 2006. *For correspondence. E-mail fran_jm@ insa-toulouse.fr; Tel. (+33) 5 61559492; Fax (+33) 5 61559400. Note to reviewers: The microarray data sets described in this article is available in a query format at http://biopuce.insa-toulouse.fr/jmf/ cellwallgenomics. This work is fully MIAME-compliant and has been deposited at GEO website. The Accession No. is GSE4049.
© 2006 The Authors Journal compilation © 2006 Blackwell Publishing Ltd
mutants defective in components of the Pkc1p-Mpk1p cascade, highly sensitive to caffeine. However, the hypersensitivity of a tor1 null mutant to this drug was rescued neither by sorbitol nor by adenine, which was found to outcompete caffeine effects specially on mutants in the PKC pathway. Altogether, these data indicated that Tor1 kinase is a target of caffeine, whose inhibition incidentally activates the Pkc1pMpk1p cascade, and that the caffeine-dependent phenotypes are largely dependent on inhibition of Tor1pregulated cellular functions. Finally, we found that caffeine provoked, in a Rom2p-dependent manner, a transient drop in intracellular levels of cAMP, that was followed by change in expression of genes implicated in Ras/cAMP pathway. This result may pose Rom2p as a mediator in the interplay between Tor1p and the Ras/cAMP pathway. Introduction Caffeine (1, 3, 7-trimethylxanthine) is an analogue of purine bases, implicated to affect a variety of cellular processes in different organisms including mammals, plants and fungi. Original studies have proposed that caffeine could be an activator of the cAMP-dependent protein kinase pathway, based on the ‘in vitro’ potency of this drug to inhibit the mammalian cAMP phosphodiesterase (Butcher and Potter, 1972; Tsuzuki and Newburgh, 1975). In yeasts and slime moulds, this mode of action is still controversial as some authors reported an increase of cAMP levels (Liao and Thorner, 1981) while others found either no effect on levels of this nucleotide (Tsuboi and Yanagishima, 1973) or that this molecule antagonized the glucose-induced cAMP synthesis (Tortora et al., 1982; Brenner and Thoms, 1984; J. François, unpubl. data). In budding and fission yeasts, high doses of caffeine (⬎ 10 mM) have mutagenic effects that seem to be mediated through inhibition of two phosphoinositide 3-kinase (PI3K)-related protein kinases, Tel1p and Mec1p/Rad3p, the yeast homologues of mammalian ataxia-talengiectasia mutated (ATM) and ATMrelated (ATR) kinases (Moser et al., 2000; Saiardi et al., 2005). More recently, caffeine was also shown to inhibit
1148 K. Kuranda et al. the formation of tumours and to induce apoptosis of those already existing (Lu et al., 2002; Hashimoto et al., 2004). However, the mode by which caffeine triggers these pleiotropic effects is still largely unknown. To enlarge on the previous studies on caffeine, we decided to use a genetically tractable organism, like the yeast Saccharomyces cerevisiae. For this microorganism as well as for other fungi, caffeine is currently used as a phenotypic criterion to evaluate the function of the Mpk1p-mediated cell wall integrity pathway. This is due to the fact that most of the mutants defective in components of cell wall integrity pathway are caffeine-sensitive (Jacoby et al., 1998; Martin et al., 2000; Park et al., 2005). As reviewed by Levin (2005), this pathway is comprised of a family of cell surface sensors and proceeds through the small G-protein Rho1p that activates a linear pathway of mitogen-activated protein (MAP) kinases. Rho1p is activated by Rom2p, a GDP/GTP exchange factor and is inactivated by a set of GTPaseactivating proteins. A cascade of kinases begins with Pkc1p, a homologue of the mammalian protein kinase C, and ends up with the Mpk1/Slt2 MAP kinase. The main known output of this cascade is the activation of SBF and Rlm1 transcription factors, which control, respectively, the expression of the cell cycle-regulated genes at the G1/S transition (Madden et al., 1997) and the cell wall-related genes (Smits et al., 2001; Jung et al., 2002). Overall, the Pkc1p-MAP kinase cascade is constantly guarding the cell integrity and for this reason, it is activated under conditions that jeopardize the cell wall stability. These conditions include high temperature (Kamada et al., 1995), hypotonic shock (Davenport et al., 1995), impairment of the cell wall synthesis (Ketela et al., 1999; Lagorce et al., 2003), exposure to cell wall binding agents such as Calcofluor white and Congo red (Martin et al., 2000; Garcia et al., 2004) as well as response to rapamycin (Torres et al., 2002), an antibiotic that inhibits the TOR function (reviewed in Jacinto and Hall, 2003). Depending on the source and the type of the stimulus, the MAP kinase cascade can be activated at the ‘top’, through the cell surface sensors, or laterally by activating one of the kinases (Harrison et al., 2004). Nevertheless, up to date the question of how caffeine activates the PKC pathway remained unsolved. The purpose of this work was therefore to identify the primary target(s) of caffeine and to determine cellular pathways affected by this drug. To reach this objective, we carried out time-course transcriptomic experiments using sublethal and lethal concentrations of caffeine in order to be able to identify ‘primary’ or direct from indirect transcriptional events. To verify effects of caffeine on the PKC pathway, we compared these transcriptional profiles, with those obtained under identical conditions with Congo red
and Calcofluor white, two well-known cell wall perturbing agents. Concurring to these genome-wide expression analyses, genetic and biochemical data enabled us to propose that caffeine activates the Pkc1p-Mpk1p cascade through Tor1p-mediated signalling, and inhibits the Ras/ cAMP pathway. Both effects are dependent on Rom2p, a GDP/GTP exchange factor.
Results Fifty per cent inhibition of cellular growth (IC50) for caffeine, Congo red and Calcofluor white To separate primary transcriptional events induced by Congo red, Calcofluor white and caffeine from secondary effects that can take place when the treatments are performed for a long time and with high concentrations of the drugs, we estimated the concentrations of these three drugs that caused 50% inhibition of cellular growth (IC50). The maximal growth rate (mmax) for each culture in the absence and in the presence of different concentration of the chemical agents was calculated by fitting an exponential regression over the experimental points, and the IC50 was taken as the value that causes a 50% reduction of the mmax. As shown in Fig. 1, an IC50 value of 50 mg ml-1 was found for Congo red and Calcofluor white, and 8 mM (1.55 mg ml-1) for caffeine. Calcofluor white did not seem to exert further inhibition of growth at concentration higher than 100 mg ml-1. This was likely due to the observation that this compound precipitated in the YPD medium at concentration equal or superior to 100 mg ml-1. The IC50 values for each drug were performed using microtitre plates and confirmed on large cultures carried out in shake flasks (data not shown). Two different concentrations for each drug were then chosen for the subsequent part of the work: one exerting ⬍ 10% of growth inhibition (referred to as ‘non-inhibitory concentration’) and another that was roughly twofold the IC50 value (‘inhibitory concentration’). Thus, in the following experiments, exponential cultures of yeast were exposed to concentrations of 20 mg ml-1 or 100 mg ml-1 of Congo red and Calcofluor white, and to 2 mM or 20 mM caffeine.
Like cell wall drugs, caffeine also induces alteration of the cell wall architecture Cell wall fortification induced by various treatments can be assessed by measuring the susceptibility of yeast cells to the lytic action of the cell wall b-1,3-glucan degrading enzymes such as zymolyase (Ovalle et al., 1998; AguilarUscanga and Francois, 2003). While the cell walls are slowly digested, the cells loose their integrity, leading to cell lysis. This can be measured by a decrease of the
© 2006 The Authors Journal compilation © 2006 Blackwell Publishing Ltd, Molecular Microbiology, 61, 1147–1166
Inhibition of Tor1p by caffeine 1149
Fig. 1. Determination of inhibitory concentration of Congo red (A), Calcofluor white (B) and caffeine (C) on yeast growth. The experiment was carried out using BY4742 cells cultivated in microtitre plates as described in Experimental procedures. The IC50 corresponds to the concentration of the drug that reduces the growth rate (m) to 50% of the control condition.
optical density at 600 nm (OD600). Accordingly, preincubation of yeast cells for 90 min in the presence of inhibitory concentration of Congo red, Calcofluor white or
caffeine resulted in a decreased sensitivity to zymolyase, and this resistance was more pronounced in yeast cells incubated with caffeine (Fig. 2A). Comparable results
Fig. 2. Zymolyase sensitivity test and cell wall composition of yeast cells after drugs treatment. A. Early exponential yeast cells (OD600 = 0.2–0.4) of the BY4742 strain were treated for 90 min with Congo red (CR, 100 mg ml-1), Calcofluor white (CFW, 100 mg ml-1) or caffeine (CAF, 20 mM) prior to zymolyase assay. The cells lysis is expressed as the decrease of OD at 600 nm (in percentage of the initial value). B–D. Cell wall composition (b-glucan, mannan and chitin) measured in yeast cells after 20 h of growth in the absence (C) or in the presence of non-inhibitory or inhibitory concentrations of Congo red (CR; 20 or 100 mg ml-1), Calcofluor white (CFW; 20 or 100 mg ml-1) or caffeine (CAF; 2 or 20 mM).
© 2006 The Authors Journal compilation © 2006 Blackwell Publishing Ltd, Molecular Microbiology, 61, 1147–1166
1150 K. Kuranda et al.
Fig. 3. Dual phosphorylation of Mpk1p in response to Congo red, Calcofluor white and caffeine. A. Early exponential cultures of BY4742 strain (OD600 ~ 0.2–0.4) cultivated in YPD were exposed to ‘non-inhibitory’ or ‘inhibitory’ concentration of Congo red, Calcofluor white or caffeine. At the indicated times samples were taken and Western analysis was performed, using anti-phospho-p44/42 and anti-Mpk1p antibodies, to quantify phosphorylated form and total amount of Mpk1 protein respectively. B. The ratio of phosphorylated Mpk1p and amount of total Mpk1p was calculated from all Western blots. The ratio was normalized to 1 at time 0 for each condition tested, and it represented the fold increase in the phosphorylated Mpk1p. Bars on the histograms give the standard deviation between two independent experiments.
were found in the presence of the non-inhibitory concentration of these drugs when the incubation prior to zymolyase treatment was longer than 5 h (data not shown). Further, we confirmed that this increased resistance to zymolyase was accompanied by changes in cell wall composition because, as we might expect, a higher resistance of caffeine-treated cells to zymolyase was reflected by an increase in the b-glucan content (Fig. 2B). Additionally, chitin levels was increased about twofold as compared with the control conditions (Fig. 2D). Taken together, these results indicated that the cell wall structure was more remodelled in response to caffeine than to Congo red and Calcofluor white. Caffeine can induce an excessive phosphorylation of the Mpk1p that is not seen in response to other cell wall drugs Several reports have shown that treatment of yeast cells with Congo red, Calcofluor white or caffeine led to the activation of the Pkc1p-dependent cell integrity pathway, which was indicated by an increased amount of the dually phosphorylated (Thr190 and Tyr192) form of the Mpk1 kinase (Rajavel et al., 1999; Martin et al., 2000; de Nobel et al., 2000; Flandez et al., 2003; Martin-Yken et al., 2003; Garcia et al., 2004). We further investigated this event in
an attempt to correlate levels of the phosphorylated Mpk1p to the susceptibility of yeast cells to zymolyase and to the activation of its downstream targets, Rlm1p and SBF. To this end, early exponential yeast cultures were treated with ‘non-inhibitory’ and ‘inhibitory’ concentrations of the different drugs. After 5, 15 (results not shown), 90 min and 20 h of treatment, cells were collected and the level of the phosphorylated form of the Mpk1p was determined by Western blotting (Fig. 3A). Levels of phosphorylated Mpk1p were divided by the total amount of this protein detected by anti-Mpk1p antibodies, which was then relativized to the value at time 0 before addition of the drugs. Therefore, data given in Fig. 3B corresponded to the ‘fold increase’ of the phosphorylated Mpk1p. We found that the phosphorylation of Mpk1p upon exposure to non-inhibitory concentrations of three drugs tested was detectable only after 90 min of incubation. While a slightly higher activation in response to inhibitory concentrations of Congo red and calcofluor white was found, the rate and the phosphorylation state of Mpk1p were dependent on caffeine concentrations (Fig. 3), as a 1.5-fold of Mpk1p activation was already measured after 5 min incubation with 20 mM caffeine (data not shown), and reached about 30-fold after 90 min of incubation. Upon longer incubation, the phosphorylated Mpk1p returned to its basal, unphosphorylated form, confirming the transient activation medi-
© 2006 The Authors Journal compilation © 2006 Blackwell Publishing Ltd, Molecular Microbiology, 61, 1147–1166
Inhibition of Tor1p by caffeine 1151 ated by these drugs (Garcia et al., 2004). At this high concentration of caffeine, two additional phosphorylated bands were detected after 1.5 and 20 h of incubation. These bands most likely correspond to Fus3p and Kss1p, as these two related MAP kinases were reported to be recognized in their dually phosphorylated state, using the same anti-phospho-p44/42 MAP kinase antibody in previous works (Bardwell et al., 1998; Sabbagh et al., 2001). However, at this stage of the analysis, it could not be excluded that these additional bands could arise from a Mpk1p degradation that has been triggered in response to high concentrations of caffeine. Altogether, treatment of yeast cells with caffeine led to a faster and more potent activation of the Pkc1p-Mpk1p cascade than incubation with Congo red and Calcofluor white. Thus, higher and sustained activation of the Mpk1p-dependent signalling pathway was at the first glance consistent with the higher resistance of caffeine-treated cells to zymolyase than those treated with Congo red and Calcofluor white. Uncoupling between phosphorylation of Mpk1p and activation of its downstream target Rlm1p in response to caffeine The finding of high levels of phosphorylated form of Mpk1p in response to caffeine prompted us to verify whether the phosphorylation of Mpk1p was accompanied by activation of its two well-known downstream targets, Rlm1 and SBF transcription factors. To this end, we used reporter plasmids p1366 bearing promoter region containing single putative Rlm1 binding site (YIL117c::lacZ), p1435 with deletion of this 10 bp Rlm1 binding sequence (YIL117cDrlm1::lacZ) and pLGL containing a promoter fragment from the HO gene (from -507 to -367) with three SCB elements (Igual et al., 1996; Jung et al., 2002), and we measured b-galactosidase activity before and after 90 min of exposure of the cells to the different drugs. As the lacZ constructs were born on plasmids, we had to carry out these experiments in synthetic media (SD), instead of YEPD. For this reason, we verified that the three drugs still elicited phosphorylation of the Mpk1p in SD medium. As shown in Fig. 4A and B, the caffeine-induced phosphorylation of Mpk1p was lower in yeast cells cultivated in SD than in YPD medium, but still higher than that measured in Congo red-treated cells, and slightly lower than those incubated with Calcofluor white. Taken these data into account, we found that levels of b-galactosidase from the YIL117c::lacZ construct in the cells treated with Congo red and Calcofluor white were, respectively, 10 and 6 times higher than after treatment with caffeine (Fig. 4C). This increase was specifically dependent on Rlm1p, as it was abolished in cells bearing the YIL117cDrlm1::lacZ construct. In agreement
Fig. 4. Effect of Congo red, Calcofluor white and caffeine on Mpk1p phosphorylation, Rlm1 and SBF-dependent transcriptional activity, and on zymolyase susceptibility. A. Early exponential cultures of the wild-type strain (BY4742) cultivated in the SD medium were exposed to 100 mg ml-1 Congo red (CR), 100 mg ml-1 Calcofluor white (CFW) or 20 mM caffeine (CAF). Phosphorylated Mpk1p and total Mpk1p were determined after 90 min incubation by Western blotting as in Fig. 3. B. As in Fig. 3, fold increase of the phosphorylated Mpk1p was calculated for Western blot in (A). The values were an average of two independent experiments. C. Levels of b-galactosidase activity in BY4742 cells carrying plasmids YIL117c::lacZ, YIL117cDrlm1::lacZ or Ho(scb)::lacZ, that were cultivated in SD liquid medium complemented with auxotrophic requirements. Samples were taken before and 90 min after addition of the inhibitory concentrations of the drugs. The values reported were from three independent experiments and bars indicated the standard deviation between the three experiments. D. Zymolyase resistance of the wild type, rlm1D and swi4D mutants after 90 min incubation of cells with the inhibitory concentrations of Congo red (CR), Calcofluor white (CFW) or caffeine (CAF). Resistance was estimated as the percentage of yeast cells that resisted to the lysis after 90 min of digestion with Zymolyase 20-T (50 mg ml-1). Values given are the average ⫾ SE of three independent experiments.
© 2006 The Authors Journal compilation © 2006 Blackwell Publishing Ltd, Molecular Microbiology, 61, 1147–1166
1152 K. Kuranda et al. with the high activation of this Rlm1-dependent gene, the resistance to zymolyase of Calcofluor white- and Congo red-treated cells was strongly impaired upon RLM1 deletion. In contrast, the weak activation of YIL117c upon caffeine treatment was consistent with the negligible effect of RLM1 deletion on the sensitivity of caffeine-treated yeast cells to zymolyase (Fig. 4D). On the other hand, Calcofluor white and caffeine exerted a similar, although relatively weak, increase of the SBF transcriptional activity, as measured with the HO::lacZ gene fusion, while it was almost insignificant in response to Congo red (Fig. 4C). However, deletion of SWI4, a component of the SBF transcription factor, which had no effect on Congo red- and Calcofluor white-induced resistance to zymolyase, caused a higher sensibility of caffeine-treated cells to this b-glucanase (Fig. 4D). To summarize, these results suggested that the caffeineinduced cell wall remodelling was largely independent of Rlm1p, but could be dependent to some extent on SBF transcription factor. They further indicated that activation of downstream targets of Rlm1 are not proportional to the extent of the phosphorylation of Mpk1p or that these two events can be disconnected. Global expression changes in response to caffeine, Congo red and Calcofluor white Results reported above prompted us to consider DNA microarrays as an appropriate tool to explore effects of caffeine on various cellular functions and eventually, to identify differences between its mode of action and those exerted by Congo red and Calcofluor white with respect to cell wall remodelling. We exposed yeast cells to noninhibitory and inhibitory concentrations of each of these drugs and determined genes expression changes at 5, 15 and 90 min after addition of the drugs. The number of genes that were differentially expressed (i.e. either induced or repressed at least 1.5-fold with a P-value ⬍ 0.05) was scored at each time point and for each concentration of the drug (Fig. 5A; the data sets and all other supplementary data are accessible at http://biopuce.insatoulouse.fr/jmflab/cellwallgenomics). As already noticed in previous reports (Boorsma et al., 2004; Garcia et al., 2004), the transcriptional response induced by Congo red and Calcofluor white was a relatively slow process. This result was consistent with the slow rate of Mpk1p activation observed upon exposure of yeast to these agents (see Fig. 3). The observation of the delayed transcriptional response was also consistent with the fact that these agents bind to the cell surface and do not enter the cell (Elorza et al., 1983; Kopecka and Gabriel, 1992). On the other hand, the transcriptional response to caffeine was faster and apparently dependent on the concentration of the drug added to the cultures. At a non-inhibitory
concentration, the global expression change was transient with a maximum of differentially expressed genes (52) peaking at 5 min, to drop to five genes after 90 min incubation. At an inhibitory concentration, the transcriptional response was more intense in the term of number of differentially expressed genes and lasted at least during the 90 min of incubation. Taken together, these results indicated that caffeine was rapidly internalized causing immediate changes in the gene expression, and then it was neutralized or expulsed from the cells. Similarities and differences in cellular targets between caffeine, Congo red and Calcofluor white as deduced from expression data In Table 1, an overview of the transcriptional responses elicited by caffeine, Congo red and Calcofluor white is presented. The combined transcriptomic data sets obtained at different time points and with different concentrations of the drugs were distributed into seven major functional classes. As indicated in this table (more details on functional categories calculated according to SGD Term finder can be found in Table S1 in Supplementary material), main categories in the transcriptomic response to caffeine were transport, RNA metabolism, organelles biogenesis and stress, whereas less than 2% of the differentially expressed genes belonged to the cell wall remodelling category. In contrast, this latter category was the most significantly represented in response to Congo red, whereas categories of genes implicated in RNA metabolism, organelles biogenesis and response to stress were weakly represented. Genes whose expression was affected in response to Calcofluor white were evenly distributed between these seven functional categories. It could be noticed that the cell wall maintenance and remodelling category was surprisingly weakly represented, in comparison with the well-known action of this drug on the yeast cell wall (Roncero and Duran, 1985). Table 2 provides the list of genes implicated in cell wall category whose expression was changed in response to Congo red, Calcofluor white or caffeine under our conditions and in other published works. Two major conclusions could be drawn from this table. First, a set of genes (CWP1, SRL3, PIR1, PIR2, PIR3, YLR194C, etc.), which were all present in the transcriptional fingerprint of the cell wall stress (Lagorce et al., 2003; Boorsma et al., 2004; Garcia et al., 2004) and whose activation relied on the Mpk1p-dependent activation of the Rlm1 transcription factor (Garcia et al., 2004), were induced by Congo red and Calcofluor white independently of the concentration added to the medium. The second observation was that the large majority of cell wall-related genes activated in response to caffeine do not harbour any Rlm1 binding site in their promoter (see Table S2 in Supplementary
© 2006 The Authors Journal compilation © 2006 Blackwell Publishing Ltd, Molecular Microbiology, 61, 1147–1166
Inhibition of Tor1p by caffeine 1153
Fig. 5. Functional analysis of the transcriptomic response to Congo red, Calcofluor white and caffeine. A. Number of genes whose expression changed, after 5, 15 and 90 min, due to the Congo red, Calcofluor white and caffeine treatment. The threshold of expression changes was 1.5-fold with a P-value ⬍ 0.05. Detailed lists of differentially expressed genes can be found in Supplementary material. B. Correspondence Analysis of expression after 90 min of growth with 100 mg ml-1 Congo red (CR), 100 mg ml-1 Calcofluor white (CFW) and 20 mM caffeine (CAF) in comparison with the control conditions (C). Genes are represented by grey dots and axes illustrate the major trend according to the condition medians. Blue and green dots represent genes known to be regulated by TOR that were upregulated and downregulated, respectively, in response to caffeine. Names of these genes are listed in Fig. S1 in Supplementary material. Red dots represent cell wall genes (listed in Table 2) whose expression changed in response to one of these three drugs. The centroid is empty because normally expressed genes were filtered out from the analysis.
material). Altogether, these results consolidated the notion that caffeine does not cause cell wall remodelling through activation of Rlm1-dependent genes, even though this drug triggers a potent activation of the Pkc1pMpk1 kinase cascade. In order to better disclose the differences in transcriptional responses between caffeine and the two other drugs, we analysed the expression data sets using the correspondence analysis software developed by Fellenberg et al. (2001). This method is an explorative statistical tool for the study of association between variables (expression profiling from different conditions, for
instance). To illustrate major trends in the data sets, while ignoring the minor fluctuations, the data were expressed as a planar projection along axes, whose number corresponded to the number of conditions. Similarities between conditions were shown as a distance between the axis. It can be seen in Fig. 5B that the axes of Congo red and Calcofluor white are closer to each other than to caffeine. Furthermore, the axis of Congo red is the closest one to that of the control condition, which is consistent with this condition displaying the smallest number of differentially expressed genes. This analysis also highlighted association of genes involved in the cell wall assembly mainly to
© 2006 The Authors Journal compilation © 2006 Blackwell Publishing Ltd, Molecular Microbiology, 61, 1147–1166
1154 K. Kuranda et al. Table 1. Distribution of genes affected by Congo red, Calcofluor white and caffeine between functional categories. Number of genes (%)
Functional category
Congo red
Calcofluor white
Caffeine
Cell wall remodelling Carbohydrates metabolism Transport RNA metabolism Organelle biogenesis Response to stress Others Unknown
14.3 10.2 10.2 ⬍1 ⬍1 ⬍1 22.3 43.0
4.5 3.6 4.5 9.1 8.2 7.3 15.5 47.3
2.0 5.5 16.2 8.9 6.9 6.7 24.8 29.0
The total number of genes whose expression was significantly changed according to our statistical criteria (⫾1.5-fold change; P-value ⬍ 0.05) in response to non-inhibitory and inhibitory concentrations of Congo red (42 genes), Calcofluor white (59 genes) and caffeine (505 genes) was added throughout the time-course experiment. They were then distributed in major functional categories according to SGD (http://yeastgenome.org). Reported values correspond to the percentage of genes in a given category relative to the total number of differentially expressed genes for a given drug.
Congo red and Calcofluor white axes. For instance, CWP1, SRL3, PIR1, PIR2 and PIR3, which were induced by both drugs, were located approximately halfway between the axes of these two conditions. On the other hand, the farther away the differentially expressed genes were from the centroid, the closer they were associated with a given condition. Inspection of genes responding exclusively to caffeine revealed two clusters of genes comprised of 35 upregulated genes (involved mainly in nitrogen discrimination pathway and carbohydrate metabolism) and 21 downregulated genes (involved in ribosome biogenesis). Genes in both clusters were known to be regulated by the TOR pathway. Transcriptomic response to caffeine resembles response to rapamycin, an inhibitor of the TOR pathway To investigate whether caffeine interferes with cellular functions regulated by the TOR pathway, we compared the transcriptomic response induced by this drug with that of rapamycin, an inhibitor of the Tor1/2 kinases (Cardenas et al., 1999; Hardwick et al., 1999; Komeili et al., 2000; Shamji et al., 2000). Using a Venn diagram (Fig. 6), we found out that caffeine and rapamycin caused a downregulation of the same genes that are implicated in transcription, ribosome assembly and protein synthesis, while they stimulated expression of genes involved in the tricarboxylic acid (TCA) cycle, the Rtg1/3p-controlled retrograde pathway and the Gln3p/Gat1p-controlled nitrogen catabolite repression (NCR). Additionally, we noticed a fivefold induction of MAF1, a gene responsible for repression of polymerase III transcription upon TOR depletion (Pluta et al., 2001; Upadhya et al., 2002) and a transient
2.5-fold increase of GLN3 and GAT1 in cells treated with 20 mM caffeine (more details on the quantitative effect in Fig. S1A in Supplementary material). Consistent with these transcriptomic data, we found that incubation of yeast cells with 20 mM caffeine promoted a nuclear localization of Rtg1p–GFP protein fusion (data not shown), although in a less pronounced manner than that caused by rapamycin (Komeili et al., 2000). Moreover, we found that, like for rapamycin (Cardenas et al., 1999; Xie et al., 2005), ure2D and rtg1D mutations conferred increased sensibility to caffeine, whereas a gln3D mutant showed slight resistance to this drug (data not shown). Two additional relevant transcriptomic responses elicited by caffeine, which were, however, less prominent in yeast cells treated with rapamycin, were a hyperactivation of the Aro80p-regulated pathway implicated in the degradation of phenylalanine into phenylethanol (Fig. S2 in Supplementary material) (Vuralhan et al., 2003), and the transcriptional change of several genes related to transport functions. As reported in Table 3, caffeine may alter transport of metabolites and ions (sugars, amino acids, protons, Cu+, Fe2+), as well as the translocation of proteins between cellular compartments. These data were consistent with previous large-scale phenotypic data indicating that mutations in genes implicated in multidrug resistance (PDR2), in pH osmeostasis (RIM21), in vacuoles biogenesis (VAC7, VAC17) and protein trafficking between Golgi-cytosol and vacuoles (COG5, SYS1, CCZ1) are hypersensitive to caffeine (Bianchi et al., 2001). Some of the caffeine effects could be accounted for an inhibition of TOR function, such as the upregulation of genes encoding uptake of poor amino acids (Cooper, 2002; Powers et al., 2004). Interestingly, caffeine activates expression of SNQ2, QDR3 and MDL2 that encode putative drug transporters (Nelissen et al., 1997). It is possible that these transporters participate in the expulsion of caffeine from the cell, as it is probably the case for SNQ2 which has been reported as a multicopy suppressor of caffeine sensitivity of mpk1D mutant (Martin et al., 2000). In spite of several similarities, important differences between response to caffeine and rapamycin need to be pointed out, which indicated that these two agents do not have identical spectrum of cellular effects. First, the overlap of the expression data between caffeine and rapamycin amounted to 25%, although care must be taken with this estimation as the experiments were not carried out under the same conditions (Cardenas et al., 1999; Hardwick et al., 1999). Second, while addition of rapamycin caused growth arrest in the early G1 phase (Barbet et al., 1996), caffeine did not arrest cell division at any specific stage of the cell cycle even at the highest (20 mM) concentration tested (data not shown). Third, caffeine caused expression changes of several genes that are directly or indirectly implicated in the Ras/cAMP
© 2006 The Authors Journal compilation © 2006 Blackwell Publishing Ltd, Molecular Microbiology, 61, 1147–1166
CWP1 HSP12 SRL3
YKL096W YFL014W YKR091W YAL053W YLR414C YMR315W YLR194C YBR071W YJL108C YNL058C YHR097C YLR121C YKL164C YJL159W YKL163W YCL040W YHR142W YKR013W YHR209W YDL072C YOL052CA YPR030W YDR483W YBL061C YPR159W YIL146C YMR062C YGR032W YDR528W YGR059W YAL059W
© 2006 The Authors Journal compilation © 2006 Blackwell Publishing Ltd, Molecular Microbiology, 61, 1147–1166 1.51
3.23 1.71
2.1 2.55 5.44 1.99
1.8 1.46
1.67
3.63 3.92 2.26 1.89 1.58 1.79
CFW1
1.78 1.86 1.82 2.04 3.8 5.9 1.8 1.72 1.64 2.97 1.85 1.56
3.88 4.12 1.88 2.27 2.47 1.99 3.07 2.02
CFW2
2.28 1.52
1.74 2.31 1.49 1.62 2.4 1.9 1.62 2.25 2.24 5.56
1.48 2.05 1.59 1.5 2.18 1.66 1.63 2.37 2.84 4.6 1.52 1.55
1.67 1.61
1.68 1.6 3.24 1.65
5.68 1.76 2.52 1.88
CR2
4.27 1.6 1.75 1.44
CR1
CAF1
1.5 1.95 2.1 2.0 1.5 3.3 0.59 0.54 0.57
2.9
2.24
11.1
CAF2
*
*
* *
* * * * * * * * * * * *
CW a
*
*
* * * * * * * * * * * * * * * * * * *
CR b
*
* * *
* * * * * * * * *
CFW c
Fingerprint of cell wall stress
Cell wall mannoprotein Response to stress Function unknown Function unknown Function unknown Function unknown Function unknown Function unknown Pheromone-regulated protein Function unknown Function unknown GPI-anchored aspartic protease Structural constituent of cell wall Structural constituent of cell wall Structural constituent of cell wall Glucokinase Involved in chitin synthesis Function unknown S-adenosylmethionine-dependent methyltransferase Function unknown Response to stress Chs5 Spa2 rescue a-1.2-mannosyltransferase Activator of Chs3p 1,6-b-glucan synthase Function unknown Acetylornithine acetyltransferase 1.3-b-glucan synthase Function unknown Septin Function unknown
Description
a. CW – upregulated genes in the following cell wall mutants fks1D, kre6D, mnn9D, gas1D and knr4D (Lagorce et al., 2003). b. CR – genes induced after 2, 4 and 6 h of treatment with 30 mg ml-1 Congo red (Garcia et al., 2004). c. CFW – genes induced after 2 h of treatment with 10 mg of CFW (Boorsma et al., 2004). Values correspond to the ratio of expression after 90 min of incubation with Congo red (CR1 = 20 mg ml-1; CR2 = 100 mg ml-1), Calcofluor white (CFW1 = 20 mg ml-1; CFW2 = 100 mg ml-1) and caffeine (CAF1 = 2 mM; CAF2 = 20 mM). Activation of these genes in independent studies of the yeast cell wall is indicated by an asterisk.
YET3 DDR2 CSR2 KRE2 SKT5 KRE6 ECM37 ECM40 GSC2 HLR1 SPR3 ECM1
YPS3 PIR1 PIR2 PIR3 GLK1 CHS7 PRY2
PRM10
Gene
ORF
Ratio of expression
Table 2. List of genes implicated in cell wall remodelling whose expression was modified in response to Congo red, Calcofluor white or caffeine and comparison with other published conditions.
Inhibition of Tor1p by caffeine 1155
1156 K. Kuranda et al.
Fig. 6. Comparison of expression data from cells treated with caffeine, rapamycin and pde2D mutant. Venn diagram from the BioPlot software was used to find similarly expressed genes in the data sets of rapamycin (Hardwick et al., 1999), caffeine (this work) and pde2D mutant (Jones et al., 2003). The differentially expressed genes that showed up in at least two conditions are given in this figure with their functional category (activation – arrowheads or repression – slash heads).
pathway (Fig. 6 and also Fig. S1B in Supplementary material), while genes in this signalling pathway were apparently not found in the transcriptomic response to rapamycin. Tor1 kinase and Rom2 protein mediated the caffeine-induced activation of Mpk1p Once demonstrating that caffeine caused a strong activation of the Pkc1p-Mpk1p cascade, while harbouring several similarities to rapamycin in terms of transcriptomic and phenotypic responses, we raised the hypothesis that the caffeine signalling to Mpk1p may occur through the inhibition of the TOR pathway. We used mutants in the TOR and PKC pathways to test this hypothesis and to verify the relation between sensitivity to caffeine and activation of the Pkc1p-Mpk1p cascade. As shown in Fig. 7A, the caffeine-induced phosphorylation of Mpk1p was lost in a tor1D mutant, while it was maintained in a TOR1-1 mutant that is insensitive to rapamycin. Interestingly, the phosphorylation of Mpk1p could be recovered almost to the wild-type level in a tor1D mutant that expressed a TOR2-1 dominant allele which is also insensitive to rapa-
mycin (Heitman et al., 1991). These data suggested that caffeine exerted its effect through a direct interaction of the Tor kinase. The finding that the caffeine-induced phosphorylation of Mpk1p was conserved in mutant defective in NIR1, which encodes a protein proposed to regulate the TOR activity via polyphosphoinositide binding (Huang et al., 2004), supported this hypothesis. The next step was to elucidate at which level the observed cross-talk between TOR and MPK1 kinases might take place. Previous work from Molina’s group (Martin et al., 2000) showed that the caffeine-induced phosphorylation of Mpk1p was dependent on Rho1p and Mkk1p kinase. Consistent with these data, the effect of caffeine on Mpk1p phosphorylation was abolished in bck1D mutant, as well as in a mutant defective in ROM2 which encodes the GDP/GTP exchange factor for Rho1p (Fig. 7B). Remarkably, we found that the caffeine signalling to Mpk1p did not require any of the two major cell wall sensors encoded by WSC1 and MID2. Furthermore, even a double mutant wsc1Dmid2D, which is not lethal in our strain background contrary to other report (Philip and Levin, 2001), was able to induce Mpk1p phosphorylation in response to caffeine (Fig. 7B).
© 2006 The Authors Journal compilation © 2006 Blackwell Publishing Ltd, Molecular Microbiology, 61, 1147–1166
Inhibition of Tor1p by caffeine 1157 Table 3. List of genes implicated in transport whose expressions were changed after 5, 15 or 90 min incubation with 20 mM caffeine. Biological process
Genes
Vesicle mediated transport
CHS7, SED5, YKT6, DID4, MYO2, VRP1, PEP8, PEP5, COG8, VPS13, VPS35, SEC5, SNC2, TRS130, YIP4, YIP5, BRE4 VTH1 SEC14, BFR2 VTH1, VMA13, RAV2, TFP1 DID4PEP8 VPS13 VPS35 SED5 TRS130BFR2 CHS7 SEC5, SNC2, SEC14 SED5, YKT6, COG8 VTH1 PEP5 NUP188 NUP100NUP116 KAP122 NOC2 NOG1 ECM1 YRA1, ARC1 SAM35, TIM22, TOM20, MGE1, CYC2, MIM1 DJP1, PEX13, PEX18 HSE1, MON2, ARP5, VPS3, VPS63 ERF2, SSA4 TPO2, TPO3, TPO4 AGP2, AVT6, GNP1, AGP1, DIP5, MMP1 AGP2 VHT1 PHO3 HXT5, HXT11, HXT13 CCC2, FET4, CTR2 MEP2 DAL5 SNQ2, QDR3, MDL2
Vacuolar transport Protein-Golgi retention ER to Golgi transport Golgi to plasma membrane transport Intra-Golgi transport Golgi to vacuole transport Golgi to endosome Protein-nucleus transport RNA transport Protein-mitochondrial targeting Protein-peroxisome targeting Protein-vacuolar targeting Membrane targeting Polyamine transport Amino acid transport Vitamine transport Hexose transport Copper ion transport Ammonium transport Allantoate transport Multidrug transport
Upregulated genes (with fold increase ranging from 1.5- to ⬎ 10-fold) are in bold and downregulated genes (with fold decrease ranging from 0.66to 0.15-fold) are in italic. See value of the expression ratio at http://biopuce.insa-toulouse.fr/jmflab/cellwallgenomics. ER, endoplasmic reticulum.
Together, these results raised the question whether the caffeine sensitivity was linked to the Pkc1p-Mpk1pdependent cell integrity pathway. To test this hypothesis, we examined the sensibility of mutants in the TOR and PKC1 pathways with respect to levels of Mpk1p phosphorylation. Results in Fig. 8 showed that tor1D and nir1D strains, two mutants of the TOR pathway, were extremely sensible to caffeine even at a low (2 mM) concentration. However, the loss of TOR1 was not accompanied by the caffeine-induced activation of Mpk1p, while this activation still took place in the nir1D mutant similarly as in a wild type (Fig. 7B). Likewise, mutants defective in
the two major cell wall sensors Mid2p and Wsc1p showed caffeine-induced phosphorylation of Mpk1p while they were more sensitive than the wild type to this drug (data no shown). To consolidate the notion that the hypersensitivity of tor1D mutant was to a great extent independent of the Pkc1p-Mpk1p-mediated cell wall integrity pathway, we found that sorbitol, an osmolyte compound known to rescue growth of mutants impaired in this pathway (see Levin, 2005 and our results in Fig. 8B), did not release growth inhibition of the tor1D mutant by caffeine (Fig. 8B). On the other hand, an earlier study proposed that caffeine was actively imported into yeast cells by a purine perFig. 7. Caffeine signalling to Mpk1p involves inhibition of Tor1p and is mediated through Rom2p. A. Mpk1p phosphorylation upon treatment of caffeine depends on a functional TOR1 activity. Exponential cultures of tor1D, TOR1-1, TOR2-1 tor1D, nir1D mutants and their wild types were grown for 90 min in YPD with 20 mM caffeine (+) or without any additions (–). Phosphorylated Mpk1p and total Mpk1p levels were determined by Western blotting as in Fig. 3. B. Rom2p is required for caffeine-induced Mpk1p phosphorylation. Mutants of the Pkc1p-Mpk1p pathway (wsc1D, mid2D, wsc1Dmid2D, rom2D, bck1D) and their isogenic wild type were treated as in (A).
© 2006 The Authors Journal compilation © 2006 Blackwell Publishing Ltd, Molecular Microbiology, 61, 1147–1166
1158 K. Kuranda et al.
Fig. 8. Caffeine sensitivity of mutants impaired in the TOR and PKC pathways and the effect of adenine or sorbitol supplementation. A. Caffeine sensitivity of mutants in the TOR pathway. Serial dilutions of exponentially growing culture of each mutant were spotted onto YPD agar plates containing 0 or 5 mM caffeine. B. Effect of adenine and sorbitol on caffeine sensitivity of mutants of the PKC and TOR pathways. Serial dilutions of mutants were spotted onto YPD agar plates containing 2 mM caffeine and supplemented with either 20 mM adenine (Ade) or 1 M sorbitol (Sorb). In all conditions, growth was scored after 2 days at 30°C. C. Effect of adenine and sorbitol on caffeine-induced phosphorylation of Mpk1p. Early exponential cultures of BY4742 cultivated in YPD at 30°C in the absence (control), or in the presence of either 20 mM adenine (Ade) or 1 M sorbitol (Sorb) were treated for 90 min with 20 mM caffeine. Levels of phosphorylated Mpk1p and total Mpk1p were determined by Western blotting as in Fig. 3.
mease (Bard et al., 1980). Therefore, we sought to reduce the caffeine-dependent effects by adding adenine to the growth medium. Accordingly, we found that the sensitivity of mutants in the Pkc1p-Mpk1p pathway to caffeine (added to the plates at 2 mM, see Fig. 8; or 5 mM, see Fig. S3) was largely alleviated in the presence of 20 mM adenine. This effect was also observed in a TOR1-1 and a nir1D strains, but not in a tor1D mutant (Fig. 8B). Remarkably, and contrary to the sorbitol effect, inclusion of adenine in the medium led to high phosphorylation of Mpk1p, and this effect was slightly enhanced upon addition of caffeine (Fig. 8C). Although this effect merits further investigation, it showed that the mode of adenine and sorbitol action to release growth inhibition of mutants by caffeine were clearly different. Caffeine affects cAMP signalling in yeast through ROM2 protein Together with TOR kinases, the Ras/cAMP pathway is responsible for the control of growth in response to nutrients availability. This pathway was also suggested to relay TOR control to some cellular functions (Schmelzle et al., 2004). In the transcriptomic response to caffeine, we iden-
tified expression changes of several genes that belonged to the Ras/cAMP cascade (Fig. S1B in Supplementary material). These genes included CYR1 (adenylate cyclase) and TPK3 (catalytic subunit of PKA), as well as genes that regulated the functioning of this cascade such as RAS2, coding for a positive regulator of adenylate cyclase, ERF2, encoding a protein whose loss of function mislocalizes Ras2p (Bartels et al., 1999), RPI1, which encodes an inhibitor of the Ras/cAMP pathway (Kim and Powers, 1991), and PDE1, coding for cAMP phosphodiesterase (Sass et al., 1986; Nikawa et al., 1987). Moreover, as indicated in Fig. 6, we identified a set of 14 genes whose expression was affected upon both an artificially increased level of cAMP in the cell through deletion of PDE2 (Jones et al., 2003) and exposure to caffeine, but the expression changes went exactly in the opposite direction. These data suggested that caffeine may cause an inhibition of the Ras/cAMP cascade. This hypothesis was confirmed by two experimental data. First, we showed in Fig. 9A that the addition of caffeine to early exponentially growing cells triggered a rapid but transient decrease in the intracellular level of cAMP, with an effect that was significant at 20 mM caffeine (Fig. 9A). In addition, we showed that this decrease of cAMP induced by
© 2006 The Authors Journal compilation © 2006 Blackwell Publishing Ltd, Molecular Microbiology, 61, 1147–1166
Inhibition of Tor1p by caffeine 1159
Fig. 9. Caffeine induced a transient decrease in intracellular level of cAMP, which is abolished in a rom2D mutant. A. Early exponential culture (OD600 ~ 0.2–0.4) of the wild-type strain (BY4742) in YPD medium was treated with caffeine at a final concentration of 0, 2 or 20 mM. Samples were taken at indicated times to measure cAMP. Bars indicate standard deviation derived from duplicates of three independent experiments. B. Similar as in (A), except that cAMP was measured in the wild type (CML128) and in rom2D mutant after addition of 20 mM caffeine.
caffeine was not detectable in a rom2D mutant (Fig. 9B). Second, and consistent with our transcriptomic data, we found that yeast strains with low PKA activity such as ras2D or tpk1wtpk2Dtpk3D mutants were slightly more sensitive to caffeine than their isogenic wild type, whereas the converse was found for mutant strains such as ira1Dira2D harbouring high PKA activity (see Fig. S4 in Supplementary material). Taken together, these result showed that caffeine had an opposite effect on the cAMP level in yeast as compared with that in mammalian cells (Naderali and Poyser, 1997; Jafari and Rabbani, 2000; Belibi et al., 2002). Discussion Results presented here allow proposing Tor1 kinase as a target of the caffeine action in yeast, whose inhibition
leads to the activation of the Pkc1p-Mpk1p cascade, and that this activation is not important for cell survival in the presence of this drug. These conclusions are based on genome-wide expression analysis, complemented by genetic and biochemical data, showing that the response of yeast cells to caffeine resembled the response to rapamycin, an inhibitor of both Tor1 and Tor2 kinases. With respect to the caffeine response, TOR1 could be apparently replaced by the TOR2-1 dominant allele as it was able to overcome caffeine sensitivity of a tor1D mutant and to restore the caffeine-induced Mpk1p phosphorylation. This result can be explained if we assume that Tor2-1 kinase variant exhibits kinetic properties similar to those of Tor1p. An alternative but not excluding possibility is that Tor2-1p may take over the function of Tor1p due to its delocalization from the vacuolar surface (Cardenas and Heitman, 1995), and hence becoming accessible to caffeine. Whatsoever the exact mechanism, the relative specificity of caffeine on Tor1p may explain the narrower spectrum of transcriptional responses induced by this drug when compared with rapamycin. On the one hand, both caffeine and rapamycin can induce the Gln3pdependent nitrogen catabolite-repressed genes, activate Rtg1p/Rtg3p-regulated specific TCA and anaplerotic reactions and downregulate genes involved in ribosomes biogenesis (Cardenas et al., 1999; Hardwick et al., 1999; Shamji et al., 2000). This can suggest a predominant role of Tor1p over Tor2p in controlling these functions, a conclusion that could not be reached using rapamycin as this drug inhibits both TOR proteins (Barbet et al., 1996). On the other hand, unlike rapamycin, caffeine did not cause growth arrest at the G1 phase of the cell cycle or actin delocalization (K. Kuranda, unpublished data), effects that are supposed to be mainly dependent on the Tor2p function (Kunz et al., 1993; Helliwell et al., 1998). While we observed effects consistent with Tor1p inhibition, the exact mechanism by which caffeine exerted this effect remains to be explored. This mechanism should be distinct from the action of rapamycin and, hence, independent of the binding between Tor1p and the FKBP12 protein, as the rapamycin-insensitive Tor1-1p was still able to mediate caffeine-induced signal to Mpk1p. Additionally, one cannot exclude that the caffeine effect requires the presence of a specific partner of Tor1p. In yeast, Tor1p and Tor2p function in two distinct protein complexes, named TOR complex 1 (TORC1, which contains Tor1p or Tor2p and several protein partners) and TOR complex 2 (TORC2 containing only Tor2p and its protein partners) (Martin and Hall, 2005). As Tor2p is not implicated in the caffeine effect, protein members of the TORC2 could be excluded. Likewise, Lst8p that is present in both complexes is probably not involved either (Loewith et al., 2002). On the other hand, involvement in the caffeine signalling of Tco89p that interacts specifically with
© 2006 The Authors Journal compilation © 2006 Blackwell Publishing Ltd, Molecular Microbiology, 61, 1147–1166
1160 K. Kuranda et al. Tor1p is very unlikely as the loss of TC089 did not induce the transcriptional read-outs associated with inhibition of TOR function (Reinke et al., 2004), leaving Kog1p as the remaining candidate. At last, the most probable scenario is that caffeine in yeast directly inhibits Tor1 kinase (McMahon et al., 2005). This action of caffeine could be likely extended to the two other PI3K-related kinases, Tel1p or Mec1p, previously proposed to be involved in yeast response to caffeine (Moser et al., 2000; Saiardi et al., 2005). This proposition is supported by the finding that the mammalian counterparts of these kinases, ATM and ATR, were shown to be inhibited by caffeine in vitro (Blasina et al., 1999; Hall-Jackson et al., 1999). Thus, it will be interesting to examine further the sensibility of these three PI3K-related kinases to the action of caffeine in order to confirm our hypothesis and then to evaluate which of them is the most sensitive target of this drug in yeast and mammalian cells. Our studies on caffeine effects showed that Rom2p is critical in the cross-talk between TOR and PKC. They further suggest that this guanine nucleotide exchange factor may also link TOR to the Ras/cAMP signalling, although our genetic data could not exclude a direct effect of caffeine on Ras/cAMP, independently of its action on Tor1 kinase. A functional interplay between TOR and the RAS/cAMP pathway has been examined in two previous reports, but the conclusion from these two studies were somehow contradictory. Cardenas and co-workers concluded that the two pathways function in a co-ordinate manner but independently of one another to govern similar cellular functions (Zurita-Martinez and Cardenas, 2005), while Hall’s group provided experimental evidence suggesting that the Ras/cAMP is a TOR effector pathway (Schmelzle et al., 2004). Our data seem to be in accordance with the latter proposition, as well as with results of Park et al. (2005) showing that Rom2p was able to inhibit the Ras/cAMP signalling and to activate the Rho1p-Pkc1p pathway, both effects being synergistic to promote resistance of cells to various types of stress. With respect to the cross-talk between TOR and PKC, our data are in part in agreement with those of Torres et al. (2002) that linked the rapamycinsensitive Tor activity to the Pkc1p integrity pathway. However, main difference with our data was that the rapamycin signalling from Tor1p to Pkc1p was partially dependent on Rom2p and that the rapamycin-induced phosphorylation of Mpk1p was partially reduced upon deletion of WSC1 and MID2 encoding the two major cell wall sensors. Moreover, these authors showed that the rapamycin signalling to PKC pathway was suppressible by addition of sorbitol, which was consistent with defects in cellular integrity involving stress at the plasma membrane and/or the cell wall (Kamada et al., 1995; de Nobel et al., 2000). Curiously, a similar suppression by
sorbitol of the caffeine-induced phosphorylation of Mpk1p was observed, even though both Wsc1p and Mid2p were dispensable for this activation. This result together with the fact that caffeine hypersensitivity of mutants in the Pkc1p-Mpk1p cascade was invalided by inclusion of sorbitol in the growth medium is indication that the cell integrity defect was the main cause of their sensibility to caffeine. However, several experimental data indicated that the caffeine-dependent phenotypes do not mainly operate through a Pkc1p-Mpk1p-dependent pathway. While cell wall structure of caffeine-treated cells was significantly altered, this structural remodelling was, in contrast to Calcofluor white and Congo red, largely independent of Rlm1p-dependent transcriptional activation mediated by the Pkc1p-Mpk1p cascade. Our genetic and transcriptomic data indicated that this remodelling of the cell wall induced by caffeine is a rather complex process, implicating in part the other transcription factor SBF regulated by the Pkc1p-Mpk1p cascade, the general stress response, as well as transcriptional activation mediated by RPI1, which codes for a transcription factor that contributes to cell wall biogenesis in a Pkc1p-independent manner (Sobering et al., 2002). More importantly, the hypersensitivity to caffeine was not correlated with the phosphorylation/activation state of Mpk1p. In fact, our experiments allowed to distinguish two groups of caffeinedependent phenotypes. A first group comprised mutants (rom2D, bck1D, mpk1D, tor1D) that were caffeinehypersensitive and unable to phosphorylate Mpk1p in response to this drug, while the second group contained caffeine-hypersensitive mutants (wsc1D, mid2D, wsc1Dmid2D, TOR1-1, nir1D) that were still able to activate Mpk1p as in the wild type. Therefore, it is possible that increased phosphorylation of Mpk1p is just a side-effect of Tor1p inhibition by caffeine, and it is not important for the cell survival in the presence of this drug. In favour of this idea, it was shown that expression of a constitutively activated allele of RHO1 could not overcome caffeine hypersensitivity of rom2D mutant (Park et al., 2005). Conversely, inclusion of adenine in the growth medium could overcome the caffeine hypersensitivity of mutants in the Pkc1p-Mpk1p pathway while the phosphorylation levels of Mpk1p was maintained very high in this condition. Having discarded the Pkc1p-Mpk1p pathway in maintaining cell viability in response to caffeine, we actually propose that most of the cellular defects induced by this drug operate through inhibition of Tor1p-controlled functions. Furthermore, at least two distinct cellular functions are likely implicated in caffeine effects, with one of them being suppressible by the osmotic stabilizer sorbitol, as illustrated in experiments using the rapamycinresistant TOR1-1 mutant. Based on what is known about the sorbitol effect, we postulate that this specific caffeine-
© 2006 The Authors Journal compilation © 2006 Blackwell Publishing Ltd, Molecular Microbiology, 61, 1147–1166
Inhibition of Tor1p by caffeine 1161 sensitive Tor1p-associated function is required for maintenance of cell wall integrity. The other caffeine-sensitive Tor1p-controlled function is probably not linked to cell wall structure as indicated by the failure of sorbitol to rescue the hypersensitivity of tor1D mutant to caffeine. The identity of this Tor1p-regulated cellular function whose inactivation renders cells highly sensitive to caffeine needs further investigation. However, it is important to mention that mutants defective in function unlinked to cell wall integrity such as stability and transmission of chromosomes, protein trafficking between Golgi and vacuoles as well as vacuoles biogenesis were shown to be hypersensitive to caffeine (Bianchi et al., 2001). Consistently, our transcriptomic data revealed that expression of many genes implicated in these cellular functions were altered in response to caffeine. Finally, it is worth to point out two additional findings, which somehow help to elaborate the mode of action of caffeine in yeast. On the one hand, the expression of a TOR2-1 allele that codes for a rapamycininsensitive Tor2p kinase can rescue the hypersensitivity of tor1D mutant to caffeine. While this result is consistent with the existence of cross-talks between TOR1 and TOR2 with respect to the control of cell integrity, it showed in this particular situation that the TOR2-1 protein variant does not have the same spectrum of activity as that of the wild-type Tor2p. The other observation was that adenine was able to alleviate the sensitivity of a mutant strain bearing a rapamycin-insensitive TOR1-1 allele but not that of a tor1D mutant to caffeine. The effect of adenine was initially thought to be due to an outcompetition for caffeine entrance into the cells, as it was reported that this drug could enter the cells by the purine permease (Bard et al., 1980). This interpretation must be reconsidered in the light of this observation and with the fact that a fcy2D mutant defective in this purine permease did not confer resistance to caffeine (K. Kuranda and J. François, unpublished data). Altogether, our results favour the hypothesis that adenine may act as an antagonist of the caffeine action on Tor1p. This antagonistic action that may release the inhibition of Tor1p, yet probably disturbed the activity of this protein kinase, which incidentally alters the Pkc1p-Mpk1p cascade as indicated by hyperphosphorylation of Mpk1p in response to adenine alone. This hypothesis is currently under investigation. To summarize, our investigation on caffeine effects in yeast has reinforced previous works suggesting a connection of TOR with the Pkc1p-mediated cell integrity and the Ras/cAMP-dependent signalling pathways. However, with respect to the caffeine phenotypes, these two latter signalling pathways bear little relevance in resistance to this drug, which is otherwise highly dependent on TOR1 protein. The challenge at hand is now to identify what are these Tor1p-regulated functions that confer protection of cells to caffeine.
Experimental procedures Yeast strains, media and tests of sensitivity to cell wall drugs Wild-type and mutant strains of the yeast S. cerevisiae used in this work are listed in Table 4. The BY4741 strain was used as the recipient for transformation with plasmids p1366, p1435 (Jung et al., 2002) and pLGL (Igual et al., 1996), by the LiAC method (Woods and Gietz, 2001). Rich medium (YPD) and synthetic medium (SD) were prepared according to Rose et al. (1990). Sensitivity tests with caffeine (Sigma-C0750), Congo red (Sigma-C6767) and Calcofluor white (ICN Biomedicals-158067) were carried out on YPD agar plates as explained in the legend of Fig. 8. When required, 1 M sorbitol or 20 mM adenine was added to the agar plates. For zymolyase sensitivity tests, early exponential cells (OD600 = 0.2–0.4 which corresponds to 4–8 ¥ 106 cells ml-1) cultivated in YPD medium were incubated for 90 min with the different drugs at concentrations indicated in Fig. 2. Cultures were collected by centrifugation, resuspended to reach OD600 0.9 in 10 mM Tris/HCl buffer pH 7.4 containing 40 mM b-mercaptoethanol. After 30 min of incubation at 25°C, 50 mg ml-1 Zymolyase 20-T (ICN Biomedicals) was added and the lysis of the cells was followed by the decrease of OD600.
Drugs treatment of yeast cultures Experiments to evaluate the minimal inhibitory concentration (IC50) of the tested drugs were carried out as follows. Yeast cells were cultivated in YPD medium at 30°C to logarithmic phase (OD600 1.0). They were diluted 30 times into 0.25 ml of the same medium containing different concentration of the drugs in a microtitre plate and placed at 30°C under low shaking. The plates were read at OD600 every hour. The absorbance of the culture was linear from OD600 0.03–0.8. The maximal specific growth rate (mmax) of each culture was calculated by fitting an exponential regression over the experimental points. These points were selected to yield a correlation coefficient (r 2) higher than 0.998. The m constant from the equation OD600 = b exp(m.t) was the maximal specific growth rate. The minimal inhibitory concentration (IC50) of the drug was defined as the concentration that causes 50% reduction of the mmax. From these experiments ‘non-inhibitory’ and ‘inhibitory’ concentrations of Congo red, Calcofluor white or caffeine were chosen for further treatment of the cells. To this end, an overnight culture of the wild-type yeast (BY4742) in YPD was diluted to OD600 0.03 and grown until OD600 0.2. The culture was then split in three parts. One part was allowed to grow under the same condition, while the two others were treated with the ‘inhibitory and ‘non-inhibitory’ concentrations of the appropriate drug. Samples (10–20 units of OD600) were collected by centrifugation after 5, 15, 90 min and 20 h, quickly flash-frozen in liquid nitrogen and kept at -80°C until use.
RNA isolation, cDNA synthesis and hybridization to microarrays Frozen cells (equivalent of 10 units of OD600) were mechanically disrupted (MicroDismembrator Braun, Melsungen) and
© 2006 The Authors Journal compilation © 2006 Blackwell Publishing Ltd, Molecular Microbiology, 61, 1147–1166
1162 K. Kuranda et al. Table 4. List of S. cerevisiae strains used in this study. Strain
Relevant genotype
Reference or source
BY4741 BY4742 JK9-3da MML378 MML380 JH11-1c CML128 MML447 MML382 MML387 MML393 MML391 MML200 Y00993 Y02739 Y03214 Y01983 Y00173 Y01759 Y03921 Y06109 Y07006 W303 W303msn JF291 JF415 JF1093 SP1 S13-58ArA
MATa a MATa b MATa c MATa tor1::kanMX4 c MATa TOR2-1 tor1::kanMX4 c MATa TOR 1-1 c MATa d MATa tor1::kanMX4 mpk1::URA d MATa wsc1::CaURA3 d MATa mid2::kanMX4 d MATa wsc1::CaURA3 mid2::natMX4 d MATa rom2::kanMX4 d MATa bck1::kanMX4 d MATa mpk1::kanMX4 a MATa rlm1::kanMX4 a MATa ybr077c::kanMX4 a MATa ure2::kanMX4 a MATa gln3::kanMX4 a MATa rtg1::kanMX4 a MATa crf1::kanMX4 a MATa swi4::kanMX4 a MATa yak1::kanMX4 a MATa e MATa msn2-3::HIS3 msn4-1::TRP1 e MATa f MATa leu2 ura3-52 his3 ras2::HIS3 f MATa ira1 ira2 ura3::GSY2–lacZ f MATa g MATa tpk2::HIS3 tpk3::TRP1 bcy1::LEU2 tpk1wg
Brachmann et al. (1998) Brachmann et al. (1998) Helliwell et al. (1998) Torres et al. (2002) Torres et al. (2002) Helliwell et al. (1998) Torres et al. (2002) Torres et al. (2002) Torres et al. (2002) Torres et al. (2002) Torres et al. (2002) Torres et al. (2002) Torres et al. (2002) Brachmann et al. (1998) Brachmann et al. (1998) Brachmann et al. (1998) Brachmann et al. (1998) Brachmann et al. (1998) Brachmann et al. (1998) Brachmann et al. (1998) Brachmann et al. (1998) Brachmann et al. (1998) Martinez-Pastor et al. (1996) Martinez-Pastor et al. (1996) Parrou et al. (1999) Parrou et al. (1999) Enjalbert et al. (2004) Cameron et al. (1988) Cameron et al. (1988)
a. Background: his3D1 leu2D0 met15D0 ura3D0. b. Background: his3D1 leu2D0 lys2D0 ura3D0. c. Background: leu2-3112 ura3-52 trp1 his4 GAL + HMLa. d. background: leu2-3112 ura3-52 trp1 his4 can1r. e. Background: ade2-1 ura3-1 leu2,3-112 trp1-1 his3-11 15 can1-100. f. Background: leu2 ura3-52 his3. g. Background: his3 leu2 ura3 trp1 ade8.
total RNA was isolated using RNeasy Mini kit (Qiagen) following the protocol of the manufacturer. The quantity and the quality of the extracted RNA were determined by microcapillary electrophoresis using a Bioanalyser 2100 (Agilent Technologies, Wilmington, DE, USA). Incorporation of Cyanine 3- and Cyanine 5-dCTP (Amersham Bioscience) was performed during reverse transcription of total RNA using LabelStar Reverse Transcriptase (Qiagen). Labelled cDNA was purified on MinElute spin columns (Qiagen) and was hybridized on dendrimer-activated glass slides, which represented the whole yeast genome by covalently attached DNA probes (70-mer oligonucleotides) (LeBerre et al., 2003). Hybridization was carried out in an automatic hybridization chamber (Discovery from Ventana Medical System) for 10 h at 42°C. After hybridization, slides were washed in 2¥ SSC/0.2% (v/v) SDS, immersed briefly in isopropanol and then dried under a stream of air. To reduce biological and systematic variability, total RNA from two independent cultures were extracted, labelled with dCTP-CY3 (and reciprocally with dCTP-CY5) and hybridized on two independent microarrays. Thus, we had at our disposal 8 signal intensities for every gene with ‘dye switch’ included. The hybridization signals were detected by scanning using GenePix 4000B laser Scanner (Axon Instruments), and transformed
to numerical values using the integrated GenePix software version 3.01.
Transcript data acquisition and treatment Statistically treated data are accessible at http:// biopuce.insa-toulouse.fr/jmflab/cellwallgenomics/, together with full details for normalization and statistical regimes using our home-made Bioplot/Bioclust software (http:// biopuce.insa-toulouse.fr/ExperimentExplorer/doc/BioPLot/). Briefly, raw intensities were corrected from the background, log transformed and normalized by the mean log-intensity of all spots. Log-ratios of normalized intensities from duplicate samples were tested for statistical significance using Student’s test. The differentially expressed genes (1.5-fold change in expression and P-value ⱕ 0.05) were attributed to functional categories according to Saccharomyces Genome Database (http://yeastgenome.org/). When necessary, search for known DNA binding sites on gene promoter was performed using YEASTRACT (Teixeira et al., 2006) software, which interrogates a yeast database containing experimentally validated associations between genes and their transcription factors (see http://www.yeastract.com/).
© 2006 The Authors Journal compilation © 2006 Blackwell Publishing Ltd, Molecular Microbiology, 61, 1147–1166
Inhibition of Tor1p by caffeine 1163 Simultaneously, we analysed transcriptional response to the ‘inhibitory’ concentrations of the drugs, after 90 min of growth, using Correspondence Analysis method (Fellenberg et al., 2001). Signal intensities were uploaded in the M-CHIPS (Multi-Conditional Hybridization Intensity Processing System; http://www.dkfz-heidelberg.de/mchips/). This MATLAB-based tool was used for further analysis, normalization and filtering. For normalization, log-linear regression accounting for affine-linear deviations among the different hybridizations was applied (Beissbarth et al., 2000). Each hybridization experiment was normalized with respect to the gene-wise median of the control condition (culture without drugs after 90 min of growth). Signal intensities of repeated hybridizations were normalized and significance levels assessed by the ‘min–max separation’, a stringency criterion calculated by taking the minimum distance between all data points of the two conditions. To visualize interdependencies among the high-dimensional data received in twoway contingency tables with rows representing genes and columns representing hybridizations, singular value decomposition (Alter et al., 2000) was used for reducing dimensionality, and the so-called chi-squared distance among the data points was approximated. Afterwards, genes and hybridizations were plotted together in a two-dimensional space, where expression specificities are indicated by the distances from the centre.
Mpk1 kinase phosphorylation assay The cells previously collected and frozen in liquid nitrogen were processed as described in de Nobel et al. (2000). Total protein concentration in the supernatants was measured using Bradford reagent (Sigma). Denaturated protein samples (50 mg) were subjected to SDS-PAGE electrophoresis and transferred to Immobilon-P membrane (Millipore). Membranes were probed with anti-phospho-p44/42 MAP kinase antibody (New England Biolabs) to detect phosphorylated form of Mpk1 kinase, or with polyclonal anti-Mpk1p antibodies (Martin et al., 1993) to quantify total Mpk1p abundance. Primary antibodies were detected using alkaline phosphatase-conjugated anti-rabbit antibody (DakoCytomation) and BCIP/NBT solution (Sigma). As a negative control, protein extracts from mpk1D mutant were used. All experiments were repeated twice with consistent results.
Other analytical procedures Yeast cell wall composition (total b-glucan, mannans and chitin) was determined according to procedure described in Dallies et al. (1998). b-Galactosidase activity was measured according to Rose et al. (1981) and activity was expressed as nmol of p-nitrophenylgalactoside per min and per mg of protein (determined by the ‘Bradford’ method). Intracellular levels of cAMP were measured using an enzyme immunoassay system (R&D Systems, DE0450, Amersham) according to the manufacturer’s recommendation. For this experiment, yeast cells (5 mg dry mass) were collected by a rapid filtration on nitrocellulose filter (0.45 mm pore size) and cAMP was extracted in boiling buffered ethanol as described previously (Gonzalez et al., 1997).
Acknowledgements We are very grateful to Mike Hall, Maria Angel de la TorreRuiz, Ted Powers and David Levin for providing us with strains and plasmids. This work was supported in part by grants (QLK3-CT2000-01537 and LSHB-CT-2004-51195) from the European Commission Framework Programs FP5 and FP6. K.K. was a 1-year recipient of the Marie Curie Fellowships (n°HPMT-EC-2000-00135) granted to J.F.
References Aguilar-Uscanga, B., and Francois, J.M. (2003) A study of the yeast cell wall composition and structure in response to growth conditions and mode of cultivation. Lett Appl Microbiol 37: 268–274. Alter, O., Brown, P.O., and Botstein, D. (2000) Singular value decomposition for genome-wide expression data processing and modeling. Proc Natl Acad Sci USA 97: 10101– 10106. Barbet, N.C., Schneider, U., Helliwell, S.B., Stansfield, I., Tuite, M.F., and Hall, M.N. (1996) TOR controls translation initiation and early G1 progression in yeast. Mol Biol Cell 7: 25–42. Bard, M., Neuhauser, J.L., and Lees, N.D. (1980) Caffeine resistance of Saccharomyces cerevisiae. J Bacteriol 141: 999–1002. Bardwell, L., Cook, J.G., Zhu-Shimoni, J.X., Voora, D., and Thorner, J. (1998) Differential regulation of transcription: repression by unactivated mitogen-activated protein kinase Kss1 requires the Dig1 and Dig2 proteins. Proc Natl Acad Sci USA 95: 15400–15405. Bartels, D.J., Mitchell, D.A., Dong, X., and Deschenes, R.J. (1999) Erf2, a novel gene product that affects the localization and palmitoylation of Ras2 in Saccharomyces cerevisiae. Mol Cell Biol 19: 6775–6787. Beissbarth, T., Fellenberg, K., Brors, B., Arribas-Prat, R., Boer, J., Hauser, N.C., et al. (2000) Processing and quality control of DNA array hybridization data. Bioinformatics 16: 1014–1022. Belibi, F.A., Wallace, D.P., Yamaguchi, T., Christensen, M., Reif, G., and Grantham, J.J. (2002) The effect of caffeine on renal epithelial cells from patients with autosomal dominant polycystic kidney disease. J Am Soc Nephrol 13: 2723–2729. Bianchi, M.M., Ngo, S., Vandenbol, M., Sartori, G., Morlupi, A., Ricci, C., et al. (2001) Large-scale phenotypic analysis reveals identical contributions to cell functions of known and unknown yeast genes. Yeast 18: 1397–1412. Blasina, A., Price, B.D., Turenne, G.A., and McGowan, C.H. (1999) Caffeine inhibits the checkpoint kinase ATM. Curr Biol 9: 1135–1138. Boorsma, A., de Nobel, H., ter Riet, B., Bargmann, B., Brul, S., Hellingwerf, K.J., and Klis, F.M. (2004) Characterization of the transcriptional response to cell wall stress in Saccharomyces cerevisiae. Yeast 21: 413–427. Brachmann, C.B., Davies, A., Cost, G.J., Caputo, E., Li, J., Hieter, P., and Boeke, J.D. (1998) Designer deletion strains derived from Saccharomyces cerevisiae S288C: a useful set of strains and plasmids for PCR-mediated gene disruption and other applications. Yeast 14: 115–132.
© 2006 The Authors Journal compilation © 2006 Blackwell Publishing Ltd, Molecular Microbiology, 61, 1147–1166
1164 K. Kuranda et al. Brenner, M., and Thoms, S.D. (1984) Caffeine blocks activation of cyclic AMP synthesis in Dictyostelium discoideum. Dev Biol 101: 136–146. Butcher, F.R., and Potter, V.R. (1972) Control of the adenosine 3′,5′-monophosphate-adenyl cyclase system in the livers of developing rats. Cancer Res 32: 2141–2147. Cameron, S., Levin, L., Zoller, M., and Wigler, M. (1988) cAMP-independent control of sporulation, glycogen metabolism, and heat shock resistance in S. cerevisiae. Cell 53: 555–566. Cardenas, M.E., and Heitman, J. (1995) FKBP12-rapamycin target TOR2 is a vacuolar protein with an associated phosphatidylinositol-4 kinase activity. EMBO J 14: 5892– 5907. Cardenas, M.E., Cutler, N.S., Lorenz, M.C., Di Como, C.J., and Heitman, J. (1999) The TOR signaling cascade regulates gene expression in response to nutrients. Genes Dev 13: 3271–3279. Cooper, T.G. (2002) Transmitting the signal of excess nitrogen in Saccharomyces cerevisiae from the Tor proteins to the GATA factors: connecting the dots. FEMS Microbiol Rev 26: 223–238. Dallies, N., Francois, J., and Paquet, V. (1998) A new method for quantitative determination of polysaccharides in the yeast cell wall. Application to the cell wall defective mutants of Saccharomyces cerevisiae. Yeast 14: 1297–1306. Davenport, K.R., Sohaskey, M., Kamada, Y., Levin, D.E., and Gustin, M.C. (1995) A second osmosensing signal transduction pathway in yeast. Hypotonic shock activates the PKC1 protein kinase-regulated cell integrity pathway. J Biol Chem 270: 30157–30161. Elorza, M.V., Rico, H., and Sentandreu, R. (1983) Calcofluor white alters the assembly of chitin fibrils in Saccharomyces cerevisiae and Candida albicans cells. J Gen Microbiol 129: 1577–1582. Enjalbert, B., Parrou, J.L., Teste, M.A., and Francois, J. (2004) Combinatorial control by the protein kinases PKA, PHO85 and SNF1 of transcriptional induction of the Saccharomyces cerevisiae GSY2 gene at the diauxic shift. Mol Genet Genomics 271: 697–708. Fellenberg, K., Hauser, N.C., Brors, B., Neutzner, A., Hoheisel, J.D., and Vingron, M. (2001) Correspondence analysis applied to microarray data. Proc Natl Acad Sci USA 98: 10781–10786. Flandez, M., Cosano, I.C., Nombela, C., Martin, H., and Molina, M. (2003) Reciprocal regulation between Slt2 MAP kinase and isoforms of Msg5 dual-specificity protein phosphatase modulates the yeast cell integrity pathway. J Biol Chem 279: 11027–11034. Garcia, R., Bermejo, C., Grau, C., Perez, R., Rodriguez-Pena, J.M., Francois, J., et al. (2004) The global transcriptional response to transient cell wall damage in Saccharomyces cerevisiae and its regulation by the cell integrity signaling pathway. J Biol Chem 279: 15183–15195. Gonzalez, B., Francois, J., and Renaud, M. (1997) A rapid and reliable method for metabolite extraction in yeast using boiling buffered ethanol. Yeast 13: 1347–1355. Hall-Jackson, C.A., Cross, D.A., Morrice, N., and Smythe, C. (1999) ATR is a caffeine-sensitive, DNA-activated protein kinase with a substrate specificity distinct from DNA-PK. Oncogene 18: 6707–6713.
Hardwick, J.S., Kuruvilla, F.G., Tong, J.K., Shamji, A.F., and Schreiber, S.L. (1999) Rapamycin-modulated transcription defines the subset of nutrient-sensitive signaling pathways directly controlled by the Tor proteins. Proc Natl Acad Sci USA 96: 14866–14870. Harrison, J.C., Zyla, T.R., Bardes, E.S., and Lew, D.J. (2004) Stress-specific activation mechanisms for the ‘cell integrity’ MAPK pathway. J Biol Chem 279: 2616–2622. Hashimoto, T., Sano, T., Ito, W., Kanazawa, K., Danno, G., and Ashida, H. (2004) 3-Amino-1,4-dimethyl-5H-pyrido [4,3-b]indole induces apoptosis and necrosis with activation of different caspases in rat splenocytes. Biosci Biotechnol Biochem 68: 964–967. Heitman, J., Movva, N.R., and Hall, M.N. (1991) Targets for cell cycle arrest by the immunosuppressant rapamycin in yeast. Science 253: 905–909. Helliwell, S.B., Howald, I., Barbet, N., and Hall, M.N. (1998) TOR2 is part of two related signaling pathways coordinating cell growth in Saccharomyces cerevisiae. Genetics 148: 99–112. Huang, J., Zhu, H., Haggarty, S.J., Spring, D.R., Hwang, H., Jin, F., et al. (2004) Finding new components of the target of rapamycin (TOR) signaling network through chemical genetics and proteome chips. Proc Natl Acad Sci USA 101: 16594–16599. Igual, J.C., Johnson, A.L., and Johnston, L.H. (1996) Coordinated regulation of gene expression by the cell cycle transcription factor Swi4 and the protein kinase C MAP kinase pathway for yeast cell integrity. EMBO J 15: 5001– 5013. Jacinto, E., and Hall, M.N. (2003) Tor signalling in bugs, brain and brawn. Nat Rev Mol Cell Biol 4: 117–126. Jacoby, J.J., Nilius, S.M., and Heinisch, J.J. (1998) A screen for upstream components of the yeast protein kinase C signal transduction pathway identifies the product of the SLG1 gene. Mol Gen genet 258: 148–155. Jafari, M., and Rabbani, A. (2000) Dose and time dependent effects of caffeine on superoxide release, cell survival and DNA fragmentation of alveolar macrophages from rat lung. Toxicology 149: 101–108. Jones, D.L., Petty, J., Hoyle, D.C., Hayes, A., Ragni, E., Popolo, L., et al. (2003) Transcriptome profiling of a Saccharomyces cerevisiae mutant with a constitutively activated Ras/cAMP pathway. Physiol Genomics 16: 107–118. Jung, U.S., Sobering, A.K., Romeo, M.J., and Levin, D.E. (2002) Regulation of the yeast Rlm1 transcription factor by the Mpk1 cell wall integrity MAP kinase. Mol Microbiol 46: 781–789. Kamada, Y., Jung, U.S., Piotrowski, J., and Levin, D.E. (1995) The protein kinase C-activated MAP kinase pathway of Saccharomyces cerevisiae mediates a novel aspect of the heat shock response. Genes Dev 9: 1559– 1571. Ketela, T., Green, R., and Bussey, H. (1999) Saccharomyces cerevisiae Mid2p is a potential cell wall stress sensor and upstream activator of the PKC1-MPK1 cell integrity pathway. J Bacteriol 181: 3330–3340. Kim, J.H., and Powers, S. (1991) Overexpression of RPI1, a novel inhibitor of the yeast Ras-cyclic AMP pathway, downregulates normal but not mutationally activated ras function. Mol Cell Biol 11: 3894–3904.
© 2006 The Authors Journal compilation © 2006 Blackwell Publishing Ltd, Molecular Microbiology, 61, 1147–1166
Inhibition of Tor1p by caffeine 1165 Komeili, A., Wedaman, K.P., O’Shea, E.K., and Powers, T. (2000) Mechanism of metabolic control. Target of rapamycin signaling links nitrogen quality to the activity of the Rtg1 and Rtg3 transcription factors. J Cell Biol 151: 863–878. Kopecka, M., and Gabriel, M. (1992) The influence of Congo red on the cell wall and (1-3)-beta-D-glucan microfibril biogenesis in Saccharomyces cerevisiae. Arch Microbiol 158: 115–126. Kunz, J., Henriquez, R., Schneider, U., Deuter, R.M., Movva, N.R., and Hall, M.N. (1993) Target of rapamycin in yeast, TOR2, is an essential phosphatidylinositol kinase homolog required for G1 progression. Cell 73: 585–596. Lagorce, A., Hauser, N.C., Labourdette, D., Rodriguez, C., Martin-Yken, H., Arroyo, J., et al. (2003) Genome-wide analysis of the response to cell wall mutations in the yeast Saccharomyces cerevisiae. J Biol Chem 278: 20345– 20357. LeBerre, V., Trevisiol, E., Dagkessamanskaia, A., Sokol, S., Caminade, A.M., Majoral, J.P., et al. (2003) Dendrimeric coating of glass slides for sensitive DNA microarrays analysis. Nucleic Acids Res 31: e88.1–e88.8. Levin, D.E. (2005) Cell wall integrity signaling in Saccharomyces cerevisiae. Microbiol Mol Biol Rev 69: 262–291. Liao, H.H., and Thorner, J. (1981) Adenosine 3′,5′-phosphate phosphodiesterase and pheromone response in the yeast Saccharomyces cerevisiae. J Bacteriol 148: 919–925. Loewith, R., Jacinto, E., Wullschleger, S., Lorberg, A., Crespo, J.L., Bonenfant, D., et al. (2002) Two TOR complexes, only one of which is rapamycin sensitive, have distinct roles in cell growth control. Mol Cell 10: 457–468. Lu, Y.P., Lou, Y.R., Li, X.H., Xie, J.G., Lin, Y., Shih, W.J., and Conney, A.H. (2002) Stimulatory effect of topical application of caffeine on UVB-induced apoptosis in mouse skin. Oncol Res 13: 61–70. McMahon, L.P., Yue, W., Santen, R.J., and Lawrence, J.C., Jr (2005) Farnesylthiosalicylic acid inhibits mammalian target of rapamycin (mTOR) activity both in cells and in vitro by promoting dissociation of the mTOR–raptor complex. Mol Endocrinol 19: 175–183. Madden, K., Sheu, Y.J., Baetz, K., Andrews, B., and Snyder, M. (1997) SBF cell cycle regulator as a target of the yeast PKC-MAP kinase pathway. Science 275: 1781–1784. Martin, D.E., and Hall, M.N. (2005) The expanding TOR signaling network. Curr Opin Cell Biol 17: 158–166. Martin, H., Arroyo, J., Sanchez, M., Molina, M., and Nombela, C. (1993) Activity of the yeast MAP kinase homologue Slt2 is critically required for cell integrity at 37 degrees C. Mol Gen genet 241: 177–184. Martin, H., Rodriguez-Pachon, J.M., Ruiz, C., Nombela, C., and Molina, M. (2000) Regulatory mechanisms for modulation of signaling through the cell integrity Slt2-mediated pathway in Saccharomyces cerevisiae. J Biol Chem 275: 1511–1519. Martinez-Pastor, M.T., Marchler, G., Schuller, C., MarchlerBauer, A., Ruis, H., and Estruch, F. (1996) The Saccharomyces cerevisiae zinc finger proteins Msn2p and Msn4p are required for transcriptional induction through the stress response element (STRE). EMBO J 15: 2227–2235. Martin-Yken, H., Dagkessamanskaia, A., Basmaji, F., Lagorce, A., and Francois, J. (2003) The interaction of Slt2 MAP kinase with Knr4 is necessary for signalling through
the cell wall integrity pathway in Saccharomyces cerevisiae. Mol Microbiol 49: 23–35. Moser, B.A., Brondello, J.M., Baber-Furnari, B., and Russell, P. (2000) Mechanism of caffeine-induced checkpoint override in fission yeast. Mol Cell Biol 20: 4288–4294. Naderali, E.K., and Poyser, N.L. (1997) Effects of caffeine and theophylline on prostaglandin production by guineapig endometrium. Prostaglandins Leukot Essent Fatty Acids 56: 63–67. Nelissen, B., De Wachter, R., and Goffeau, A. (1997) Classification of all putative permeases and other membrane plurispanners of the major facilitator superfamily encoded by the complete genome of Saccharomyces cerevisiae. FEMS Microbiol Rev 21: 113–134. Nikawa, J., Cameron, S., Toda, T., Ferguson, K.M., and Wigler, M. (1987) Rigorous feedback control of cAMP levels in Saccharomyces cerevisiae. Genes Dev 1: 931– 937. de Nobel, H., Ruiz, C., Martin, H., Morris, W., Brul, S., Molina, M., and Klis, F.M. (2000) Cell wall perturbation in yeast results in dual phosphorylation of the Slt2/Mpk1 MAP kinase and in an Slt2-mediated increase in FKS2-lacZ expression, glucanase resistance and thermotolerance. Microbiology 146: 2121–2132. Ovalle, R., Lim, S.T., Holder, B., Jue, C.K., Moore, C.W., and Lipke, P.N. (1998) A spheroplast rate assay for determination of cell wall integrity in yeast. Yeast 14: 1159–1166. Park, J.I., Collinson, E.J., Grant, C.M., and Dawes, I.W. (2005) Rom2p, the Rho1 GTP/GDP exchange factor of Saccharomyces cerevisiae, can mediate stress responses via the Ras-cAMP pathway. J Biol Chem 280: 2529–2535. Parrou, J.L., Enjalbert, B., Plourde, L., Bauche, A., Gonzalez, B., and Francois, J. (1999) Dynamic responses of reserve carbohydrate metabolism under carbon and nitrogen limitations in Saccharomyces cerevisiae. Yeast 15: 191–203. Philip, B., and Levin, D.E. (2001) Wsc1 and Mid2 are cell surface sensors for cell wall integrity signaling that act through Rom2, a guanine nucleotide exchange factor for Rho1. Mol Cell Biol 21: 271–280. Pluta, K., Lefebvre, O., Martin, N.C., Smagowicz, W.J., Stanford, D.R., Ellis, S.R., et al. (2001) Maf1p, a negative effector of RNA polymerase III in Saccharomyces cerevisiae. Mol Cell Biol 21: 5031–5040. Powers, T., Dilova, I., Chen, C.Y., and Wedaman, K. (2004) Yeast TOR signaling: a mechanism for metabolic regulation. Curr Top Microbiol Immunol 279: 39–51. Rajavel, M., Philip, B., Buehrer, B.M., Errede, B., and Levin, D.E. (1999) Mid2 is a putative sensor for cell integrity signaling in Saccharomyces cerevisiae. Mol Cell Biol 19: 3969–3976. Reinke, A., Anderson, S., McCaffery, J.M., Yates, J., III, Aronova, S., Chu, S., et al. (2004) TOR complex 1 includes a novel component, Tco89p (YPL180w), and cooperates with Ssd1p to maintain cellular integrity in Saccharomyces cerevisiae. J Biol Chem 279: 14752–14762. Roncero, C., and Duran, A. (1985) Effect of Calcofluor White and Congo Red on fungal cell wall morphogenesis: in vivo activation of chitin polymerization. J Bacteriol 163: 1180– 1185. Rose, M., Casadaban, M.J., and Botstein, D. (1981) Yeast genes fused to beta-galactosidase in Escherichia coli can
© 2006 The Authors Journal compilation © 2006 Blackwell Publishing Ltd, Molecular Microbiology, 61, 1147–1166
1166 K. Kuranda et al. be expressed normally in yeast. Proc Natl Acad Sci USA 78: 2460–2464. Rose, M.D., Winston, F., and Hieter, P. (1990) Methods in Yeast Genetics: A Laboratory Course Manual. New York: Cold Spring Harbor Laboratory Press. Sabbagh, W., Jr, Flatauer, L.J., Bardwell, A.J., and Bardwell, L. (2001) Specificity of MAP kinase signaling in yeast differentiation involves transient versus sustained MAPK activation. Mol Cell 8: 683–691. Saiardi, A., Resnick, A.C., Snowman, A.M., Wendland, B., and Snyder, S.H. (2005) Inositol pyrophosphates regulate cell death and telomere length through phosphoinositide 3-kinase-related protein kinases. Proc Natl Acad Sci USA 102: 1911–1914. Sass, P., Field, J., Nikawa, J., Toda, T., and Wigler, M. (1986) Cloning and characterization of the high-affinity cAMP phosphodiesterase of Saccharomyces cerevisiae. Proc Natl Acad Sci USA 83: 9303–9307. Schmelzle, T., Beck, T., Martin, D.E., and Hall, M.N. (2004) Activation of the RAS/cyclic AMP pathway suppresses a TOR deficiency in yeast. Mol Cell Biol 24: 338–351. Shamji, A.F., Kuruvilla, F.G., and Schreiber, S.L. (2000) Partitioning the transcriptional program induced by rapamycin among the effectors of the Tor proteins. Curr Biol 10: 1574– 1581. Smits, G.J., Van den Emde, H., and Klis, F.M. (2001) Differential regulation of cell wall biogenesis during growth and development in yeast. Microbiology 147: 781–794. Sobering, A.K., Jung, U.S., Lee, K.S., and Levin, D.E. (2002) Yeast Rpi1 is a putative transcriptional regulator that contributes to preparation for stationary phase. Eukaryot Cell 1: 56–65. Teixeira, M.C., Monteiro, P., Jain, P., Tenreiro, S., Fernandes, A.R., Mira, N.P., et al. (2006) The YEASTRACT database: a tool for the analysis of transcription regulatory associations in Saccharomyces cerevisiae. Nucleic Acids Res 34: D446–D451. Torres, J., Di Como, C.J., Herrero, E., and de la Torre-Ruiz, M.A. (2002) Regulation of the cell integrity pathway by rapamycin-sensitive TOR function in budding yeast. J Biol Chem 277: 43495–43504. Tortora, P., Burlini, N., Hanozet, G.M., and Guerritore, A. (1982) Effect of caffeine on glucose-induced inactivation of gluconeogenetic enzymes in Saccharomyces cerevisiae. A possible role of cyclic AMP. Eur J Biochem 126: 617–622. Tsuboi, M., and Yanagishima, N. (1973) Effect of cyclic AMP, theophylline and caffeine on the glucose repression of
sporulation in Saccharomyces cerevisiae. Arch Mikrobiol 93: 1–12. Tsuzuki, J., and Newburgh, R.W. (1975) Inhibition of 5′-nucleotidase in rat brain by methylxanthines. J Neurochem 25: 895–896. Upadhya, R., Lee, J., and Willis, I.M. (2002) Maf1 is an essential mediator of diverse signals that repress RNA polymerase III transcription. Mol Cell 10: 1489–1494. Vuralhan, Z., Morais, M.A., Tai, S.L., Piper, M.D., and Pronk, J.T. (2003) Identification and characterization of phenylpyruvate decarboxylase genes in Saccharomyces cerevisiae. Appl Environ Microbiol 69: 4534–4541. Woods, R.A., and Gietz, R.D. (2001) High-efficiency transformation of plasmid DNA into yeast. Meth Mol Biol 177: 85–97. Xie, M.W., Jin, F., Hwang, H., Hwang, S., Anand, V., Duncan, M.C., and Huang, J. (2005) Insights into TOR function and rapamycin response: chemical genomic profiling by using a high-density cell array method. Proc Natl Acad Sci USA 102: 7215–7220. Zurita-Martinez, S.A., and Cardenas, M.E. (2005) Tor and cyclic AMP-protein kinase A: two parallel pathways regulating expression of genes required for cell growth. Eukaryot Cell 4: 63–71.
Supplementary material The following supplementary material is available for this article online: Fig. S1. Overview of the genes involved in the cellular control of growth and changes in their ratio of expression due to the caffeine treatment. Fig. S2. Caffeine-induced activation of genes encoding key enzymes of the Ehrlich pathway. Fig. S3. Effect of overexpression of ROMZ on caffeine sensitivity in wild type and mutant of the TORI pathway. Fig. S4. Caffeine sensitivity of mutants in the Ras-cAMP pathway. Table S1. The functional categories that were affected in response to Congo red, calcofluor white and caffeine, according to the SGD Term Finder. Table S2. Pathways potentially triggered by CR, CFW, CAF and rapamycin as indicated by the induction of genes regulated by a given transcription factor. This material is available as part of the online article from http://www.blackwell-synergy.com
© 2006 The Authors Journal compilation © 2006 Blackwell Publishing Ltd, Molecular Microbiology, 61, 1147–1166