2015 American Control Conference Palmer House Hilton July 1-3, 2015. Chicago, IL, USA
Investigating the impact of Cryogenic Carbon Capture on power plant performance * Seyed M. Safdarnejad, Lindsey Kennington, Larry L. Baxter, and John D. Hedengren
Abstract— Cryogenic Carbon Capture (CCC) is a CO2 mitigation process that can be integrated into existing baseline and load following fossil-fueled power plants. This process consumes less energy than conventional chemical absorption and includes energy storage capability. The CCC process has a fast response time to load changes to allow higher utilization of intermittent renewable power sources to be used at a grid-scale level in the power sector. The impact of the CCC process on the performance and operating profit of a single fossil-fueled power generation unit is studied in this paper. The proposed system (power production from wind, coal, and natural gas) meets the total electricity demand with 100% utilization of the available wind energy. The operational strategy for the hybrid energy-carbon capture system and the change in the performance of the hybrid system due to the seasonal changes are also examined in this paper. A sensitivity analysis is implemented to investigate the change in operating strategy of the hybrid system based on the relative fraction of wind energy adoption. The optimal wind energy adoption factor in the proposed system is obtained.
I. INTRODUCTION The United States Environmental Protection Agency (EPA) unveiled new rules in June, 2014 to reduce carbon dioxide emissions from existing fossil – fueled power plants. According to the EPA’s Clean Power Plan, power sectors must reduce CO2 emissions by 30 percent by 2030, compared to 2005 emission levels. The restrictions on CO2 emissions and increasing interest in renewable power sources, such as wind and solar power have led to a wide body of research in developing hybrid systems of power generation and carbon capture. Some researchers have focused on developing different aspects of the integrated power generation units. They have considered power generation units with fossil fuel fired units, energy storage, and renewable sources like wind [1]–[3] and solar [4], [5]. Other researchers have considered the impact of CO2 removal systems on different power generation units [6]–[10]. The major drawback of most of the considered CO2 mitigation processes in the aforementioned references is the parasitic energy loss during CO2 removal. According to [11], the average energy consumption of using oxy-combustion, absorbents, or membranes for CO2 capture is 1.69, 1.72, and 1.3 MJe/kg CO2. Cryogenic Carbon Capture (CCC), that is currently under development [12], is a new technology for CO2 capture that has a lower parasitic loss than conventional systems (an average of 0.98 MJe/kg CO2). The CCC process is a post-combustion process in which the CO2 from the * Research supported by Sustainable Energy Solutions (SES). S. M. Safdarnejad, L. Kennington, L. L. Baxter, and J. D. Hedengren are with the Chemical Engineering Department, Brigham Young University, Provo, UT, 84602, USA (corresponding author, phone: 8014777341; fax: 8014220151;E-mail:
[email protected],
[email protected],
[email protected],
[email protected], respectively).
978-1-4799-8686-6/$31.00 ©2015 AACC
5016
power plant flue gas exhaust is separated by cooling the flue gas to a temperature below the freezing-point of CO2. Other pollutants in the flue gas, such as mercury and hydrogen sulfide, are also separated in the cooling process. Solid CO2 is then separated from the slurry in a solid-liquid separation unit. Pure CO2 is finally melted and pressurized to 13 MPa for export to underground containment wells. Other advantages of using the CCC process include a fast response to electricity demand change and excess energy storage. The fast response and storage capability of the CCC process are extremely important as they match well with the intermittent nature of the renewable energy systems. In this paper, the CCC process is considered as the CO2 removal system and its impact on power generation units is investigated. The power production units considered in this study are coal, gas, and wind generation. The impact of seasonal change on the performance of the integrated system is studied. Likewise, the influence of adopting varying amounts of wind power on the overall performance of the power generation unit is studied. This study illustrates how a basic dynamic optimization framework for nonlinear problems can be used to design an operational strategy for a hybrid energy-carbon capture system. II. MODELING AND OPTIMIZATION FRAMEWORK The general framework applied to model the hybrid system is shown in (1) - (3) [13]:
0 = f(
dx , x, y, p,d,u), dt
0 = g(x, y, p,d,u),
0 h(x, y, p,d,u),
where x, y, p, d, u represent state variables, dependent variables, parameters, disturbance values, and control moves, respectively. Continuous, binary, and integer variables can be used in this general framework. The equations defined in the general form of (1) – (3) can be differential or algebraic, equality, or inequality constraints. The dynamic optimization framework used in this paper is related to a nonlinear dynamic optimization with an ℓ1 – norm formulation, presented in (4) – (10) [13], [14]:
s.t.
T min J = wThi .ehi + wlo .elo + yTm .cy + uT .cu + uT .cu ,
0 = g(x, ym , p,d, u),
0 h(x,y, p,d,u),
c
c
dy t,hi dt dy t,lo dt
+ y t,hi = SPhi , + y t,lo = SPlo ,
e hi ( y m — y t ,hi ),
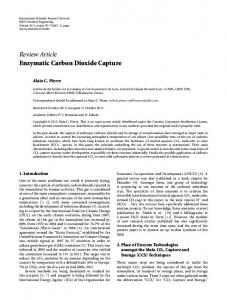
The ℓ1 – norm formulation has several advantages over the least squares method. This problem has a multi-objective form and ℓ1 – norm permits prioritization of the objective functions. The linear terms which are added as a result of using ℓ1 – norm do not add additional nonlinear terms [15]. Equations (1) – (10) and the equations which represent the physics of the hybrid system are solved in the APMonitor Modeling Language [16]. In APMonitor, Differential and Algebraic Equations (DAEs) are converted to a Nonlinear Programming (NLP) form using the method of orthogonal collocation on finite elements. In this method, derivative values are related to the non-derivative values over a time horizon by finding a matrix of coefficients and using that matrix to produce the algebraic expressions. The algebraic expressions and equations represented in (1) - (10) and the equations which represent the physics of the hybrid system are solved using either an active set solver (APOPT) or an interior point solver (IPOPT). Similar approaches are used in the previous studies [17]–[21] III. PROCESS CONCEPT As previously stated, CO2 is separated from the power plant flue gas by cooling it below the freezing point of CO2 [22]. Two refrigeration cycles are used to accomplish the cooling in the CCC process (Fig. 1). The first refrigeration cycle (internal refrigeration loop in Fig. 1) uses CF4. The electricity demand associated with running this refrigeration cycle and other auxiliary equipment in the CCC process is referred to as CCC plant electricity demand. The second refrigeration cycle (external refrigeration loop in Fig. 1) uses Liquefied Natural Gas (LNG), although others could be selected. The electricity demand associated to run the external refrigeration cycle in the LNG production process is VARIABLE DESCRIPTION USED IN (4) TO (10)
Variable
Description
J
objective function
ym
T model values ( ym,0,..., ym,n )
yt , yt ,hi , yt ,lo
w hi , wlo c y , cu , cu
u, x, p, d f , g, h c elo , ehi SPlo, SPhi
(9)
desired trajectory target or dead-band penalty factors outside trajectory dead-band cost of variables y, u, and u respectively Inputs (u), states (x), parameters (p), and disturbances (d) equation residuals (f), output function (g), and inequality constraints (h) time constant of desired controlled variable response slack variable below or above the trajectory deadband lower and upper bounds for set point dead-band
5017
Coal Power NG compressor
elo ( yt ,lo — ym ), where the variables used in (1) to (10) are described in Table I.
TABLE I.
Wind Power
Natural gas from pipeline (1)
Total Power Generation
(8) (2)
(3)
Gas Power LNG/MR recuperator
(10)
Natural Gas flue gas
(6) (7)
(11)
Gas Turbine
MR compressor (12)
(5)
External Refrigeration Loop
(4)
CCC Process Internal Refrigeration Loop
(9)
Figure 1. Schematic representation of the hybrid system
referred to as the LNG plant electricity demand. The advantage of using LNG in the CCC process is that when it passes through the CCC process (stream 3 in Fig. 1), it is vaporized so that heat is removed from the process. The vaporized LNG (stream 4 in Fig. 1) is then warmed up to the ambient temperature in the LNG/mixed refrigerant recuperator. The warm natural gas (stream 5 in Fig. 1) can then be combusted to produce power. Thus, the refrigerant is also the fuel, which significantly reduces the operational costs of the plant. However, only a fraction of the vaporized LNG is allowed for combustion so that oversizing of the gas turbine is avoided. The produced gas power is utilized to compensate for the slow response of the steam boilers to the variations in electricity demand. The decision about power production from natural gas and the time that gas power should be produced is completely made by the optimizer. Because a fraction of the natural gas is burned, natural gas is imported to the plant (stream 1 in Fig. 1) so that enough LNG is available for treating the flue gas in the CCC process. The amount of the imported natural gas increases during peak hours because more flue gas is produced during that time. Two cold streams (streams 4 and 10 in Fig. 1) are used in the LNG/mixed refrigerant recuperator to liquefy the pipeline natural gas and the fraction of the natural gas not burned for power production (stream 2 in Fig. 1). The first cold stream (stream 10 in Fig. 1) uses a mixed refrigerant as the cooling media. The second cold stream is the vaporized LNG (stream 4 in Fig. 1) that comes from the CCC process, as stated before. This stream is a two-phase cold stream and is exposed to the warmer natural gas (stream 2 in Fig. 1). As a result, pipeline natural gas and the fraction of the natural gas not burned for power production are liquefied. A more detailed study of the CCC process and the economical evaluation of the process is considered in [22]. IV. MODEL ASSUMPTIONS AND INPUT DATA A. Model Assumptions In this study, the power output of ten wind power stations in southern California, USA is considered along with coal and gas power generation units. The maximum actual power output from wind stations is 300 MW while steam boiler has a capacity of 1200 MW. Although the steam boiler
considered in this study is able to follow the electricity load at a change rate of 7% per minute [23], the response to electricity load changes is still slow compared to the high variations in peak electricity load. Use of a gas turbine is necessary; otherwise, the thermal cycling of the steam boiler as a result of rapid load changes are severe and decrease the life time of the boiler. A simple cycle with a capacity of 240 MW (20% of the capacity of the steam boiler) is assumed for power production from natural gas in the turbine. Although the CCC process is able to integrate with both the gas- and coal-fired power plants independently, in this study it is assumed that the combination of them establishes a single power generation unit and the lumped unit is equipped with the CCC process. Thus, the feed to the CCC process has two sources: (1) flue gas from burning the coal for steam production (2) flue gas from burning the natural gas in the gas turbine. B. Dynamic response of the base control components As stated before, power production from steam boilers has a slow response to demand load variations. To consider the slow dynamic response of base control components of the hybrid system, a first order differential equation is applied to limit equipment response time. Equation (11) is adopted to approximate the base control components of the hybrid system:
dL — L K L SP , dt
where represents the response time constant (the amount of time required to get 63% of the way to a final target value when there is a step change from a steady state starting condition.) The output from the system is represented by L . Variables t, K, LSP represent time, process gain, and set point of the output variable, respectively. Process gain is the total change in the output variable due to a unit change in the manipulated variable. Equation (11) is applied for steam boiler equivalent power output (considering the inefficiency in steam turbines) and a natural gas intake system, which have 2 hour and 5 minute time constants [22]. The power production from natural gas is considered essentially instantaneous. C. Input Data The electricity demand profile adopted for this study is related to the forecasted data for a zone in southern California, USA. Electricity demand data is taken from [24]; this is the predicted data for 2022 with a maximum of 1200 MW. The assumed data for these variables are typical for most residential areas. The wind power [25] and electricity power prices [26] are represented by 2006 and 2009 data, respectively. Two time periods are selected to compare the effect of seasonal changes on electricity demand and weather condition. The first time period is between July 18th and July 20th (summer case), when the peak electricity demand of the year is predicted to occur. The second time period is between January 25th and January 27th (winter case), when wind power had the highest standard deviation among all possible three consecutive day time horizons in 2006. According to prior simulation results [22], the electricity demands of the compression in the refrigeration cycles (LNG and CCC plant demands) are considered to be constant per 5018
unit of mass of the captured CO2. It is assumed that the total energy penalties for treating the flue gases from coal and gas combustion are 0.2046 and 0.2155 kWh/kg CO2, respectively [13]. These numbers are obtained under the assumption that the CCC process captures 90% of the CO2 in the flue gas exhausts from both coal and gas combustion [22]. D. Objective Functions and Controlled Variable Two objective functions are considered in this study: (1) maximization of the operating profit of the integrated system (2) minimization of the excess power production. The profit function ( P ) considered in this study is shown in (12):
P = (DR — DLNG — DCCC ) P E — (N I ) P N — C P C ,
where DR , DLNG , DCCC , and P E represent residential demand, LNG plant demand, CCC plant demand, and power price, respectively. N I , P N , C, and PC represent the flow rate of natural gas imported to the plant, natural gas price, coal feed rate, and coal price, respectively. Optimal sizing of the equipment used in the CCC and LNG plants is out of the scope of this study and is discussed elsewhere [12], [22]. Excess power production is the second objective function used in this study and is represented in (13):
P Ex = (P CP + P GT + PW — D R — D LNG — DCCC ),
where P Ex , PCP , PGT , PW represent excess power, coal power, gas power, and wind power, respectively. This multiobjective optimization problem is solved simultaneously and independently. Prioritization for the objective functions is achieved by using weighting factors in an ℓ1 – norm formulation. In this study, having zero excess power is given a higher priority than maximizing the operational profit. To achieve this goal, excess power is also considered as a controlled variable with high and low set points of zero. When the excess power variable is not zero, it is assigned T and wThi in (4)). This procedure high penalization factors ( wlo ensures that power production always equals the total electricity demand. Coal and gas combustion rates and the imported natural gas flow rate to the plant are the decision variables used to implement this multi-objective optimization problem. The simulation time horizon considered in this study is 72 hours with one hour time discretization. E. Constraints Two main constraints are applied to this problem. The first is the amount of power produced from the gas turbine; the maximum gas turbine power output is constrained to 20% of the maximum capacity of the steam boiler (1200 MW in this case). If this constraint is not applied, the power output from the gas turbine is significant, which results in an oversized turbine. A more accurate analysis of the size of the gas turbine is made by considering capital costs of the equipment. The second constraint is limiting the combined electricity demand of the LNG and CCC plants to less than 20% of the steam boiler’s maximum capacity. Steady state simulations have shown that combined electricity demand of the LNG and CCC plants is 15-20% of the power generated in the power plant [22]. In this investigation, a value of 20%
The range of operation of the steam boiler used in this study is considered to vary from zero to full capacity. While it is important to show the concept of more wind utilization by assuming a lower limit of zero for the steam boiler, the zero limit is not practical. The lower limit of the steam boiler is selected to be zero to add enough flexibility to the hybrid system so as to not produce excess power. A longer time frame is needed to find an appropriate boiler capacity. In that case, the simplifying assumption for the lower limit of power output from the steam boiler can be easily modified. Adding the energy storage capability of the CCC process is another 5019
1400 1200 1000 800 600 400 200 0 0
12
24
36
48
60
72
Time(hr)
Figure 2. Power vs. electricity demand profile (summer case) Coal power (MW) Total power (MW) Total electricity demand (MW) Wind power (MW) Gas power (MW) Residential demand (MW) CCC and LNG combined demand (MW) Maximum CCC and LNG combined demand (MW)
500 400 300 200 100 0 0
12
24
36
48
60
72
Time(hr)
Figure 3. Power vs. electricity demand profile (winter case) Summer Case Winter Case Residential Electricity Demand
4
x 10 5
1500
4 1000 3
2 500 1
0
0
12
24
36 Time (hr)
48
60
Residential Electricity Demand (MW)
For the winter case (shown in Fig 3.), it is observed that the electricity demand decreases significantly and wind power is more readily available than in the summer case. In fact, there are times (such as the period between hours 26 and 29) when wind power can fully meet the total electricity requirement of the residential area and the CCC and LNG plants. Therefore, power production from coal and gas are not needed and are reduced to zero. Wind power also has a high rate of fluctuation in the winter. Thus, when wind power is not sufficient to meet the total electricity demand or when it is fluctuating frequently, both gas and coal power are used to compensate for the lack of wind power. Gas power is used as much as possible during peak hours and when wind power is not sufficient. After reaching the maximum allowable limit for gas power, coal power is used to meet the electricity demand. The total excess power over the time horizon is less than 0.6% in this scenario. The maximum rate of load change in the steam boiler (0.2% per min) is also less than the maximum anticipated change rate of 7% per minute. Similar to the summer case, the combined electricity demand for the LNG and CCC plants is less than the assumed upper bound (240 MW).
Coal power (MW) Total power (MW) Total electricity demand (MW) Wind power (MW) Gas power (MW) Residential demand (MW) CCC and LNG combined demand (MW) Maximum CCC and LNG combined demand (MW)
Power vs Electricity Demand (MW)
A. Comparison between summer and winter results The main results of the integrated system optimization for summer and winter cases are presented in this section. The summer case result, displayed in Fig. 2, shows that the total power produced in the system is always greater than or equal to the total electricity demand. The total excess power over the time horizon is approximately zero in this scenario. Coal power is the main source of electricity generation, while gas power is produced during peak hours to meet the total electricity demand. Whenever wind is available, it is used first to meet the demand. Coal power is mainly dispatched after the wind while gas power is mostly produced in periods with high electricity demand. Optimization shows a maximum change rate of 0.3% per min for the load in the steam boiler that is less than the maximum anticipated change rate of 7% per minute. Fig. 2 shows that the combined LNG and CCC electricity demands satisfy the constraint described in the previous section.
Fig. 4 shows trends of the natural gas from the pipeline for both summer and winter cases. This figure illustrates how more natural gas is taken from the pipeline during peak hours and when wind power is insufficient. Two reasons are attributed for taking natural gas from pipeline in peak hours: (1) more LNG is required to treat the flue gas of the power plants (2) a fraction of natural gas is combusted in the gas turbine and the amount of natural gas lost due to combustion should be compensated. As mentioned before, when wind power is not sufficient to meet the electricity demand, a combination of gas and coal power is used to achieve this goal. However, the steam boiler’s response to the intermittent behavior of the wind power is slow and gas power is used more frequently in the winter as the rate of variation of wind power is greater in the winter than the summer. The overall
Power vs Electricity Demand (MW)
V. OPTIMIZATION RESULTS
viable option to make the rate of change of the boiler smoother [13].
Natural Gas from Pipeline (kg/hr)
is adopted. Penalization factors are also applied, where required, to obtain simulation results that are satisfactory based on operator feedback. These factors serve as tuning parameters to obtain smooth trends in the variations of variables. Without applying the penalization factors, large and sharp variations are observed in the trend of variables with little improvement in the overall objective.
0 72
Figure 4. Natural gas imported to the plant
amount of the natural gas taken from the pipeline over the optimization time horizon is approximately 100% more in the winter case than the summer case.
B. Sensitivity analysis for wind power adoption Finally, a sensitivity analysis is implemented to compare the effect of different rates of wind power adoption on the utilization of coal and gas power. For the cases outlined in this section, the winter data and a wind adoption factor ( ) are used to define the fraction of the available wind power adopted in power generation. When 1 , all of the available wind power is adopted to meet the electricity demand, while 0 .5 means that only half of the available wind power is used. As shown in Fig. 6, adopting more wind power causes less coal power production. However, gas power has higher influence at higher wind power adoption rates; this is due to its fast response to the intermittent behavior of the wind power. Using more gas power is advantageous as coal power produces more CO2 and using more wind and gas power results in lower electricity demands for the LNG and CCC plants. Conversely, lower adoption of the wind power requires more power to be produced from coal to meet the total electricity demand. The impact of the adoption factor on the revenue of the hybrid system is shown in Fig. 7. The revenue of sale of electricity to residential consumer is constant at all values of . Coal cost and the electricity cost to run the LNG and CCC plants decrease by adopting more wind power into the power generation units. However, gas cost increases by increasing the wind power adoption factor. This conclusion is expected because gas power, as opposed to coal power, is
Summer Case Winter Case Residential Electricity Demand
5
9
1500
LNG Production (kg/hr)
7 6
1000
5 4 3
500
2 1 0
0
12
24
36 Time (hr)
48
60
0 72
Figure 5. Figure 1 LNG production in the system
used more to meet the total electricity demand when more wind power is adopted. It is observed from Fig. 7 that at 0 .66 the profit is at a maximum. This means that at this value, a combination of the three power sources lead to the maximum profit obtainable from this system for the winter case. Thus, further adoption of the wind power does not increase profitability in the assumed hybrid system. The natural gas price used to obtain results in Fig. 7 is an average value of 5.74 $/Mcf. However, the same trend in the profitability is obtained with a natural gas price ranging from 3.54 to18.25 $/Mcf. This price range is sufficiently wide to capture the possible growth in the natural gas price in 2022 [27], [28] and is sufficient for the purpose of this study. Change in the coal price from 12.65 $/ton to 17 $/ton (the projected price for the Powder River Basin coal in 2022) also leads to the same conclusion. When the energy storage capability of the CCC process is employed, initial results show that further adoption of wind power lead to higher profit. This issue is addressed in future work. 100 90 Natural Gas Power
80 70 60 50
Coal Power
40 30 20 10 0
Wind Power
0
0.2
0.4 0.6 Wind Adoption Factor (α)
0.8
1
Figure 6. Impact of wind power adoption factor on power production from gas and coal (winter data) 1350 1300
Total Electricity Revenue Revenue − (LNG & CCC Electricity Costs) Revenue − (Coal, LNG & CCC Electricity Costs)
1250
Profit = Revenue − (Natural Gas, Coal, LNG & CCC Electricity Costs)
1200 1150 1100 1050 1000 Maximum Profit (α=0.66)
950
0
0.2
0.4 0.6 Wind Adoption Factor (α)
0.8
1
Figure 7. Operating costs and electricity demand revenue vs wind power adoption factor ( ) (winter data)
5020
Residential Electricity Demand (MW)
8
Energy Utilization (%)
The average operational profit obtained from the integrated system, assuming a constant natural gas price, is approximately $21k/hr for the summer case. The average operational profit for the winter case is approximately $13k/hr. The higher profit obtained for the summer case is expected as larger variation in the electricity price helps achieve more benefit from the hybrid system. The profit obtained from this system can be increased significantly by using the storage capability in the CCC process; this is the focus of future work.
x 10
Revenue (k$)
The same trend is observed for the LNG production rate (Fig. 5). During off peak hours, less LNG is required and it is produced from the recirculating natural gas inside the plant (stream 8 in Fig. 1). Since more LNG is required during peak hours, the necessary LNG is supplied from both pipeline and recirculating natural gas. The overall amount of LNG produced inside the plant for the winter case is 80% less than the summer case. This difference is attributed to the higher penetration of wind power into the power production unit in the winter. In addition, it is observed in Fig. 3 that gas power is produced more than the coal power in the winter case. As CO2 emissions from the gas combustion are less than the coal combustion, lower amounts of LNG are required to run the CCC process during the winter. Thus, when more wind power is adopted into the power generation units, the LNG production rate decreases. The same behavior is observed for the sum of the electricity demands for the LNG and CCC plants.
[7]
VI. CONCLUSION The impact of the CCC process (a post-combustion CO2 removal process) on fossil-fueled power plants is considered in this paper. The CCC process is considered as a response to the tightening restrictions on CO2 emission from fossilfueled power plants. The fast response of the CCC process to electricity demand changes and the energy storage capability help utilize more renewable energy sources into the grid, which allow for less CO2 emissions to the environment. The impact of the CCC process on the operating strategy and profitability of a power generation system is studied in this paper. The effects of seasonal variations in electricity demand and wind availability are investigated by considering the summer and winter cases. It is observed that the proposed hybrid system is able to meet the total electricity demand. All of the available wind power is utilized in this study to meet the electricity demand. The operating profit obtained from the proposed system for the summer case is $21k/hr, while the winter case profit is $13k/hr. It is observed that the larger availability of wind power in the winter leads to 100% more intake of natural gas to the plant than in the summer case. LNG production over the optimization time horizon decreases by 80% for the winter case. A sensitivity analysis is implemented to examine the change in operating strategy of the proposed system with respect to the wind power adoption factor ( ). It is observed that at higher values of , the rate of utilization of coal power decreases while gas power utilization increases. At 0.66 , it is observed that the profit obtained to run the integrated system in the winter is at a maximum. However, when the energy storage of the CCC process is considered, initial results show a profit increase by adopting more wind power. The hybrid system of power generation and the CCC process with the associated energy storage facilities are addressed in future work. Furthermore, the impact of the CCC process on a base load power plant will also be considered in future work.
[8]
[9] [10] [11]
[12] [13]
[14]
[15]
[16] [17]
[18]
[19]
[20]
REFERENCES [1] [2]
[3]
[4] [5] [6]
L. Goransson and F. Johnsson, “Dispatch modeling of a regional power generation system - Integrating wind power,” Renew. Energy, vol. 34, no. 4, pp. 1040–1049, 2009. E. D. Delarue, P. J. Luickx, and W. D. D’haeseleer, “The actual effect of wind power on overall electricity generation costs and CO2 emissions,” Energy Convers. Manag., vol. 50, no. 6, pp. 1450–1456, Jun. 2009. O. C. Onar, M. Uzunoglu, and M. S. Alam, “Dynamic modeling, design and simulation of a wind/fuel cell/ultra-capacitor-based hybrid power generation system,” J. Power Sources, vol. 161, no. 1, pp. 707–722, Oct. 2006. E. Hu, Y. Yang, A. Nishimura, F. Yilmaz, and A. Kouzani, “Solar thermal aided power generation,” Appl. Energy, vol. 87, no. 9, pp. 2881–2885, Sep. 2010. F. Manenti and Z. Ravaghi-Ardebili, “Dynamic simulation of concentrating solar power plant and two-tanks direct thermal energy storage,” Energy, vol. 55, no. 0, pp. 89–97, Jun. 2013. C. A. Kang, A. R. Brandt, and L. J. Durlofsky, “Optimal operation of an integrated energy system including fossil fuel power generation, CO2 capture and wind,” Energy, vol. 36, no. 12, pp. 6806–6820, Dec. 2011.
5021
[21] [22] [23]
[24] [25] [26] [27] [28]
H. Chalmers, M. Leach, and J. Gibbins, “Built-in flexibility at retrofitted power plants: What is it worth and can we afford to ignore it?,” Energy Procedia, vol. 4, no. 0, pp. 2596–2603, 2011. H. Chalmers and J. Gibbins, “Initial evaluation of the impact of post-combustion capture of carbon dioxide on supercritical pulverised coal power plant part load performance,” Fuel, vol. 86, no. 14, pp. 2109–2123, Sep. 2007. H. Gerbelová, P. Versteeg, C. S. Ioakimidis, and P. Ferrão, “The effect of retrofitting Portuguese fossil fuel power plants with CCS,” Appl. Energy, vol. 101, no. 0, pp. 280–287, Jan. 2013. C. Cormos, “Integrated assessment of IGCC power generation technology with carbon capture and storage ( CCS ),” Energy, vol. 42, no. 1, pp. 434–445, 2012. M. J. Jensen, C. S. Russell, D. Bergeson, C. D. Hoeger, D. J. Frankman, C. S. Bence, and L. L. Baxter, “Prediction and Validation of External Cooling Loop Cryogenic Carbon Capture (CCC ECL) for Full-Scale Coal-Fired Power Plant Retrofit,” Int. J. Greenh. Gas Control, p. accepted, in progress, 2015. “Sustainable Energy Solutions Company.” [Online]. Available: http://sesinnovation.com/. S. M. Safdarnejad, J. D. Hedengrena, and L. L. Baxter, “Plantlevel Dynamic Optimization of Cryogenic Carbon Capture with Conventional and Renewable Power Sources,” Appl. Energy,submitted, 2015. J. D. Hedengren, R. Asgharzadeh Shishavan, K. M. Powell, and T. F. Edgar, “Nonlinear modeling, estimation and predictive control in APMonitor,” Computers and Chemical Engineering, 2014. [Online]. Available: http://dx.doi.org/10.1016/j.compchemeng.2014.04.013. J. D. Hedengren, R. Asgharzadeh Shishavan, K. M. Powell, and T. F. Edgar, “Nonlinear modeling, estimation and predictive control in APMonitor,” Comput. Chem. Eng., vol. 70, no. 0, pp. 133–148, Nov. 2014. J. D. Hedengren, “APMonitor Modeling Language,” 2013. [Online]. Available: http://www.apmonitor.com/. S. M. Safdarnejad, J. R. Gallacher, and J. D. Hedengren, “Framework for Dynamic Parameter Estimation and Optimization of Batch Distillation Processes,” Comput. Chem. Eng. submit, 2015. L. Sun, J. D. Hedengren, and R. W. Beard, “Optimal Trajectory Generation Using Model Predictive Control for Aerially Towed Cable Systems,” J. Guid. Control. Dyn., vol. 37, no. 2, pp. 525– 539, 2014. R. Asgharzadeh Shishavan, C. Hubbell, H. D. Perez, J. D. Hedengren, and D. S. Pixton, “Combined Rate of Penetration and Pressure Regulation for Drilling Optimization by Use of HighSpeed Telemetry,” SPE Drilling and Completion, no. SPE170275-PA. . A. Wächter and L. T. Biegler, “On the Implementation of a Primal-Dual Interior Point Filter Line Search Algorithm for Large-Scale Nonlinear Programming,” Math. Program., vol. 106, pp. 25–57, 2006. S. M. Safdarnejad, J. D. Hedengren, N. R. Lewis, and E. Haseltine, “Initialization strategies for optimization of dynamic systems,” Comput. Chem. Eng. submit, 2015. M. Jensen, “Energy Processes Enabled by Cryogenic Carbon Capture,” Brigham Young University, 2015. J. Lindsay and K. Dragoon, “Summary Report on Coal Plant Dynamic Performance Capability,” 2010. [Online]. Available: http://www.rnp.org/node/rnp-report-coal-plant-performancecapability. “Western Electricity Coordination Council Company.” [Online]. Available: http://www.wecc.biz/. “National Renewable Energy Laboratory (NREL).” [Online]. Available: http://wind.nrel.gov/Web_nrel/. “Federal Energy Regulatory Commission.” [Online]. Available: http://www.ferc.gov/. “Natural Gas Forecasted Prices.” [Online]. Available: http://knoema.com/ncszerf/natural-gas-prices-long-term-forecastto-2020-data-and-charts. “EIA annual reports for natural gas.” [Online]. Available: http://www.eia.gov/naturalgas/annual/.