Proceedings of the Eastern Asia Society for Transportation Studies, Vol.6, 2007
INVESTIGATING THE TEMPORAL TRANSFERABILITY OF TRANSPORT MODAL CHOICE MODELS: AN APPROACH BASED ON GIS DATA BASE Katia ANDRADE Graduate Student Graduate School of Engineering Hokkaido University North 13, West 8, Kita-ku, 060-8628, Sapporo, Japan Fax: +81-11-706-6214 E-mail:
[email protected]
Seiichi KAGAYA Professor Graduate School of Engineering Hokkaido University North 13 West 8, Kita-ku, 060-8628, Sapporo, Japan Fax: +81-11-706-6214 E-mail:
[email protected]
Kenetsu UCHIDA Associate Professor Graduate School of Engineering Hokkaido University North 13 West 8, Kita-ku, 060-8628, Sapporo, Japan Fax: +81-11-706-6214 E-mail:
[email protected]
Andre DANTAS Senior Lecturer Department of Civil Engineering University of Canterbury Private Bag 4800, Christchurch, New Zealand Fax: +64-3-364-2758 E-mail:
[email protected]
Alan NICHOLSON Associate Professor Department of Civil Engineering University of Canterbury Private Bag 4800, Christchurch, New Zealand Fax: +64-3-364-2758 E-mail:
[email protected] Abstract: Developing precise travel behavior models and testing its forecasting capability are essential when planning transportation systems. However, emphasis is observed in estimating while forecasting still needs to be better understood. This study examines the temporal transferability of a Multinomial Logit Model and a hybrid Neuro-Fuzzy Multinomial Logit model, which differ primarily by including linear and non-linear utilities. Geographic Information System is successfully used during the forecasting process. Overall, the hybrid model presents better performance, even though both models do not show satisfactory behavior when directly transferred to the application context. Small sample model results show good behavior of the hybrid model. Accordingly, a sensitivity analysis suggests this model is able to capture travelers’ sensitivity to parking cost variations, which is not well described by the classical model. Travelers’ behavior could be better explained by the hybrid model rather than by the classical Multinomial Logit structure. Key Words: Geographic Information System, Neuro-Fuzzy Systems, Temporal Transferability.
1. INTRODUCTION Model transferability is a fundamental aspect in forecasting travel behavior. This means the model’s ability to be applied in a context different to the one it was originally estimated, which is either a different spatial area or a different point in time. Badoe and Miller (1995) argue that a well context-specified model should be able to represent the decision-making process in other contexts, as long as the basic nature of the decision-making process remains the same. Accordingly, Karasmaa and Pursula (1995) emphasize that important practical benefits can be obtained from model transferability, such as the possibility of reducing data
Proceedings of the Eastern Asia Society for Transportation Studies, Vol.6, 2007
collection and model estimation requirements in the application context. Consequently, model transferability has been subject of research interest. Several empirical studies have been conducted in order to evaluate the effectiveness of transferred models, in which both the spatial and the temporal dimensions of transferability are assessed, such as the works developed by Koppelman and Wilmot (1982), Smith and Demetsky (1994), and Santoso and Tsunokawa (2006). Moreover, regarding the temporal dimension of transferability, studies have addressed short and long-range transferability. On one hand, Badoe and Miller (1995) and Nicholson (2003) claim that significant urban changes are liked to occur during long-range intervals. On the other hand, Tsai et al. (2005) argue that shortrange forecasting results are essential to resource allocation and other areas in transportation planning. Despite extensive discussion on models transferability is found in the literature, the effectiveness of the temporal transferability seems to be still unclear. On one hand, it has been found that the developed models were temporally transferable, since their attribute variable coefficient estimates were stable over the time (Yunker, 1976; Parody, 1977). On the other hand, a few researchers have found large errors in the forecasting results from transferred models (Train, 1979; Santoso and Tsumokawa, 2006). Notwithstanding these results, under a different viewpoint some studies claim that the evaluation of transferred models should be more pragmatic in terms of the usefulness of information provided by those models in the application context (Koppelman and Wilmot, 1982; Gunn et al., 1985). This appears to be often of basic scope of importance to transportation planners. Even tough results of pure statistical tests of transferred models indicate that parameters do not remain stable over time, relative measures of transferability suggest that useful information can be provided by those models in the application context (Badoe and Miller, 1995). This study has two objectives, in which the first one is to investigate the short-range temporal transferability of transport modal choice models. In the empirical analysis, two models are developed and their performances are compared. These models are the classical Multinomial Logit (MNL) model and the hybrid Neuro-Fuzzy Multinomial Logit (NFMNL) model. The NFMNL model incorporates linguistic information into its utility functions in an attempt of better representing the subjective travelers’ behavior (Andrade, et al., 2006). The second objective of this study is to explore the use of Geographic Information System (GIS) data bases and tools in order to obtain the required information to be used during the forecasting procedure. After this introduction, Section 2 discusses about the use of new techniques to the modal choice modeling; Section 3 describes the University of Canterbury modal choice trends in the last four decades; Section 4 details the data sources and the evaluation measures used in this study; Section 5 shows the development of the models for the estimation context year; Section 6 discusses the forecasting results; and Section 8 summarizes this work’s findings. 2. APPLICATION OF NEW THECNIQUES TO THE MODAL CHOICE MODELING Artificial Intelligence (AI) that is one of the newest sciences has received considerable attention in the scientific literature. AI techniques have become very popular in solving several kinds of real-world problems, substantially because of their human-like characteristics. These techniques, also referred to in the literature as soft computing techniques, have been largely explored in the field of transport modeling, toward overcoming some of the restrictions of the traditional transportation modeling and further improving models accuracy. Soft computing techniques include Neural Networks (NN), Fuzzy Systems (FS), Genetic
Proceedings of the Eastern Asia Society for Transportation Studies, Vol.6, 2007
Algorithms (GA), and other learning techniques (Roorda, et al., 2006). Some potential advantages associated with such flexible techniques are the short time required to generate good predictions, the ability of modeling non-linear systems, the capability of including categorical variables, and the ability of dealing with noisy data, which is difficult to fit in statistical models (Mohammadian and Miller, 2002). These features are in line the contemporary strategic viewpoint of transportation planners toward developing sustainable transportation systems. In the field of AI, hybrid systems have been developed in an attempt to take advantage of the relative merits of soft computing techniques (Fukura, 1994). Among these hybrid systems there is the so-called Adaptive Neuro-Fuzzy Inference Systems (ANFIS). ANFIS combines the learning capabilities of the ANN with the framework of fuzzy systems so as to enhance the adaptive capabilities of conventional artificial systems (Azvine, et al., 1997). The main task of ANFIS is to find an appropriate architecture and a set of parameters to best model an unknown target system that is described by a set of input-output data pairs (Jang, et al., 1997). It is argued that the adaptive capability can also contribute to reducing human judgment errors accounted in the model parameters at the initial stage of the development of classical fuzzy systems. Consequently, neuro-fuzzy systems arise as an interesting tool for dealing with travel behavior problems. Some studies have successfully applied ANFIS in solving various problems in the field of traffic and transportation planning (Andrade, et al., 2006; Park, 2002; Pursula and Pikkarainen, 1994). 3. UNIVERSITY OF CANTERBURY MODAL CHOICE TRENDS Christchurch city's population is mainly served by road-based transport modes, which includes motor vehicles, bicycles and walking. Among these modes, private automobile is the most used, and its use has specially increased in the last decade (Douglas, 2000). The number of registered cars in Christchurch has increased from approximately 121 to 247 thousands vehicles within the period between 1971 and 2001. Besides, number of cars has increased from 460 cars per 1000 population in 1971 to 762 cars per 1000 population in 2001. This scenario suggests that car availability is likely to have strong effect on transport modal choices. The University of Canterbury influences strongly Christchurch's traffic network, because it is the largest traffic generator in the city (Nicholson, 2003). The University has about 12000 students and 1600 staff. Its campus has moved from the downtown Christchurch city to a suburban area in the period of 1961-1975, which induced a widespread on-street parking around the campus. Consequently, it has contributed to car use increasing rate. For several decades, effort has been made so as to change transport modal choice behavior towards more sustainable transport modes. Among these efforts there is the development of a series of surveys by the University in order to investigate students and staff travel behavior. The temporal changes in modal split from the 1966 to 2004 years are summarized in Table 1. It is shown in this table that car trips for staff and students decreased within the period of 1966-1976. Moreover, it is shown that during this period there was a considerable decline in bus trips for both staff and students. Nicholson (2003) suggests this could be motivated by the University shifting from the downtown Christchurch to a suburban area. Besides, bicycle use by staff and walking by students increased substantially in the same period. After 1976, moderate changes were observed in car use by staff; while its use decreased in the period 2000-2004 for students. On the contrary, bus use increased from 1993 to 2004 for both staff
Proceedings of the Eastern Asia Society for Transportation Studies, Vol.6, 2007
and students. Moreover, walking is becoming more popular, especially among students. This table suggests a tendency of using more sustainable transport modes, which might be a result from the continuous efforts in developing strategic transportation systems in Christchurch city. Table 1 University of Canterbury modal choice trends Staff
Year Car
Bus
1966
64.0
9.6
14.4
1971
60.8
10.0
1976
59.0
1993
Students
Bicycle Walk
Other
Car
Bus
Bicycle
Walk
Other
6.4
5.6
35.2
10.4
27.2
9.6
17.6
16.0
7.2
6.0
31.2
10.4
28.0
12.8
17.6
3.0
22.0
8.0
8.0
32.0
5.0
23.0
23.0
17.0
69.1
0.5
18.2
10.3
1.9
38.1
2.2
37.6
18.4
3.7
2000
68.4
2.5
15.0
12.5
1.6
49.0
5.7
14.5
29.6
1.2
2004
69.0
4.1
15.4
10.7
0.8
42.1
10.0
11.7
31.8
4.4
4. DATA SOURCE AND EVALUATION MEASURES The data samples used in this study were obtained from a series of Transport Surveys developed by the University of Canterbury, Christchurch city, New Zealand. Some of those surveys focused exclusively on revealed preference information; while others included hypothetical mode-choice scenarios (i.e. focused on joint revealed-stated preference information) in order to investigate the influence of transport policy options on modal choices. The surveys developed in 2000 and 2004 were used in this study as the estimation and application context, respectively. Furthermore, the residential locations of the respondents were used during the forecasting process. Students and staff residential locations are included in the University’s geographical data base. Even though the time interval between the two contexts is short, there were significant changes in the characteristics of the area’s transportation system. The implementation of car parking charges, which started from 2003, is the most significant difference between the two contexts; and it was addressed in different ways in the surveys. In the 2000 data survey this action was addressed as stated preference. The 2004 data survey comprised car parking charges as revealed preference. The influence of implementing car parking charges on modal choices is the focus of this paper. Table 2 summarizes characteristics of the data samples. Among staff, an increasing rate of car trips was noted, despite reducing rate of car availability between the investigated scenarios. Moreover, bus trips rate also increased considerably; and bicycle and walking rates reduced between scenarios. Among students, the same tendency was observed with respects to bus and bicycle trips. Besides, car trips reduced; and walking trips increased between estimation and application contexts. The performance of the models are evaluated by investigating how well they replicate the full sample of the 2004 staff and students trips. In the evaluation process, aggregate measure results of transferred models and re-calibrated application context models are analyzed. In this study, models transferability is achieved by combining the estimation context (2000) models with the application context (2004) residential location data, which is obtained from a geographical data base by using GIS tools. Re-calibrated models are used to investigate the models’ capability with respect to simply using the available application context data.
Proceedings of the Eastern Asia Society for Transportation Studies, Vol.6, 2007
Furthermore, a sensitivity analysis is developed so as to explore whether or not the transferred models are able to demonstrate the influence of parking cost variations on the application context share probabilities. Table 2 Data sample characteristics Estimation (2000) Application (2004) Students Staff Students Staff Respondents rate 22.8 58.0 24.1 49.5 Male respondents rate 49.0 52.3 44.8 49.5 Female respondents rate 51.0 47.7 55.2 50.5 Car availability rate 78.2 98.2 62.0 87.2 Bicycle availability rate 65.0 65.7 55.2 63.0 Car trips (%) 43.5 66.3 40.9 69.2 Bus trips (%) 5.6 1.9 11.1 4.2 Bicycle trips (%) 16.3 18.3 12.8 15.8 Walking trips (%) 34.6 13.5 35.2 10.8 The root mean square error (RMSE) index is calculated in order to evaluate the predictive accuracy of the models, i.e. to investigate the variation between model estimation results and survey results (Equation 1).
∑ (P − A ) i
RMSE =
2
i
i
, ∀ i ∈ {C i },
n
(1)
where Pi is the probability of selecting mode i; Ai is the actual choice of mode i; n is the number of alternatives; and Ci is the set of alternatives. This index is an absolute measure of transferability (Koppelman and Wilmot, 1982). In addition, the mean absolute error (MAE) measure is also calculated as an absolute measure of predictive accuracy, as follows:
MAE = ∑ Pi − Ai i
∑P, i
∀ i ∈ {C i }.
(2)
i
5. DEVELOPMENT OF MODAL CHOICE MODELS Initially, the MNL model was developed. This model assumes that individual utility is calculated for all possible alternatives; then the alternative with the highest utility is chosen (Meyer and Miller, 2001). According to the MNL model, the probability of mode i being selected by decision maker n is:
Pin = 1 1 + ∑ exp
∆U ij n
( ∀j ≠ i )
j n
where : ∆U ij = (U in − U jn ), U in = utility of mode i for decision maker n. In this study, the linear utility functions were formulated as:
(3)
Proceedings of the Eastern Asia Society for Transportation Studies, Vol.6, 2007
U in = β 'i + ∑ β ik X ik ,
(4)
k
where : X ik = measurable attribute variable k for mode i; β ik = parameter of attribute variable k ; and β 'i = parameter of alternative - specific constant for mode i. Alternative-specific constant for mode were included so as to reflect the relative advantage of each mode to the other modes. The inclusion of alternative-specific constants is important because it is impractical to include all mode attribute variables considered by travelers during the modal choice process (Nicholson, 2003). Revealed preference and stated preference data were combined in the model’s structure. Some advantages accounted to the stated preference approach are its flexibility, and the possibility of obtaining qualitative information (under the analyst’s control) at a relatively small cost as a result of using multiple scenarios (Taylor and Hani, 1996). However, this approach suffers from problems such as: non-commitment bias (i.e. respondents might act differently from their answers in hypothetical conditions); and policy response bias (i.e. respondents might answer so as to influence future policy) (Nicholson, 2003). The use of revealed preference data, based on observations of actual choices, deals with these problems even thought it requires a large number of observations and may include only existing alternatives. By trying to gather the advantages of both methods, it has been suggested using joint revealed-stated preference data, which appears to give stable estimates (Polydoropoulou and Ben-Akiva, 2001). Table 3 shows the attribute variables assumed in this study. The parking cost (stated preference attribute variable) reflects the commuters’ willingness to pay a daily parking fee at the University campus. Table 3 Modeled mode-specific attribute variables Car Bus Bicycle Ride Time (βTcar) Ride Time (βTbus) Cycle Time(βTcycle) Parking Cost (βPC) Bicycle Ownership (βBO) Car Availability (βCA)
Walk Walk Time (βTwalk)
According to the reveled preference data, especially car and bicycle choices varied among male and female staff. These data showed that 61.6% and 78.7% of male and female staff traveled by car, respectively; with the corresponding proportion being 23.7% and 9.6% for cycling. Moreover, 2.7% and 2.0% of male and female staff traveled by bus; and 12.0% and 9.6% of them traveled by walking. For students, the effect of gender was not very large, with 41.8% and 46.9% of male and female students traveling by car, respectively; with corresponding proportions being 4.7% and 6.6% for bus; 17.5% and 13.7% for cycling; and 36.0% and 32.8% for walking. It was thus decided to segment the sample and to estimate separate models for male staff, female staff, male students and female students. The Maximum Likelihood method was used in the parameters estimation and the model was calibrated by using the Limdep package (Limdep, 1998). Table 4 summarizes the final utility functions; and it shows that all the coefficients present correct sign. Almost all parameters were significant at the 5% confidence level (critical value of t-Statistics is approximately 1.96). The t-Statistics varied from 1.5 to 11.5. Average value of t-Statistics for PC attribute variable was 11.1, which confirms this attribute variable influences strongly modal choices.
Proceedings of the Eastern Asia Society for Transportation Studies, Vol.6, 2007
Table 4 Estimation results of MNL model Attribute Male Female Male Variable Students Students Staff -0.401 -1.574 3.106 βcar -3.913 -2.350 -2.680 βbus -1.184 -1.595 -0.089 βcycle -0.760 -1.174 1.165 βwalk βTcar -0.080 -0.011 -0.350 βTbus -0.104 -0.086 -0.211 βTcycle -0.245 -0.333 -0.412 βTwalk -0.258 -0.199 -0.890 βPC -1.257 -1.653 -1.999 βCA 1.779 -1.933 3.679 βBO 1.095 2.936 5.432
Female Staff 3.159 -2.734 -1.213 1.861 -0.148 -0.122 -0.431 -0.155 -1.869 0.982 1.497
The model was then used to estimate the modal shares in 2000, and the results were compared with the observed modal shares. Table 5 shows that the model overestimated car share; and underestimated bus, bicycle and walk shares for students. For staff, the model underestimated car and bus shares; and it overestimated bicycle and walk shares. Despite these discrepancies, RMSE and MAE indicate that the estimation results are relatively close to the actual modal choices. Table 5 Modal shares (%) in 2000 by the MNL model Mode Students Staff Car 54.1 (43.5) 58.4 (66.3) Bus 2.1 (5.6) 0.6 (1.9) Bicycle 14.1 (16.3) 22.3 (18.3) Walk 29.7 (34.6) 18.8 (13.5) RMSE 6.255 5.186 MAE 0.214 0.185 Note: Observed values in parentheses. In sequence, the NFMNL model was developed for the estimation context year. This model is based on the assumption that each individual derives non-linear utility or disutility from the aspects of the modal choices, and finally selects the mode with the highest utility. In this model, the parameters of the neuro-fuzzy utility functions were optimized by applying the learning hybrid rule, which combines steepest descent (SD) and least squares estimator (LSE) for identifying the parameters of the consequent part of the inferential rules (Jang et al., 1997). The optimization algorithm proposed in the Fuzzy Logic Toolbox of the software Matlab (2001) was used for estimating the neuro-fuzzy utility functions. The fuzzy inference rules were formulated as follows: Rik : If Ti is Ai ,T and PCi is Ai , PC and CAi is Ai ,CA and BOi is Ai , BO ... ... then sik = δ ik,T Ti + δ ik, PC PCi + δ ik,CACAi + δ ik,BO BOi + ε ki , (5) k = 1,..., K {∀ i ∈ (car , bus, cycle, walk )} where Ti (travel time), PCi (parking cost), CAi (car availability), and BOi (bicycle ownership), are linguistic values corresponding to the input variables; the function sik is assumed as the systematic component of the neuro-fuzzy utility functions (sik is a crisp function to be used for the Sugeno fuzzy model, which is assumed in this study); δi,Fk (i ∈ (car, bus, cycle, walk), F ∈
Proceedings of the Eastern Asia Society for Transportation Studies, Vol.6, 2007
(T, PC, CA, BO)) and εki are the parameters of the membership functions, in which the latter reflects the unknown factors; K is the number of fuzzy rules; and Ai,T, Ai,PC, Ai,CA, and Ai,BO are fuzzy sets in the antecedent of the fuzzy rules. From the initial 324 fuzzy inference rules (22 x 34 linguistic values), 9 rules were extracted by applying the named Subtractive Clustering technique (Matlab, 2001) to represent the investigated system. Finally, the Defuzzification was developed so as to provide the crisp outputs to be the representative values for the utility functions. The Weighted Average method was used in this study for the defuzzification (Jang et al., 1997). Equation 6 shows the formulation used to model the utility functions. K
Vin = ∑ wi sk k
k
k =1
N
i
K
∑w
i
k
, ∀ i ∈ (car , bus , cycle , walk )
(6)
k =1
where : wi = ∏ µ jm ( xj ), j =1
Moreover, µjm(xj) is the mth membership function for the jth attribute variable; wik is the implication operator of the fuzzy rules, which is used for modeling the output fuzzy sets; and ski corresponds to the state variable obtained from the fuzzy rules. The multiplication of the linear fuzzy inference rules (Equation 5) by the nonlinear product wik of the membership functions results in an overall nonlinear output function for the neuro-fuzzy network, and ensures the universal function approximation capability (Wang et al., 2005). This is a very interesting characteristic of the neuro-fuzzy network, since it means that nonlinear trends in the modal choices can be modeled by the network. Then, the modal shares are estimated as follows:
Pin = 1 1 + ∑ exp ∆Vij , (∀j ≠ i) , n
(7)
j
where ∆Vijn = (Vin – Vjn). For a complete description of the NFMNL model, see work by Andrade et al. (2006). Table 6 summarizes the estimated modal shares for 2000 by using the NFMNL model. The main discrepancies were observed for staff choices, where the model overestimated walk use, while for students, the model underestimated walk use and overestimated car use. Despite these differences, considerable good agreement with survey results was confirmed by the RMSE and MAE indexes. Table 6 Modal shares (%) in 2000 by the NFMNL model Mode Students Staff Car 47.7 (43.5) 61.0 (66.3) Bus 3.3 (5.6) 0.7 (1.9) Bicycle 19.7 (16.3) 17.4 (18.3) Walk 29.3 (34.6) 21.0 (13.5) RMSE 3.935 4.652 MAE 0.151 0.149 Note: Observed values in parentheses. 6. FORECASTING RESULTS: APPLICATION CONTEXT It was decided to check the temporal stability of the MNL and the NFMNL models calibrated using 2000 data, by comparing the predicted with the observed modal shares for 2004. The 2004 modal shares were predicted by using the 2000 MNL and NFMNL models and the staff and students residential location data for 2004. The 2004 travel data survey contained the residential locations of 754 staff (i.e. 47.2%) and 2770 students (i.e. 23.1%).
Proceedings of the Eastern Asia Society for Transportation Studies, Vol.6, 2007
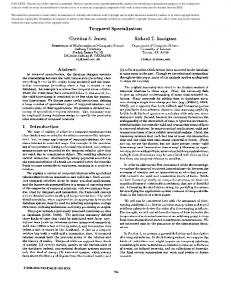
To forecast modal shares for 2004, initially the residential locations of respondents were determined, with respect to 114 Census Area Units (CAU) defined for Christchurch by the 2001 Census. The average CAU population in 2004 was approximately 2970 people. Figure 1 shows the residential locations of surveyed students and staff by the CAU’s in Christchurch’s main urban area. The University of Canterbury’s location is also shown in this figure.
Univ. of Canterbury Staff Students Census Area Units
Figure 1 Staff and students residential location according to the Census Area Units of Christchurch city After estimating the number of male and female students and staff (by scaling the survey sample data) per CAU, it was necessary to calculate the utility functions of each transport mode for travel between each CAU and the University. To calculate 2004 modal utilities, it was required to estimate the travel time between each CAU and the University by each transport mode. The mode travel times were obtained by using the information contained in the University of Canterbury’s geographical data base. To do this, the minimum travel distance from each CAU to the University by considering bus routes (for bus mode) and urban road network (for car, bicycle and walk modes) was calculated by using the Network Analyst tool of the ArcView GIS version 9.1 (2000). Figures 2 and 3 show Christchurch’s urban road network and bus system, respectively. The travel distance was combined with the average speed by mode, contained in the 2000 survey data base so as to estimate travel times per mode. The average speed trough the CAU’s were 65.3km/h, 48.0km/h, 19.5km/h and 6.2km/h, by car, bus, bicycle and walk, respectively. Average speed by walking was estimated by using time and distance data contained in the 2000 database. These travel times were then used along with the 2000 utility functions (2000 MNL and NFMNL models parameters) in order to determine the utility function for each mode for travel from each CAU to the
Proceedings of the Eastern Asia Society for Transportation Studies, Vol.6, 2007
University. Then, the Logit structure was used to estimate the probability of each mode being chosen for each CAU and each population segment. Finally, this probability was combined with the number of each population segment per CAU, to estimate the number of travelers expected to use each mode. Table 7 shows the observed and predicted (by both the MNL and the NFMNL models) modal shares for 2004.
Urban Road Network
Figure 2 Urban road network of Christchurch city
Bus System
Figure 3 Bus system of Christchurch city
Proceedings of the Eastern Asia Society for Transportation Studies, Vol.6, 2007
Mode Car Bus Bicycle Walk RMSE MAE
Table 7 Observed and predicted modal shares (%) in 2004 Observed Shares MNL Model NFMNL Model Students Staff Students Staff Students Staff 40.9 69.2 66.9 92.7 62.8 89.0 11.1 4.2 5.2 0.1 2.3 0.3 12.8 15.8 7.8 4.8 14.0 7.2 35.2 10.8 20.1 2.4 20.9 3.5 15.537 13.766 13.813 11.542 0.521 0.469 0.462 0.395
This table shows that estimated results do not match observed modal shares very well. Both MNL and NFMNL models considerably overestimated car share for students and staff. Also, the models underestimated use of the other modes for both population segments, except bicycle share of students which was slightly overestimated by the NFMNL model. One possible reason for the estimation errors is that the residential locations of surveyed staff and students seem biased. When analyzing the data samples, it was noted that both students and specially staff living in further CAU’s were found to be more likely to travel by car, and that the travelers living close to the university were somewhat over-represented in the sample. It seems that the proportion of students and staff traveling by car was higher than the 2004 survey suggested. Furthermore, the fact that several CAU’s are not at a walking distance to the University, thus travelers living in those CAU’s had restricted choice set (i.e. car, bus or bicycle), was not taken into account when predicting the 2004 modal shares. Another possible reason is the changing aspect of the parking cost attribute variable. The actual values of parking, which were paid in 2004 (imposed from 2003), are much lower than those values suggested in the 2000 survey, then increasing the probability of selecting mode car. By considering these results, the present study suggests, as suggested by other transferability studies that directly transferred models may not be able to capture the changing aspects of the transportation system between the estimation and the application context. Notwithstanding these results, the transferability measures show slightly better performance of the transferred NFMNL model in forecasting modal choices than the performance of the classical MNL model (see RMSE and MAE values in Table 7). In addition, it was decided to investigate small sample re-calibrated models. These models are similar in specification to those developed in the estimation context; and they were calibrated by using small application context data sets composed of 150 (staff) and 550 (students) samples. The samples used for re-calibrating the models were randomly extracted from the total 2004 data samples. Results of re-calibrated models are shown in Table 8.
Mode Car Bus Bicycle Walk RMSE MAE
Table 8 Modal shares (%) by re-calibrated models in 2004 Observed Shares MNL Model NFMNL Model Students Staff Students Staff Students Staff 40.9 69.2 54.6 85.6 47.4 77.5 11.1 4.2 8.5 1.4 4.8 2.5 12.8 15.8 7.0 6.9 16.6 9.1 35.2 10.8 29.9 6.1 31.3 10.9 7.998 9.703 5.291 5.408 0.274 0.327 0.205 0.168
Proceedings of the Eastern Asia Society for Transportation Studies, Vol.6, 2007
As shown in this table, estimation results from re-calibrated models are significantly better than those from the direct transferred models, which are confirmed by the results of RMSE and MAE indexes. However, even though both models overestimated car shares (for both staff and students) bigger discrepancies were accounted to the MNL model estimations. The NFMNL model presented better performance than the MNL model in estimating share probabilities based on a small data sample, which is confirmed by the results of the RMSE and MAE measures. Specially, reasonable results were obtained for car and walk shares by the NFMNL model. These results highlight the advantages of using neuro-fuzzy-based models when dealing with limited data samples, which is frequently observed when developing transportation studies. Finally, a sensitivity analysis was performed so as to investigate travel behavior under changes of parking fees. Parking costs ranging from 0 to 2.5NZD were tested. These values include the average parking costs obtained from the estimation and the application contexts (2.16 and 0.11NZD, respectively). Figure 4(a) demonstrates that the NFMNL model was able to represent the influence of the parking cost attribute variable on modal choices for both students and staff. It is shown that the higher the cost of parking, the lower the probability of car use. Moreover, it is indicated that walking trips are not very much influenced by variations on parking fees. Data obtained from the actual travelers’ preferences ratify these findings. However, parking cost variations did not influence modal choices very much by the MNL model (Figure 4(b)). These results might not be accurate, because parking cost attribute variable was previously identified as a significant factor for explaining the modal choices. a) NFMNL Model 60.1
50
Walk 45.2
40
37.9 34.2
33.9
33.4
32.2
31.60
30 20
10 3.8
5.9 1.8
4.10 0 0.00 0.0
0.5
1.0
7.8
4.5 1.5
98.0
96.1
Mode selection (%)
85.1
80
80.2
73.4
60
40
20
1.90 0 0.0 0.0
2.4
1.5 0.0
0.5
5.7
7.9 5.9 1.1
9.5 8.7 1.6
1.0
1.5
2.0
2.4 0.5
13.9 10.2 2.5 2.5
Parking cost (NZD)
56.5
40 30
29.10
29.2
29.3
29.4
29.6
3.8 2.6
4.2 2.8
6 3.3
7.1 4.8
29.8
20 9.5
10 3.40 2.40
0
0.0
100 90
Cycle Walk
91.4
61.3 58.5
6.1
Bus
63.7
Car Bus Cycle Walk
50
0.5
1.0
1.5
4.2
2.0 2.5 Parking cost (NZD)
Staff
Car
Staff
64.4
60
2.0 2.5 Parking cost (NZD)
120
100
35 30.0 28.9
20.1
16.4
10
65.1
Cycle
52.8
Mode selection (%)
60 Mode selection (%)
Car Bus
Students
64.3
95.1
93.8
92.4
90.2
80 Mode selection (%)
70
b) MNL Model Students 70
88.5
86.6
60
Car Bus Cycle
50
Walk
70
40 30 20 10 0
4.40 0.50 0.00 0.0
5.4 0.8 0 0.5
6.5 1.1 0 1.0
7.2 6.8 7 5.8 4.3 2.9 0.2 0.4 0.1 1.5 2.0 2.5 Parking cost (NZD)
Figure 4 Effect of parking cost variations on transport modal choices by NFMNL model (a) and MNL model (b)
Proceedings of the Eastern Asia Society for Transportation Studies, Vol.6, 2007
8. CONCLUSION Understanding clearly the existing travel behavior and the possible reasons influencing this behavior is fundamental when developing and implementing transportation plans. This knowledge assists greater acceptance of transport strategies, which are aimed to motivate changes in travel behavior, from those affected by them. Consequently, it contributes in assuring greater sustainability in transport. The development of accurate travel behavior models can assist transportation planners when implementing transport strategies. Fundamentally, these models should provide useful information so as to be the basis for the decision-making process in the context of transportation plans. The objective of this study was to evaluate two travel behavior models with respects to the usefulness of their information provided when estimating and forecasting travel behavior. The models differ primarily by applying linear (MNL model) and non-linear (NFMNL model) modal utilities for explaining travel behavior. Moreover, it was intended to use Geographic Information Systems in order to reduce data collection during the forecasting process; and consequently to contribute to the development of transportation studies. The geographical data bases and GIS analysis tools were successfully used during the transfer procedure. The differences in the transportation system between the estimation and application contexts, mainly accounted to the implementation of parking fees (strategic policy action) at the University campus, could neither be completely captured by the hybrid NFMNL model nor by the classical MNL model. In particular, transfer errors were very large in the MNL model’s forecasts. It was shown that these models need regular re-calibration in order to produce more accurate estimates of mode split in 2004. Notwithstanding these results, overall the newly developed NFMNL model presented better performance in both estimating and forecasting students and staff travel behavior. The neuro-fuzzy non-linear utilities could explain satisfactorily the relationship among explanatory variables and modal choices. Furthermore, by including linguistic information on its utility functions, the hybrid model could explain the uncertain human behavior in terms of transport modal choices. These seem to be advantages that could be explored when solving transportation problems.
ACKNOWLEDGEMENT Access to the travel behavior data bases used in this paper was provided by the University of Canterbury, Christchurch, New Zealand.
REFERENCES Andrade, K., Uchida, K. and Kagaya, S. (2006) Development of transport mode choice model by using adaptive neuro-fuzzy inference system In Transportation Research Record: Journal of the Transportation Research Board, TRB, National Research Council, Washington, D.C. (in press). ArcView GIS, Geographic Information System Software (2000) version 9.1. Azvine, B., Azarni, N. and Tsui, K. C. (1997) An introduction to soft computing: A tool for building intelligent systems. in Nwana, H. S., and Azarni, N. (eds.) Software Agents and Soft Computing: Towards Enhancing Machine Intelligence, Springer, USA.
Proceedings of the Eastern Asia Society for Transportation Studies, Vol.6, 2007
Badoe, D. A. and Miller, E. J. (1995) Analysis of the temporal transferability of disaggregate work trip mode choice models. In Transportation Research Record: Journal of the Transportation Research Board, No. 1493, TRB, National Research Council, Washington, D.C., 1-11. Chou, Y. H. (1997) Exploring Spatial Analysis in Geographic Information Systems. OnWord Press, Santa Fe. Douglas, M. (2000) Christchurch City, Centre 40 Years of Change, Traffic, Planning 19591999. Christchurch City Report, New Zealand. Easa, S. and Chan, Y (1999) Urban Planning and Development Applications of GIS. ASCE, Reston. Fisher, M.M. (1999) Spatial analysis: Retrospect and prospect. In Longley, P. A., Goodchild, M. F., Maguire, D. J., Rhind, D. W. (eds.). Geographical Information Systems – Principles and Technical issues, vol. 1 and 2, John Willey&Sons, New York. Fukura, T. (1994) Fuzzy-neuro-GA based intelligent robotics. In Computational Intelligence Imitating Life, IEEE Press, 352-363. Gunn, H. F., Ben-Akiva, M. E. and Bradley, M. A. (1985) Tests of the scaling approach to transferring disaggregate travel demand models. In Transportation Research Record: Journal of the Transportation Research Board, No. 1037, TRB, National Research Council, Washington, D.C., 21-30. Hensher, D. A. and Button, K. J. (2000) Handbook of Transport Modelling, Elsevier Science, UK. Jang, J. S. R., Sun, C. T. and Mizutani, E. (1997) Neuro-Fuzzy and Soft Computing: A Computational Approach to Learning and Machine Intelligence. Prentice Hall, USA. Karasmaa, N. and Pursula, M. (1995) Empirical studies of transferability of Helsinki metropolitan area travel forecasting models. In Transportation Research Record: Journal of the Transportation Research Board, No. 1607, TRB, National Research Council, Washington, D.C., 38-44. Koppelman, F. S. and Wilmot, C. G. (1982) Transferability analysis of disaggregate choice models. In Transportation Research Record: Journal of the Transportation Research Board, No. 895, TRB, National Research Council, Washington, D.C., 18-24. Laurini, R. and Thompson, D. (1994) Fundamentals of Spatial Information Systems. Academic Press, London. Limdep Econometric Software (1998) LIMDEP. Economic Software Inc. New York, USA. Malczewski, J. (1999) GIS and Multicriteria Decision Analysis. John Willey&Sons, New York. Matlab (2001) Fuzzy Logic Toolbox User’s Guide. The MathWorks, Inc., USA. Meyer, M. D. and Miller, E. J. (2001) Urban Transportation Planning. Mc Grow Hill, USA. Mohammadian, A. and Miller, E. J. (2002) A Comparison of the Performance of Nested Logit Models and Artificial Neural Networks for Predicting Household Automobile Choices. Proceedings of the Transportation Research Board, CD-ROM, TRB, National Research Council, Washington, D.C. Nicholson, A. (2003) Development of the University of Canterbury transport strategy: Temporal stability of a mode choice model, Presented at the XIX Annual Meeting of the Brazilian National Association for Transport Researching and Teaching, Brazil. Openshaw, S. and Alvanides, S. (1999) Applying geocomputation to the analysis of spatial distributions. In Longley, P. A., Goodchild, M. F., Maguire, D. J., Rhind, D. W. (eds.). Geographical Information Systems – Principles and Technical issues, Vol. 1 and 2. John Willey&Sons, New York.
Proceedings of the Eastern Asia Society for Transportation Studies, Vol.6, 2007
Park, B. (2002) Hybrid neuro-fuzzy application in short-term freeway traffic volume forecasting. In Transportation Research Record: Journal of the Transportation Research Board, No. 1802, TRB, National Research Council, Washington, D.C., 190-196. Parody, T. E. (1977) An analysis of disaggregate mode choice models in prediction. In Transportation Research Record: Journal of the Transportation Research Board, No. 637, TRB, National Research Council, Washington, D.C., 51-57. Polydoropoulou, A. and Ben-Akiva, M. (2001) Combined revealed and stated preference Nested Logit Access and Mode Choice model for multiple mass transit technologies. In Transportation Research Record: Journal of the Transportation Research Board, No. 1771, TRB, National Research Council, Washington, D.C., 38-45. Pursula, M. and Pikkarainen, P. (1994) A neural network approach to vehicle classification with double induction loops, Proceedings of the New technologies, Local Government, Bridges, 17th ARRB Conference, Queensland, Australia, 29-44. Roorda, M. E., Miller, J. and Kruchten, N. (2006) Incorporating Within-Household Interactions into a Mode Choice Model using a Genetic Algorithm for Parameter Estimation. Proceedings of the Transportation Research Board, CD-ROM, TRB, National Research Council, Washington, D.C. Santoso, D. S. and Tsunokawa, K. (2006) Cross country transferability analysis of disaggregate choice models in developing countries, Presented at the 85th Annual Meeting of the Transportation Research Board, Washington, D. C. Smith, B. L. and Demetsky, M. J. (1994) Short-term traffic flow prediction: Neural Network approach. In Transportation Research Record: Journal of the Transportation Research Board, No. 1453, TRB, National Research Council, Washington, D.C., 98-104. Stillwell, J., Geertman, S. and Openshaw, S. (1999). Geographical Information and Planning. Springer, Berlin. Taco, P.W.G., Yamashita, Y., Souza, N.M. and Dantas, A.S. (2000) Trip generation model: A new conception using Remote Sensing and Geographic Information Systems. Photogrammetrie Fernerkundung Geoinformation, Germany, Vol. 2, 119-131. Taylor, D. and Hani, M. (1996) Analysis of stated preferences for intermodal bicycle-transit interfaces. In Transportation Research Record: Journal of the Transportation Research Board, Part C, Vol. 5, TRB, National Research Council, Washington, D.C., 86-95. Train, K. E. (1979) A comparison of the predictive ability of mode choice models with various levels of complexity. In Transportation Research Record: Journal of the Transportation Research Board, Vol. 3A, TRB, National Research Council, Washington, D.C., 11-16. Tsai, T. H., Lee, C. K., and Wei, C. H. (2005) Design of dynamic Neural Networks to forecast short-term railway passenger demand, Journal of Eastern Asia Society for Transportation Studies, Vol. 6, 1651-1666. Wang, L., B. Liu and Wan, C. (2005) On the universal approximation theorem of Fuzzy Neural Networks with random membership function parameters. In Advances in Neural Networks, Vol. 3496. Springer Berlin, Heidelberg, 45-50. Yunker, K. R. (1976) Tests of the temporal stability of travel simulation models in southeastern Wisconsin. In Transportation Research Record: Journal of the Transportation Research Board, No. 610, TRB, National Research Council, Washington, D.C., 1-5.