derived from METEOSAT water vapor imagery can provide important ... quality control procedure is invoked once the wind vector field has been derived (Hayden.
INVESTIGATION OF WATER VAPOR MOTION WINDS FROM GEOSTATIONARY SATELLITES
CHRISTOPHER VELDEN
Cooperative Institute for Meteorological Satellite Studies Univ. of Wisconsin-SSEC, 1225 W. Dayton St, Madison, Wisconsin 53706 USA
ABSTRACT
Motions deduced in animated water vapor imagery from geostationary satellites can be used to infer wind fields in cloudless regimes. For the past several years, CIMSS has been exploring this potentially important source of global-scale wind information. Recently, METEOSAT-3 data has become routinely available to both the U.S. operational and research community. Compared with the current GOES satellite, the METEOSAT has a superior resolution (5km vs. 16km) in its water vapor channel. Preliminary work at CIMSS has demonstrated that wind sets derived from METEOSAT water vapor imagery can provide important upper-tropospheric wind information in data void areas, and can positively impact numerical model guidance in meteorological applications. Specifically, hurricane track forecasts can be improved. Currently, we are exploring methods to further improve the derivation and quality of the water vapor wind sets.
1.
INTRODUCTION
Water vapor imagery from GOES satellites has been available for over a decade. These data are used extensively, mainly in a qualitative mode, by forecasters in the United States (Weldon and Holmes 1991). Some attempts have been made at quantifying the data by tracking features in time sequences of the imagery (Stewart et al. 1985; Hayden and Stewart 1987). For a variety of reasons, applications of this approach have produced marginal results (Velden 1990). Recently, METEOSAT-3 (M-3) was repositioned at 75W by the European Space Agency, in order to provide complete coverage of the Atlantic Ocean. Data from this satellite are being transmitted to the U.S. for operational use. Compared with the GOES satellite, the M-3 has a superior resolution and signal-to-noise ratio in its water vapor channel, which translates into improved automated tracking capabilities. During the Atlantic hurricane seasons of 1992 and 1993, tracking algorithms were applied to the M-3 water vapor data in order to evaluate the coverage, accuracy and model impact of the derived vectors. Data sets were produced during several tropical cyclone cases, including Hurricane Andrew. In this paper, the M-3 water vapor wind sets are assessed, and their impact on a hurricane track forecast model is examined. 2.
STATISTICAL EVALUATION OF THE M-3 WATER VAPOR WINDS
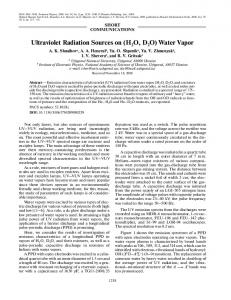
During the spring of 1992, M-3 water vapor wind sets were routinely produced on a daily basis (around 1200UTC) at CIMSS. The domain of the wind sets covered the eastern U.S. and the western North Atlantic ocean basin (Fig. 1). The purpose of this exercise was to assess the horizontal and vertical coverage of the winds, and evaluate their accuracy. M-3 water vapor targets were selectively chosen to be constrained to approximate cloud-free areas in the imagery. This was accomplished by activating an empirically-determined brightness temperature threshold value which was not to be exceeded in the target selection step of the wind-tracking
algorithm. An objective quality control procedure is invoked once the wind vector field has been derived (Hayden and Velden 1991). The data set presented in Fig. 1 is typical of the data sets produced during the exercise. From a purely qualitative point of view, the horizontal coverage of the water vapor wind vectors shown in Fig. 1 is quite good in comparison to conventional and cloud-drift wind observations routinely available over the western North Atlantic basin. It was found that the vertical distribution of the assigned vector pressure-heights in cloud-free areas (based on brightness temperature to radiosonde temperature comparisons) was typically in the range of 200-500mb, with a peak near 350mb. It was also clearly demonstrated for future considerations that the water vapor wind sets could be created on McIDAS (or VDUC at NMC) in a time scale commensurate with real time operations.
Fig. 1. Typical M-3 water vapor wind set coverage. Comparisons between the M-3 water vapor wind vectors and collocated rawinsondes (within 1.0 degree) over the period April - June 1992 were compiled and are presented in Table 1. The winds are also evaluated against the collocated first guess forecast (in this case the Aviation model 12h forecast). Both vector speed bias and RMS were computed and compared. The data sets are also stratified to reflect comparisons with selected rawinsondes in relatively remote areas.
Table 1. Statistical evaluation of M-3 water vapor motion winds from the period April-June, 1992. 1) Versus eastern US/western Atlantic rawinsondes (N=981) H20 Winds Speed bias -0.9 (m/s) Vector RMS 7.8 (m/s)
NMC Forecast
2) Versus Bermuda rawinsonde (N=31) H20 Winds
NMC Forecast
3) Versus Guadeloupe rawinsonde (N=50) H20 Winds
NMC Forecast
-1.7
-0.8
-2.1
-0.7
-1.9
6.6
6.9
7.1
6.6
6.8
Overall, the M-3 vector speed bias (wind vector minus rawinsonde) is -0.9 m/sec, which is just under 1 m/sec better than the first guess forecast. The RMS error, however, is 1.2 m/sec higher than the first guess. The superior performance of the first guess RMS error can be explained by the fact that most of the comparisons were over the eastern United States, an area where the model has been properly initialized with abundant rawinsonde data.
Examination of the relatively remote Bermuda and Guadeloupe rawinsonde comparisons, however, show the RMS error of the M-3 winds slightly below that of the first guess. The speed bias is also much improved over that of the first guess. More recently, M-3 wind sets have been routinely produced on a daily basis by NESDIS in Washington DC since May 1993. The algorithms and tracking methods were transferred from CIMSS in order to test and evaluate them in an operational environment. The target selection and thresholds, and quality control procedures are nearly identical to those utilized at CIMSS. Validation against collocated rawinsondes (N=1471) indicates a vector RMS of 8.2m/s, and a speed bias of -l.lm/s, agreeing closely with the results in Table 1. 3.
IMPACT ON NUMERICAL HURRICANE TRACK FORECASTS
Another way of quantitatively evaluating new data types is through model impact studies. In our investigation, a hurricane track forecast model (VICBAR, DeMaria et al. 1992) is used to test the sensitivity of the water vapor wind data on numerical hurricane track forecasts. VICBAR is a nested, spectral barotropic model that has been run in near-real time at the NOAA/Atlantic Oceanographic and Meteorological Laboratory Hurricane Research Division (AOML-HRD) for the past few years. The initial condition for the forecast model is a vertically averaged (mass weighted) deep-layer mean wind over the 850-200mb depth of the troposphere, with an added tropical cyclone bogus. The barotropic forecast model uses the shallow-water equations, with the forecast storm track determined from the location of the relative vorticity maximum on the innermost model mesh. This forecasting system has been used to evaluate impacts of other data types (Franklin and DeMaria 1992; Velden et al. 1992) Wind sets were produced daily at 1200UTC during several Atlantic tropical cyclones in 1992 and 1993. For the model impact evaluation, forecasts were included based on the following criteria: 1) the storm was within the domain of the generated wind set, and 2) the storm intensity was tropical storm strength or better (>35kts). There were 32 forecast cases, from 10 different storms (including Hurricane Andrew in 1992) that met these criteria. Table 2 shows the results of forecasts which were initialized with operationally available data plus the water vapor wind set produced at CIMSS, compared to control runs which were initialized on operationally available data only. Considering all of the cases together, the results show modest improvements to the forecasts with the inclusion of the water vapor wind data. The improvement in mean forecast error (MFI in Table 2) ranges from 2.2% at 24h to 6.8% at 72h. After an adjustment is made for the serial correlation between forecast cases (Franklin and DeMaria 1992), none of the improvements were found to be significant at the 95% confidence level. Another measure of forecast impact is the frequency of improved forecasts (FIF), which simply shows the percentage of forecasts which resulted in some improvement when the water vapor data were included. The FIF at 72h indicates that 71% (15 out of 21) of the forecasts were improved. Table 2. Impact of METEOSAT water vapor winds on VICBAR tropical cyclone track forecasts. The following verification statistics are valid for forecasts which included the water vapor winds: number of forecasts (N), effective number of independent forecasts (N*), and the mean forecast error (MFE) relative to best track verification. Also given are comparisons with the control forecasts: the mean forecast improvement (MFI}, expressed in both kilometers and as a percent relative to the control forecast error, the standard deviation of the improvements (SDI), the number of improved forecasts (IP), the frequency of improved forecasts (FIF) expressed as a percent, and whether the forecast improvements are statistically significant at the 95% confidence level (SIG).
Forecast Interval (h) N
N*
MFE (km)
MFI (km)
MFI %
SDI (km)
IF #
FIF %
SIG (y/n)
24
32
26.6
149.1
3.3
2.2
23.8
19
60
n
48
27
22.4
338.4
3.9
1.1
48.2
16
60
n
72
21
17.4
347.0
23.6
6.8
91.6
15
71
n
Several of the selected tropical cyclone cases were relatively close to the U.S. mainland. It is reasonable to assume that in these cases, the VICBAR model was relatively well initialized by the nearby conventional (operational) data base, limiting the potential for the satellite data to have a positive impact. On the other hand, storms well out to sea should make better candidates for forecast improvement. To test this hypothesis, the sample was stratified to include only those cases east of 70W. The results of these 23 cases are shown in Table 3. While still not statistically significant at the 95% confidence limit, the MFI percentages and FIF are a notable improvement over the statistics presented in Table 2. Table 3. Same as Table 2, except only for cases east of 70W. Forecast Interval (h) N
N*
MFE (km)
MFI (km)
MFI %
SDI (km)
IF #
FIF %
SIG (y/n)
24
23
19
136.4
9.0
6.6
20.2
16
70
n
48
20
17.8
335.3
10.2
4.3
60.1
13
65
n
72
18
16.2
362.3
30.4
8.4
98.6
13
72
n
Using the stratified sample, it is of interest to examine the distribution of forecast differences between the runs made with the water vapor winds and the control runs in order to fully appreciate the FIF results. Table 4 shows the distribution of the 72h forecast differences. Of the eighteen cases, only two forecasts that included the water vapor winds were notably degraded (greater than 100km) relative to the control forecasts. One of these poor forecasts was a Hurricane Bonnie case, which seemed to result at least in part because Bonnie's track did not follow the deep layer flow used in the model forecast. Rather, it followed a shallow-layer flow, in a direction quite different from the deep-layer flow. The water vapor winds provide measurements in the 200-500mb layer, thus affecting the upper part of the deep layer mean wind flow field. In this case, the control analysis approximated the shallow-layer flow more closely, and as a consequence, the VICBAR model control forecast without the winds was closer to the observed storm track. The reason for the other poor forecast has not yet been identified. On a more positive note, Table 4 shows that thirteen of the eighteen 72h forecasts were improvements over the control forecasts, with five of them being notable improvements (defined here as greater than 100km). Three of the notably improved forecasts occurred during Hurricane Andrew's interaction with an upper-level cyclonic circulation. An example is shown in Fig. 2, from 1200 UT 19 August 1992. At this time the upper-level circulation was situated to the north of Andrew and quite evident in the water vapor imagery. The derived water vapor winds captured the circulation, as shown in Fig. 1. During the next 72h, Fig. 2 shows that Andrew's track was only slightly affected by the upper-level low, shifting it north-northwest for a short time, before Andrew escaped its influence and turned more to the west. However, the VICBAR control forecast from this time recurved Andrew to the north and eventually to the northeast in response to the influence of the upper low on the deep layer mean steering flow. Although the turn back towards the west was not predicted, the VICBAR forecast made with water vapor wind data responded with much less curvature, and an improved longer-range forecast. Table 4. Distribution of 72h forecast errors relative to control forecast errors for cases east of 70W. Forecast differences (km) *
*
**
*
* * **
** * * *
*
*
*
*
|--------------|--------------|--------------|--------------| 200
100
BETTER
0
100
WORSE
200
Fig. 2. Example showing impact of water vapor winds on a VICBAR forecast of Hurricane Andrew's track. 4.
WORK IN PROGRESS
To this point, the CIMSS water vapor winds have been produced from automated techniques designed for cloud drift wind extraction. This includes image preprocessing, target selection, the tracking algorithm, height assignment, and quality control. Clearly, all five of these basic procedures can be refined to better suit the characteristics of the water vapor data. Efforts are underway at CIMSS to examine these five areas to better tune them to water vapor tracking, and some examples are briefly discussed below. a) Image preprocessing NASA-MSFC has developed image filtering techniques to help reduce the noise in the water vapor imagery before the target selection process is invoked. These techniques will be investigated in collaboration with MSFC. b) Target selection The current target selection procedure involves identifying the coldest pixel in the target box with an accompanying brightness temperature gradient which satisfies certain thresholds. This philosophy was chosen to maximize the likelihood of selecting cloud edges as targets, since these features represent good tracers over time in conventional IR imagery. Since we are attempting to provide vectors in cloud-free areas when using the water vapor data, this philosphy may not be optimal. A method will be investigated that simply searches for the maximum brightness temperature gradient over the target selection box. The resultant targets will be evaluated against routinely produced targets. c) Tracking algorithm The current automated tracking algorithm employed at CIMSS (Merrill 1989) uses a correlation method to identify potential matches of target radiance features in subsequent imagery. Currently, a sequence of three images, each separated by one hour, are used to derive two vectors. The two vectors are then averaged to achieve a final vector which is used to represent the tracer. Preliminary investigations indicate the averaging philosphy may not be appropriate with water vapor tracking since, compared to cloud tracking, correlations are lower and noise is higher. An algorithm will be investigated that selects the vector (first, second or average) that best satisfies accompanying quality control checks. In addition, the use of a four image sequence instead of three will be studied. The four image sequence will yield three vectors, which would provide a better evaluation of tracer consistency. d) Height assignment The method currently employed at CIMSS simply matches the target brightness temperature with a first guess temperature profile (assumes a one to one relationship) and extracts a pressure height. A statistical evaluation of the actual relationship may yield superior vector height assignments (Hayden and Stewart 1987).
e) Quality control A two-step quality control procedure is used in the CIMSS tracking system. The first step involves consistency checks between the first and second vector. The second step is an elaborate automated editor which analyzes the wind fields in conjunction with the first guess, and outputs confidence weights on each vector. The auto editor also attempts to find the optimum pressure height assignment for each vector, and therefore may reassign the original height to one which better fits the first guess profile. Efforts are underway to refine this system to take into account the water vapor vector characteristics. To optimize the extraction of quality motion vectors from METEOSAT water vapor imagery, CIMSS is collaborating with NASA-MSFC and EUMETSAT, and will also entertain ideas from the workshop. Model impact experiments are planned in 1994 in coordination with NMC, NASA-MSFC, ECMWF and AOML-HRD. 5. SUMMARY The recent availability of METEOSAT-3 data over the western Atlantic Ocean has led to an effort to extract quantitative information from the water vapor channel. Data sets containing vectors derived from animated M-3 water vapor imagery were produced during 1992 and 1993 using the CIMSS automated wind derivation algorithm. A statistical evaluation of the vectors reveals that the water vapor winds (relative to collocated rawinsondes) show a reduced speed bias compared to the collocated first guess forecast values. The vector RMS errors are larger (by about 1 m/sec) than the first guess over the eastern U.S., but become slightly lower than the first guess at remote locations (e.g., Bermuda and Guadeloupe). The water vapor wind sets were also demonstrated to have a slightly positive impact on barotropic numerical hurricane track forecasts (VICBAR model), although the results were not statistically significant at the 95% level. Except for a couple of examples, the preliminary results seem to suggest that the positive impact is maximized on cases well offshore and away from data-rich regions, as would be expected from intuitive reasoning. Most of the cases near the U.S. coast showed negligible or slightly negative impact. The most notable forecast improvements occurred during Hurricane Andrew's interaction with an upper-level circulation, which was well-captured by the M-3 water vapor winds. Overall, 72h track forecasts were improved by 7%, while nearly 3/4 of the VICBAR forecasts showed some improvement with the inclusion of the water vapor winds into the initial analysis. Current and future efforts are being directed towards refining the CIMSS wind extraction and quality control procedures to better account for the water vapor data and resultant motion vector characteristics. It is envisioned that these data can compliment cloud drift wind data to provide complete global upper-tropospheric wind coverage. 5. REFERENCES DeMaria, M., S.D. Aberson and K.V. Ooyama, 1992: A nested spectral model for hurricane track forecasting. Mon. Wea. Rev., 120, 1628-1643. Franklin, J.L. and M. DeMaria, 1992: The impact of Omego dropwindsonde observations on barotropic hurricane track forecasts. Mon. Wea. Rev., 120, 381-391. Hayden, C.M. and C.S. Velden, 1991: Quality control and assimilation experiments with satellite-derived wind estimates. Preprints, 9th Conf. Numerical Weather Prediction, Denver, Amer. Meteor. Soc., 19-23. Hayden, C.M. and T. Stewart, 1987: An update on cloud and water vapor tracers for providing wind estimates. Preprints, 6th Symp. Meteor. Obs. and Instr., New Orleans, Amer. Meteor. Soc, 70-75. Merrill, R.T, 1989: Advances in the automated production of wind estimates from geostationary satellite imaging. Preprints, 4th Conf. Sat. Meteor. and Ocean., San Diego, Amer. Meteor. Soc, 246-249 Stewart, T.R., C.M. Hayden, and W.L. Smith, 1985: A note on water vapor wind tracking using VAS data on McIDAS. Bull. Amer. Meteor. Soc., 66, 1111-1115. Velden, C.S., 1990: The impact of satellite-derived winds on hurricane analysis and track forecasting. Preprints, 5th Conf. Satellite Meteor., London, England, Amer. Meteor. Soc.,215-219. Velden, C.S., C.M. Hayden, W.P. Menzel, J.L. Franklin, and J.S. Lynch, 1992: The impact of satellite-derived winds on numerical hurricane track forecasting. Wea. and Forecasting, 7, 107-118. Weldon, R.B., and S.J. Holmes, 1991: Water vapor imagery: Interpretation and applications to weather analysis and forecasting. NOAA Tech. Report NESDIS 57, 5200 Auth Rd, Wash., D.C, 213 pp.