Ind. Eng. Chem. Res. 1998, 37, 555-560
555
Ion Exchange Equilibria of Metal Chelates of Ethylenediaminetetraacetic Acid (EDTA) with Amberlite IRA-68 Ruey-Shin Juang* and Lih-Dong Shiau Department of Chemical Engineering, Yuan Ze University, Chung-Li, Taiwan 320, Republic of China
The exchange equilibria of metal chelates of EDTA (ethylenediaminetetraacetic acid) from an equimolar solution of metals and EDTA with a weak-base ion exchanger Amberlite IRA-68 were studied. Experiments were carried out as a function of aqueous pH, the metal concentrations, and temperature. It was shown that whether the aqueous phase was initially acidic or basic, it became acidic and more acidic after exchange. The measured equilibrium isotherms could be well-correlated by the Langmuir equation on a macroscopic basis. The effect of temperature on the equilibria of ion-exchange reactions was studied, and also the corresponding thermodynamic data were evaluated. Introduction Chemical precipitation methods (e.g., OH-, and S2-) are the most economical for the treatment of metalbearing effluents. However, the presence of strong chelating agents such as EDTA (ethylenediaminetetraacetic acid), NTA (nitrilotriacetic acid), citrate, and tartarate may make the precipitation process ineffective, even when treating streams with high metal concentrations (Tunay et al., 1994). The high buffer capacity provided by the chelating agents would require an excessive amount of chemicals to neutralize alkalinity. These problems and restrictions warrant examinations of alternative recovery processes. The potential sources of chelating agent-bearing solutions include the discharge from electroless copper plating for printed circuit boards and metal finishing industries (Reed et al., 1994; Spearot and Peck, 1984; Sricharoenchaikit, 1989) and the effluents from washing metal-contaminated soils and sludges (Abumaizar and Khan, 1996; Allen and Chen, 1993; Martin and Allen, 1996). The treatment methods depend greatly on the particular chelating agent and metals as well as their concentrations. In the case of dilute solutions (e.g., electroless plating copper rinse water), reverse osmosis, adsorption, and ion exchange could be applied (Fries and Chew, 1993; Haas and Tare, 1984; Reed et al., 1994; Sricharoenchaikit, 1989). Nevertheless, reverse osmosis has high operation and maintenance costs and is subject to fouling. Furthermore, activated carbon adsorption was not completely effective (Reed et al., 1994), although it was widely applied for the removal of organic contaminants. A series of work is being conducted in our laboratory to evaluate the possibility of the use of commercial ion exchangers for this subject, to obtain some fundamental information like equilibrium and kinetic data, and to develop subsequently the design equation of column operation. The polyacrylic weak-basic resins Amberlite IRA-68 were selected here for this purpose because they were screened to be promising for the removal of PbEDTA chelates (Dudzinska and Clifford, 1992). The aim * Author to whom correspondence should be addressed. E-mail:
[email protected].
of this paper was to examine the ion-exchange equilibria of metal chelates of EDTA with Amberlite IRA-68. All experiments were carried out at an equimolar solution of metals and EDTA. The isotherm equation used to describe equilibrium data was proposed on a macroscopic basis, and the temperature dependence of equilibrium constants of ion-exchange reactions was finally investigated. Experimental Section Resins and Reagents. The weak-base resin Amberlite IRA-68, purchased from Sigma Co., contained tertiary amine active groups. According to the manufacturer’s catalog, it had a capacity of 5.6 mequiv/g of dry resin and a moisture content of 60%. It was first screened and a particle size of 35-40 mesh was selected. Prior to use, it was washed with NaOH (1000 mol/m3) and HCl (1000 mol/m3) to remove organic and inorganic impurities and then was washed with deionized water (Millipore Milli-Q) three times. The resin was finally converted to the Cl- form by column flushing with 1000 mol/m3 HCl solution for 12 h and then being air-dried. Analytical reagent grade EDTA and other inorganic chemicals were obtained from Merck Co. The aqueous phase was prepared by dissolving equimolar metal sulfate and EDTA in deionized water, where the initial pH was adjusted to be in the range of 2-9 by adding a small amount of HCl or NaOH. The initial concentration of metals ranged from 1.57 to 6.82 mol/m3, which located within the levels of real effluents such as the electroless copper plating rinse water (Haas and Tare, 1984; Spearot and Peck, 1984). Ion-Exchange Experiments. In exchange experiments, an aliquot of dry resins (0.5 g) and 50 cm3 of an aqueous phase were placed in a 125-cm3 glass-stoppered flask and shaken at 110 rpm for 24 h using a temperature-controlled shaker (Firstek Model B603, Taiwan). Preliminary runs showed that the exchange reaction studied was complete after 12 h. After equilibrium, the pH was measured with a Radiometer pH meter (Model PHM82). The concentrations of Cl- ions were determined with an ion chromatograph (Dionex Model 2000) equipped with a conductivity detector. Here, a Dionex IonPac AS4A column (4 × 250 mm) was used, which
S0888-5885(97)00519-8 CCC: $15.00 © 1998 American Chemical Society Published on Web 01/16/1998
556 Ind. Eng. Chem. Res., Vol. 37, No. 2, 1998 Table 1. Stability Constants (log K) for Formation of Complexes from Metals and Ligands (L) at 298 K and Zero Ionic Strength (Morel and Hering, 1993)a metal
L ) OH-
L ) SO42-
L ) EDTA4-
H+
HL
14.00
HL
1.99
HL H2L H3L H4L H5L
11.12 17.80 21.04 23.76 24.76
Cu2+
CuL CuL2 CuL4 Cu2L2
6.3 11.8 16.4 17.7
CuL
2.4
CuL CuHL CuOHL
20.5 23.9 22.6
Co2+
CoL CoL2 CoL3
4.3 9.2 10.5
CoL
2.4
CoL CoHL
18.1 21.5
Ni2+
NiL NiL2 NiL3
4.1 9.0 12.0
NiL
2.3
NiL NiHL NiOHL
20.4 24.0 21.8
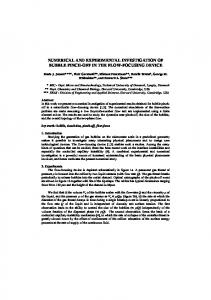
Figure 1. Distribution of the species in an equimolar solution of Cu(II) and EDTA at 298 K. [Cu2+] ) [EDTA] ) 0.01 mol/dm3.
a For example, K ) [M L H ]/[M]x[L]y[H+]z (in molar unit) for x y z complexation reaction xM + yL + zH S MxLyHz.
operated at a flow rate of 2 cm3/min with an eluant containing 0.75 mol/m3 of NaHCO3 and 2.2 mol/m3 of Na2CO3. The regenerant was 12.5 mol/m3 of H2SO4 and flowed at 3 cm3/min. The aqueous-phase concentration of metal chelates was analyzed using a GBC atomic absorption spectrophotometer (Model 932). Each run was duplicated under identical conditions. The resinphase concentration of metal chelates qe in mol/kg was obtained according to
qe ) V(C0 - Ce)/W
(1)
where C0 and Ce are the initial and equilibrium liquidphase concentrations of metal chelates, respectively, in mol/m3, V is the volume of the solution in m3, and W is the weight of dry resin used in kg. Results and Discussion Complex Equilibria in Metal-EDTA Systems. EDTA, a polyprotic acid, can exist in a number of protonated forms in the aqueous phase (Morel and Hering, 1993). Furthermore, it readily forms strong complexes with most metals in a 1:1 molar ratio. Table 1 lists the related stability constants at 298 K and zero ionic strength. Basically, the distribution of each species at different aqueous pH values can be obtained from a set of mass-balance equations. The results for an equimolar solution of Cu(II) and EDTA are shown in Figure 1. Here, the aqueous complexations of Cu(II) with sulfate anions are neglected because of their comparatively small stability constants, as shown in Table 1. It is found that the divalent species CuL2- dominates at pH 3-12 and the univalent species CuHL- at pH < 3, where L4- refers to the fully dissociated form of EDTA. Similar results are expected in the cases of Co(II) and Ni(II) chelates of EDTA since they have approximate stability constants (Table 1). Ion-Exchange Equilibria. Figures 2-4 show the pH dependence on the amount of exchange qe at different initial solute concentrations C0. It is evident that qe increases with increasing C0. Also, qe increases slightly with increasing the pH and reaches a plateau at an equilibrium pH greater than about 3. The same pH trend was actually observed for the exchange of Pb-
Figure 2. Effect of equilibrium pH on the amount of exchange of Cu-EDTA chelates.
Figure 3. Effect of equilibrium pH on the amount of exchange of Co-EDTA chelates.
EDTA chelates with several basic anion exchangers (Dudzinska and Clifford, 1992). In addition, Haas and Tare (1984) used Chelex-100 (Bio-Rad Laboratories), a chelating ion exchanger with iminodiacetic acid active groups, to recover metals from synthetic semiconductor
Ind. Eng. Chem. Res., Vol. 37, No. 2, 1998 557
Figure 4. Effect of equilibrium pH on the amount of exchange of Ni-EDTA chelates.
wastes containing mixtures of chelating agents such as EDTA, citrate, and tartarate. In a slightly different way, they indicated that a plot of the distribution ratio (defined as the ratio of the amount of exchange qe to the aqueous-phase equilibrium concentration Ce) vs equilibrium pH has an apparent maximum for each metal studied. It is known that the Amberlite IRA-68 resins contain tertiary amine (free base); the amine groups would react with HCl during the pretreatment process according to
R3N + HCl S R3NH+Cl-
Figure 5. Equilibrium isotherms for the exchange of Cu-EDTA chelates on Amberlite IRA-68. The solid curves are predicted by the Langmuir equation.
(2)
Because the divalent ML2- is the dominant species at pH 3-12, the exchange between ammonium groups of the resins and the chelate anions of divalent metals would be thus expressed as (Sricharoenchaikit, 1989)
ML2- + 2R3NH+Cl- S (R3NH+)2ML2- + 2Cl-, K1 (3) Thus, the low qe at low pH can be explained by a weaker electrostatic interaction between the ammonium groups of the resins and MHL- compared to ML2-, because the univalent MHL- dominates at pH < 3. In this instance, we have
MHL- + R3NH+Cl- S (R3NH+)MHL- + Cl-,
K2 (4)
On the other hand, a slight increase in qe by raising pH is likely a result of a higher binding with the resins (Clifford and Weber, 1983; Subramonian and Clifford, 1988). When the initial pH is above about 6 or more, it is expected that qe will drop because of the competitive reactions of OH- and the ammonium groups with metal chelate anions (Juang and Chen, 1996). This is not the case in this work, indicating a stronger affinity of ML2with the resins than that of univalent OH-. However, the ion exchange of OH- with Cl- of the resins does occur to some extent. This occurrence is experimentally supported that whether the aqueous phase is initially acidic or basic (pH 2-9), its pH is always less than 4.5 and decreases after exchange reactions. Macroscopic Exchange Equilibrium. Equilibrium isotherm, the relation between the amount of
Figure 6. Equilibrium isotherms for the exchange of Co-EDTA chelates on Amberlite IRA-68. The solid curves are predicted by the Langmuir equation.
exchange (qe) and the remaining concentration in the aqueous phase (Ce), is important to describe how solutes interact with the resins and so is critical in optimizing the use of the resins. Therefore, correlation of equilibrium data by either theoretical or empirical equation is necessary to practical operation. The equilibrium isotherms obtained at different pH values are shown in Figures 5-7. It is expected that the Langmuir equation can correlate the present data, which is given by
qe ) qmKLCe/(1 + KLCe)
(5)
where qm is the amount of exchange corresponding to a complete monolayer, KL is the Langmuir constant. Parameters KL and qm can be obtained from the plot of 1/qe vs 1/Ce (not shown). The solid curves in Figures 5-7 are predicted from the Langmuir equation. Table 2 lists the results obtained, together with the correlation coefficients. Evidently, the Langmuir fit is quite well (correlation coefficient r > 0.995). As is clearly shown in Table 2, both KL and qm increase with increasing aqueous pH. Under compa-
558 Ind. Eng. Chem. Res., Vol. 37, No. 2, 1998
Figure 7. Equilibrium isotherms for the exchange of Ni-EDTA chelates on Amberlite IRA-68. The solid curves are predicted by the Langmuir equation. Table 2. Parameters of the Langmuir Equation for the Exchange of Metal-EDTA Chelates on Amberlite IRA-68 at 298 K system Cu-EDTA Cu-EDTA Co-EDTA Co-EDTA Ni-EDTA Ni-EDTA
pH qm (mol/kg) KL (m3/mol) 3.1 3.5 2.6 3.5 2.6 3.5
0.40 0.43 0.39 0.53 0.38 0.45
11.3 13.7 3.04 3.15 5.12 5.28
RL
r
1.40 × 10⁻² 1.16 × 10⁻² 4.84 × 10⁻² 4.68 × 10⁻² 2.86 × 10⁻² 2.78 × 10⁻²
0.997 1.000 0.995 0.998 0.997 0.998
rable conditions, qm decreases in the order Co(II) > Ni(II) > Cu(II) of their EDTA chelates. For example, it is 0.53, 0.45, and 0.43 mol/kg at pH 3.5 and 298 K, respectively, which is far less than the resin capacity (5.6 equiv/kg). Such a trend is exactly reverse to the magnitude of stability constants of 1:1 metal-EDTA complexes (Table 1). This likely implies that the steric effect of the octahedral structure of metal-EDTA chelates plays a certain role in the present ion exchange processes (Inczedy, 1976). In practice, it was also reported that the equivalent fraction of exchange (that is, qm/resin capacity) of Pb-EDTA chelates on Amberlite IRA-68 increases with increasing pH and is less than 0.04 at pH < 7 (Dudzinska and Clifford, 1992). On the other hand, the Langmuir constant KL decreases in the order Cu(II) > Ni(II) > Co(II), indicating a more thermodynamically favorable process for exchange of the Cu-EDTA chelates. The essential feature of the Langmuir equation can be given in terms of a dimensionless separation factor, RL, defined as (Hall et al., 1966; Viraraghavan and Kapoor, 1994)
RL ) 1/(1 + KLC0)
(6)
where C0 is the highest initial solute concentration. The value of RL indicates the shape of the isotherm to be either unfavorable (RL > 1), linear (RL ) 1), favorable (0 < RL < 1), or irreversible (RL ) 0). In this work, the values of RL obtained are listed in Table 2. All ionexchange reactions under study show to be favorable, especially for the Cu-EDTA system. Microscopic Exchange Equilibrium. As indicated above, the exchange process predominantly follows
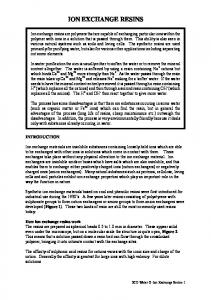
Figure 8. Effect of temperature on equilibrium constants for the exchange of metal-EDTA chelates on Amberlite IRA-68 at pH 3.3.
reaction eq 3 if the aqueous pH is greater than 3. The equilibrium constant can thus be written as
K10
)
a(R3NH)2MLaCl-2 aML2-aR3NHCl2
)
[(R3NH)2ML][Cl-]2γ(R3NH)2MLγCl-2 [ML2-][R3NHCl]2γML2-γR3NHCl2
(7)
where ai and γi denote the activity and activity coefficient of species i in the aqueous or the resin phases, respectively. Rearranging eq 7, the following equation can be obtained:
K10 ) K1Γ1
(8)
where K1 is the stoichiometric equilibrium constant based on the concentration scale:
K1 ) [(R3NH)2ML][Cl-]2/([ML2-][R3NHCl]2) (9) and Γ1 is the term containing all the activity coefficients. Although the thermodynamics-based value of K10 is a real equilibrium “constant” that can compare with the literature results (Hogfeldt, 1993), the simplification of the expression make it more suitable to practical use. As a reasonable assumption, the term Γ1 is expected to remain constant as long as the variations in the aqueous environment (pH, ionic strength, etc.) and in the resinphase concentrations are small (Cortina et al., 1993, 1994). As we will see below, such conditions are roughly fulfilled because the pH is kept nearly constant and the initial metal concentration is fixed and low enough ( Cu(II), but KL decreases in the order Cu(II) > Ni(II) > Co(II). Moreover, the apparent thermodynamic data of exchange reactions are equivalent for the three systems studied (Table 3). The present ion-exchange reactions are favored by entropy change but unfavored by enthalpy change. Acknowledgment
Figure 9. Effect of temperature on equilibrium constants for the exchange of metal-EDTA chelates on Amberlite IRA-68 at pH 2.6.
1.10, and 1.20 kJ/mol for the Cu-, Co-, and Ni-EDTA chelates, respectively. When the pH is less than 3, however, the univalent species MHL- dominates so the exchange reaction follows eq 4 and the stoichiometric equilibrium constant becomes
K2 ) [(R3NH)MHL][Cl-]/([MHL-][R3NHCl])
(11)
In a similar way, the temperature dependency of K2 at pH 2.4-2.7 is shown in Figure 9. The values of ∆H hence obtained are 1.73, 1.83, and 1.64 kJ/mol for the Cu-, Co-, and Ni-EDTA chelates, respectively (Table 3). The slightly positive ∆H can be understood because the conventional exchange or adsorption process corresponds to the results of two simple processes: (i) exchange of the molecules of solvent (water) previously adsorbed and (ii) exchange of the solute molecules. Each molecule of metal chelates has to displace more than one molecule of water. The net result corresponds to an endothermic process (Singh and Rawat, 1994). Table 3 also gives other thermodynamic data such as apparent Gibbs free energy change (∆G) and apparent entropy change (∆S), which are calculated as follows:
∆G ) -RT ln Kj
(12)
∆S ) (∆H - ∆G)/T The slightly positive ∆S confirms that exchange of the metal-EDTA chelates on IRA-68 is a combination of the two processes as described above. Under comparable conditions, it is seen that the thermodynamic data of
This work was supported by the Republic of China National Science Council under Grant No. NSC86-2214E-155-002, which is greatly appreciated. Nomenclature ai ) activity of species i Ce ) liquid-phase concentration at equilibrium (mol/m3) C0 ) initial liquid-phase concentration (mol/m3) ∆G ) apparent Gibbs free energy change (kJ/mol) ∆H ) apparent enthalpy change (kJ/mol) H4L ) ethylenediaminetetraacetic acid (EDTA) KL ) Langmuir constant (m3/mol) K1 ) exchange equilibrium constant defined in eq 3 (kg/ m3) K2 ) exchange equilibrium constant defined in eq 4 M ) metals (Cu, Co, and Ni) qe ) amount of exchange at equilibrium (mol/kg) qm ) amount of exchange in a complete monolayer (mol/ kg) R ) universal gas constant (J/mol‚K) RL ) separation factor defined in eq 6 r ) correlation coefficient ∆S ) apparent entropy change (J/mol‚K) T ) absolute temperature (K) V ) volume of the solution (m3) W ) weight of dry resins (kg) Greek Letter γi ) activity coefficient of species i Superscript 0 ) thermodynamic scale
Literature Cited Abumaizar, R.; Khan, L. I. Laboratory Investigation of Heavy Metal Removal by Soil Washing. J. Air Waste Manage. Assoc. 1996, 46 (8), 765-768.
560 Ind. Eng. Chem. Res., Vol. 37, No. 2, 1998 Allen, H. E.; Chen, P. H. Remediation of Metal Contaminated Soil by EDTA Incorporating Electrochemical Recovery of Metal and EDTA. Environ. Prog. 1993, 12 (4), 284-293. Clifford, D.; Weber, W. J., Jr. The Determination of Divalent/ Monovalent Selectivity in Anion Exchangers. React. Polym. 1983, 1, 77-89. Cortina, J. L.; Miralles, N.; Sastre, A. M.; Aguilar, M.; Profumo, A.; Pesavento, M. Solvent Impregnated Resins Containing Di(2,4,4-trimethylpentyl)phosphinic Acid. II. Study of the Distribution Equilibria of Zn, Cu and Cd. React. Polym. 1993, 21, 103-116. Cortina, J. L.; Miralles, N.; Aguilar, M.; Sastre, A. M. Solvent Impregnated Resins Containing Di(2-ethylhexyl)phosphoric Acid. II. Study of the Distribution Equilibria of Zn, Cu and Cd. Solvent Extr. Ion Exch. 1994, 12 (2), 371-391. Dudzinska, M. R.; Clifford, D. A. Anion Exchange Studies of LeadEDTA Complexes. React. Polym. 1992, 16, 71-80. Fries, W.; Chew, D. Get the Metal Out! CHEMTECH 1993, 23 (2), 32-35. Haas, C. N.; Tare, V. Application of Ion Exchangers to Recovery of Metals from Semi-conductor Wastes. React. Polym. 1984, 2, 61-70. Hall, K. R.; Eagleton, L. C.; Acrivos, A.; Vermeulen, T. Pore and Solid Diffusion Kinetics in Fixed Bed Adsorption under Constant Pattern Conditions. Ind. Eng. Chem. Fundam. 1966, 5, 212-223. Hogfeldt, E. A Three-Parameter Model for Summarizing Data in Ion Exchange. In Ion Exchange and Solvent Extraction; Marinsky, J. A., Marcus, Y., Eds.; Marcel-Dekker: New York, 1993; Vol. 11, pp 109-150. Inczedy, J. Analytical Applications of Complex Equilibria; Ellis Horwood: Chichester, U.K., 1976; pp 67-74.
Juang, R. S.; Chen, M. N. Measurement of Binding Constants of Poly(ethylenimine) with Metal Ions and Metal Chelates in Aqueous Media by Ultrafiltration. Ind. Eng. Chem. Res. 1996, 35 (6), 1935-1943. Martin, S. B.; Allen, H. E. Recycling EDTA after Heavy Metals Extraction. CHEMTECH 1996, 26 (4), 23-25. Morel, F. M. M.; Hering, J. G. Principles and Applications of Aquatic Chemistry; Wiley: New York, 1993; pp 332-343. Reed, B. E.; Arunachalam, S.; Thomas, B. Removal of Lead and Cadmium from Aqueous Waste Streams Using Granular Activated Carbon Columns. Environ. Prog. 1994, 13 (1), 60-64. Singh B. K.; Rawat, N. S. Comparative Sorption Equilibrium Studies of Toxic Phenols on Flyash and Impregnated Flyash. J. Chem. Technol. Biotechnol. 1994, 61, 307-317. Spearot, R. M.; Peck, J. V. Recovery Process for Complexed CopperBearing Rinse Waters. Environ. Prog. 1984, 3 (2), 124-128. Sricharoenchaikit, P. Ion Exchange Treatment for Electroless Copper-EDTA Rinse Water. Plat. Surf. Finish. 1989, 76 (12), 68-70. Subramonian, S.; Clifford, D. Monovalent/Divalent Selectivity and Charge Separation Concept. React. Polym. 1988, 9, 195-209. Tunay, O.; Kabdasli, I.; Tasli, R. Pretreatment of Complexed Metal Wastewaters. Water Sci. Technol. 1994, 29 (9), 265-274. Viraraghavan, T.; Kapoor, A. Adsorption of Mercury from Wastewater by Bentonite. Appl. Clay Sci. 1994, 9, 31-49.
Received for review July 18, 1997 Revised manuscript received October 24, 1997 Accepted November 25, 1997 IE970519C