Abstract. In this work we present a numerical investigation of experimental results obtained for bubble pinch- off in a microfluidic flow-focusing device [1,2].
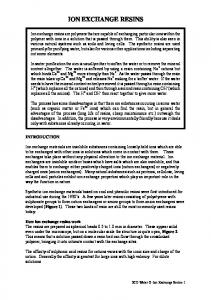
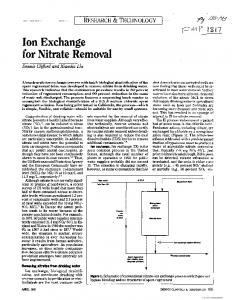
NUMERICAL AND EXPERIMENTAL INVESTIGATION OF BUBBLE PINCH-OFF IN THE FLOW-FOCUSING DEVICE Mads J. Jensen*, ***, Piotr Garstecki**, Michael Fuerstman**, Henrik Bruus*, George M. Whitesides**, and Howard A. Stone*** * MIC - Dept. Micro and Nanotechnology, Technical University of Denmark, Lyngby, Denmark ** Dept. Chemistry and Chemical Biology, Harvard University, Cambridge, USA *** DEAS - Division of Engineering and Applied Sciences, Harvard University, Cambridge, USA Abstract In this work we present a numerical investigation of experimental results obtained for bubble pinchoff in a microfluidic flow-focusing device [1,2]. The numerical simulations of the free-surface problem are made assuming a low Reynolds-number flow and are implemented using a finite element solver. The results are used to study the dynamics near pinch-off, the size of the bubbles, and the overall topology of the two-phase flow. key words: bubble, simulation, pinch-off, flow-focus 1. Introduction Studying the generation of gas bubbles on the micrometer scale in a predefined geometry makes it possible to investigate many interesting physical phenomena and to design new technological devices. The flow-focusing device [1,2] enables such a studies. Among the many kinds of questions that can be studied, there has been recent work on the interface instabilities and especially the controlled capillary instability [4]. A combined experimental and numerical investigation is a powerful source of increased understanding of the basic physical phenomena involved, and hence motivates the present numerical study. 2. Experiments The flow-focusing device is depicted schematically in figure 1a. A pressured gas thread of pressure p is focused into the orifice by two liquid streams (with flow rate Q). The gas thread breaks periodically to release bubbles into the outlet channel. Optical micrographs of the pinch-off event are shown in figure 1b together with fits of the tip shape. The orifice has typical dimensions ranging from 30 to 120 µm and the height of the channel is 28µm. We find that i) the volume Vb of the bubbles scales with the flow-rate Q and the viscosity µ of the liquid, and the pressure p of the gas stream as Vb ∝ p/Qµ (figure 2b), ii) the rate at which the diameter of the gas thread decays in time during a single breakup event is linearly proportional to the flow rate Q of the liquid and is independent of viscosity and surface tension. The first observation leads to the ability to control the size of the bubbles (∝ p/Q) independently of the volume fraction of the dispersed phase (∝ pQ). The second observation forms the basis of a controlled capillary instability mechanism [4], in which the rate of collapse of the unstable thread is greatly slowed down by the effect of confinement of the orifice: relaxation of the surface energy proceeds at the rate of supply of the continuous fluid.
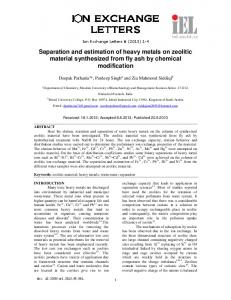
3. Numerical model In the numerical model we assume the flow to be in an axisymmetric geometry. Even though the geometry of the flow-focusing device is full 3D we are confident that we capture the essential physics of the gas bubble formation. The numerical model uses the commercial software FemLab [3] in a novel way together with an in-house interface update routine programmed in MatLab. We solve the Stokes equation in cylindrical coordinates (we assume low Reynolds-number flow) while accounting for the full geometry of the device including interface, walls, inlets, and symmetry boundaries (see figure 2). At the location of the free surface the normal and tangential stress conditions are enforced including the contribution of a pressure jump associated with surface tension at the curved interface. The solver returns a velocity field at the interface, which is in turn used to evolve the interface in the normal direction using a second-order Runge-Kutta time step.
4. Results and discussion A typical numerical result is shown in figure 2, which illustrates the time features of the shape evolution of the liquid-gas interface prior to pinch-off of a gas bubble (see figure 1b). The small circles on the figure show the location of the minimum thread diameter. The numerical results capture all of the topological features of the liquid-gas interface that were observed experimentally (figure 2a). Moreover, a preliminary investigation show that the size of the created bubbles scale correctly with flow rate Q, pressure p, viscosity µ, and the length of the orifice (see figure 2b). As the simulations are very time-consuming (about 48h for a single run) the correct geometry and a full parameter analysis has not yet been performed. In addition, we are studying the evolution of the drop size as the different parameters are varied. 5. Conclusion A numerical model simulating the liquid-gas flow in the flow-focusing device has been implemented. The preliminary results show good agreement with experimental data. The overall topology of the flow is consistent and preliminary results show agreement in the scaling laws of the bubble volume Vb and the thread collapse rate. More simulations are needed for a complete parameter analysis. References [1] S. L. Anna, N. Bontoux, and H. A. Stone, App. Phys. Lett. 82, 364 (2002). [2] Formation of mono disperse bubbles in a microfluidic flow-focusing device, P. Garstecki, I. Gitlin, W. DiLuzio, E. Kumacheva, H. A. Stone, and G. M. Whitesides (submitted). [3] www.comsol.com [4] Controlled capillary instability, P. Garstecki, H. A. Stone, and G. M. Whitesides (submitted).
a)
b)
Figure 1: a) Schematic representation of the microfluidic flow-focusing device. The channels are made as of PDMS. In all the experiments the liquid width is wl = 250 µm and the gas width is wg = 200 µm. The width of the orifice wor is between 30 and 120 µm and the width of the outlet wout is between 250 and 1000 µm. The height h of the channel is 28 µm in all tested devices. b) Left: Optical micrograph of the tip of the gas stream as it approaches and passes through the orifice (compare to figure 2). The graphs on the right represents are contours of the gas-liquid interface extracted from the micrographs.
a)
b)
Q Figure 2: a) Simulation of the time evolution of the liquid-gas interface at dimensionless times t=0.25 to 4.25. The end time corresponds to the computation step just before pinch-off. The dimensionless gas pressure is p* = p/u2ρ and the inlet liquid flow rate Q. The dots on the final interface correspond to the discretizeation of the interface. The small circles show the evolution of the position of the minimum gas-thread diameter. b) Experimental dependence of the volume of the bubble Vb on the gas pressure p, the flow rate Q, and the viscosity µ. For a critical value of Qµ the bubble size bifurcates into a period-two dependence: one large bubble one small bubble etc.