International Journal of Business and Social Research Volume 04, Issue 12, 2014
Islamic vs. Conventional Banking Role in Non-Oil Growth: A Causal Analysis in the Case of Bahrain Abdellah Belhadia1 and Nawal Belbouab2 ABSTRACT This paper aims to investigate the type of relationship between Islamic vs. Conventional banking and non-Oil economic growth in the case of Bahrain by using annual data 1990-2012 retrieved from Islamic banks and financial institutions information (Ibis-Online) of the Islamic Bank of Development (IDB), World Bank development indicators (WB), and the Central Bank of Bahrain (CBB) annual reports.This study employs the Johansen and Juselius Cointegration test and Vector Error Correction Model (VECM) as well as Vector Autoregressive model (VAR) to reveal the long run and short-run causality between the dual banking development and non-Oil GDP growth. The VECM results of the conventional banking show that there is long-run bidirectional causality between all the conventional banking selected indicators and the non-Oil GDP. For the Islamic banking VAR model, there is a unidirectional causality from Islamic banking indicators to the non-oil GDP. There is no evidence on the role of non-oil GDP on the Islamic banking development. Impulse response functions in the two models shows that through one standards deviation positive shock in Islamic vs. Conventional Credit provided to private sector, the non-Oil GDP will be much higher in the next five years if we stimulate the Islamic credit provided to private sector than the conventional banks.Moreover, the Islamic credit provided to the private sector appears to be more procyclical than the credit provided by the conventional banks. However, the fluctuations in the conventional credit are sharper than the Islamic banks’ private credit. This study provides the policy makers in Bahrain with the appropriate evidences to design their policies in fostering the non-Oil sector. Keywords: Bahrain, cointegration, finance-growth nexus, granger causality, VAR, VECM. JEL Codes: E44, O11, O16, O53. Available Online: 29th December, 2014. MIR Centre for Socio-Economic Research, USA.
1.0
INTRODUCTION
There are several hypothesis tried to provide a realistic analysis in explaining the relationship between the financial intermediation development and economic growth in the long run. In this paper we will 1Abdellah
Belhadia, Senior Lecturer, Business and Economics Department. Modern College of Business and Science, Saltanate Oman, Muscat. Email :
[email protected] 2Nawal Belbouab, PhD Candidate, Commercial Sciences Department, Algiers University III. Email:
[email protected] http://www.thejournalofbusiness.org/index.php/site
Belhadia and Belbouab, IJBSR (2014), 04(12): 01-15
tryto discuss the existing literatures. We can summaries the different opinion in four main categories; the first group of economist believes that the financial and banking deepening is considered to lead the development in the real sector realized in the economic growth in the long-run, this hypothesis is called Leading-supply hypothesis.The second group argued that the developments in the real sector is the main motivator to push the financial and banking institutions to improve their banking and financial services and provide the appropriate package of financial and banking product to fulfill the real sector requirements, this was known as Following-demand hypothesis.In the other side, there is a range of economist who suggested that the relationship between the financial sector and economic growth is bi-directional, which means the existence of double side causality. The extremist opinion was represented in the fourth category, academicians who believe that the financial development has no impact on the economic growth; in contrast it could harm the development in the real sector in some circumstances(HerveHannoun, 2008).Despite their many research was done to investigate the relationship between the conventional financial development and economic growth, there are few studies they focused on the impact or causality of a dual financial system on the non-resources based economic growth. The uniqueness of this paper is the use of new Islamic financial development indicators as proxies of the depth of the Islamic Financial System. The second uniqueness of this paper comes in using the non-resources based economic growth as aproxyof the non-oil economic growth in Bahrain. The reminder of this paper is organized as follow; Section II makes a review of the existing literatures that explains the causal relation between economic growth and financial development indicators. Section III discusses data and methodology used to investigate the causal relation in the case of Bahrain. Section IV covers the main results and finding. Section V concludes with policy implications.
2.0
LITERATURE REVIEW
2.01
SUPPLY-LEADING HYPOTHESIS
Is called also the external financial development (Franklin, Santomero, 2001,2008), it explained the phenomena where the existence of financial institutions and supply of financial assets and financial products related to it were setup before requested by the real sector, which means that financial development leads the economic growth, this hypothesis is widely accepted by economist, the main idea is that the well-developed financial sector will provides a crucial functions through reducing information and transaction costs (Allen .F .Gale D, 1997), there are a lot of literatures that explained how could the well-developed financial intermediation to reduce these costs and increasing saving, investment decisions and the technological innovation and as consequence the economic growth.(Levine, 1997)suggested that in order to well understand the finance-growth nexus, a functional approach should be considered, this approach focuses on the linkage between the key functions provided by the financial system and the economic growth. The other approaches in explaining the finance-growth nexus focused more on the monetary aspects of the financial and banking system, in their contributions, (John Gurley, 1955) (James Tobin, 1965), (Renald McKinnon, 1973) they focused in their mathematical as well as the theoretical explanation on money, this narrow focusing on money could limit the understanding the finance-growth nexus. Innovative Power of Credit There is no doubt that the first contribution in this area belong to Schumpeter, he considered that financial services is in origin of the economic growth (Hendrik Hakenes, 2004), according to Schumpeter, the production process needs credits, so the main idea is that you cannot be an entrepreneur without being debtor for a while. From the Schumpeter’s point of view, the entrepreneur couldn’t realize his project without securing the required funding to materialize his technology in a new project (Schumpeter, Joseph, 1934). He considered that the main role of banks is to create money for the innovative entrepreneurs; because the innovation came by individuals they don’t have means of http://www.thejournalofbusiness.org/index.php/site
2
Islamic vs. conventional banking...
productions, he mentioned that if the existing companies will materialize the new innovation, there will be no role for banks, but when the innovation came basically from individuals they don’t have means of production, the money bank will be the tool through which the banks could control the means of production by take it away from the existing companies and provide it to the new entrepreneurs to achieve their innovative projects(Giancarlo Bertocco,2008) .With the absence of the money created by banks there will be no space for the new entrepreneurs to achieve their project because the new innovation will be financed by the effective saving but by using the expected saving3 (Laurence, 1999). Because the existing companies they would continue using resources in the traditional production process, and there is no reason for them to allocate the resources for the new entrepreneurs who would change the existing production equilibrium. Many economists in Europe were convinced by this point of view which leads to arise many theories that give the leading role to the banking and financial system.(Tobin, 1965), for example, support the non-neutrality of money from the economic activity, he argued that the increase in the money supply will decrease the cost of funding which will affect positively the accelerator effect.(Fisher, 1997) see that the relationship between financial and economic development exists only in the long term, he argued that the spread of banking practices has a positive impact on money and current deposits velocity that has a positive impact on economic activity (Ibrahim Omar, 2007). However, the most modern approaches that explained the impact of monetary variables on the real sector is running through bank credit channel or so called banks’ balance sheets (Bernanke, 1995,2008) Financial Intermediation Functions for the Economic Growth In his attempting to organize the literature related to Finance-Growth nexus, (Levine, 2004) distinguished five main functions of financial intermediation which each one has an impact on economic growth in the long-run: -
Facilitating trade, Hedge and risk diversification. Allocation of resources Monitoring managers and establishing corporate governance. Collect saving Facilitating exchanging goods and services
He demonstrated the existence of two main channels where each function of the previous could affect the economic growth; capital accumulation and technological innovation. Regarding the first channel, banks and financial institutions could maximize capital accumulation by increasing saving and allocating saving to the productive projects. Regarding the second channel, technological innovation that was a focus subject by the second generation of economic growth models, the financial and banking intermediation could contribute by providing funds to these projects. The incentive growth models focus on high-tech, they didn’t consider the innovation as public good could be provided free of charge, scientific knowledge is not subject of diminishing returns law because the returns from high=tech will not decrease by increasing its accumulation. 2.02
DEMAND-FOLLOWING HYPOTHESIS
Is called also the internal financial development, is referring to the phenomena where the existence of financial institutions and supply of financial and banking services as response of demand by investors and savers, then the financial development is part of the economic development in other word the developments in financial and banking institutions id following the economic development. The pro economist for this theory believes that the financial development is a positive function in the real wealth (Khalid Al-Qadir, 2004). (Robinson, 1952)has stated this hypothesis is one sentence: ‘when the projects lead, finance follows’. He considered that finance and banks appear only as a response of economic agent’s internal demand.
3
For more in this role see (David R, 2008)
http://www.thejournalofbusiness.org/index.php/site
3
Belhadia and Belbouab, IJBSR (2014), 04(12): 01-15
Growth affects risk management and information production functions The increase in economic growth rates will push economic agents to ask for more intermediaries’ financial services, especially those services related to information production function in order to bridge the asymmetric information. Knowing that during economic upturns, the Adverse Selection risk rises, the entrepreneurs will be more risky during economic upturns, during these periods, banks and financial institutions increase their efforts to collect information in order to be able to distinguish among the good and bad debtors.In the other side, during the economic slowdown, Moral Hazard risk increases and adverse selection decreases. That will change the structure of information production for the banking and financial intermediaries, they will double their efforts in the delegated monitoring4 in order to follow the agreed funded projects5. The main idea here is that the function of producing and collecting information of the banking and financial intermediaries is following the status of the economic activity in the real sector. The other argument is that the initial wealth of the debtors and the guarantees that they could provide it will contribute in decreasing asymmetric information effects in the banking credit market, which will save a lot of banking and financial costs related to information production(Marc Hay, 2004). What growth is providing for banking and financial intermediation There is no doubt that the banking and financial system is affected by the changes occurring the real sector, changes in communication, computers, non-financial sector policies and the economic growth affect the financial and banking services as well as the financial structure. For example, the changes in high-tech work to decrease the transaction cost and facilitate financial arrangements (Merton, 1992). In the other side, the economic growth affects the investors and savers willingness to pay the participation cost in the financial and banking system (Greenwood & Jovanovic, 1990). In general, the GDP per capita could affect the financial and banking intermediation through different channels: -
-
-
2.03
In the High- Income countries, it appears to have big companies; the net assets for the big companies will decrease monitoring costs, which leads to decrease intermediation costs (External Finance Premium) which will result in supporting financial and banking intermediation. It is observed that the increase of GDP per capita is accompanied by high amount of public goods, which facilitate and help the financial and banking intermediation to perform efficiently such as the accounting standards, the legal framework. Huge number of companies with high level of net assets will allow stock markets to get more space in financing the real sector in the aim to provide liquidity to the small and mid savers, which will support the development of these markets. BI-DIRECTIONAL CAUSALITY HYPOTHESIS
A third hypothesis in explaining the causality between the financial, banking development and economic growth focused on the Bi-directional causality, and the type of causality depends on the stage of economic development (Ali Ahmad, 2004), during the low income periods, financial and banking development will lead the economic growth and support it until it reaches its regular levels, and during the late stages of economic development, this latter will lead the financial and banking development. (Robinson,1979) has mentioned this bidirectional causality between financial and economic development. Regarding the first direction from Finance to economic growth; he argued that the company needs to a funding based on the bank credit, later when the project earn profits, it will be provided for the company to issue shares or bonds to pay its financial commitments.The second concept of causality from economic growth to finance as follow; when the investment increases, it will 4
For more about the role of Banks in delegated monitoring see (DiamonDybvig, 1996) and (HandrikHakenes, 2004). For more about asymmetric information and the role of banks to bridge the gap see (Franklin A, A Santomero, 2001) and (Bert Scholltens, Dick Wensveen, 2000,2003) 5
http://www.thejournalofbusiness.org/index.php/site
4
Islamic vs. conventional banking...
lead to more bank credit required from the banking system, which will result in an increase in bank deposits that could help the banks to create more money required for the new projects.This bidirectional causality of Finance-Growth nexus will lead us to conclude that Schumpeter was right is his theory (Robert G, R. Levine, 1993). Direction of causality during development’ stages (Greenwood, Jovanovic, 1990)confirmed that during the early stages of development, the economic growth is weak and the trading process is unorganized, but when the national income increases, the financial structures start taking in a good positions, economic growth speed-up, but the inequality among individuals’ increases in the same time.In the other side, during the late stage of economic development, there will be well-organized financial arrangements with a stable mechanism of wealth distribution with high level of economic growth in comparison with the early stages of developments. Verse versa, whenever the financial development could support growth, this latter will be able to reinforce the financial system whole performance. Threshold effect in bidirectional causality Another approach to understand the Finance-Growth nexus is to take in consideration the Threshold effect, starting from a certain level of financial and banking development, the economic growth will be more slowly and the possibilities to catch-up will be very difficult and the poverty trap start to appear (Berthemelemy, 1995). The weak economic growth leads to more weaknesses in the financial and banking sector which its return to weaken the economic growth. This could be described by pernicious feedback loop between the real sector and financial sector. This happens usually during the financial crisis, when the public policies fail to face the uncertainties in the business environment. Financial assets drop down, household wealth decreases, which leads to drop in the consumption. Businessmen postpone their projects; a wide credit crunch will result in creating pressures on household consumption, investment and economic growth.
3.0
DATA AND METHODOLOGY
3.01
DATA
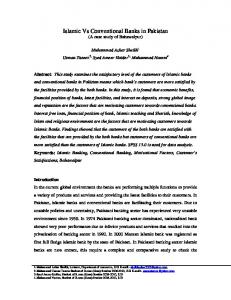
In line with the main purpose of this paper which is to investigate the long term and short term causality between a dual banking system development and non-oil economic growth for Bahrain, the selection of proxies to both dual banking sector development and non-Oil economic growth are very crucial. By reviewing the previous literatures, the majority of them use GDP to measure the economic growth either via GDP per capita or using the real GDP growth. However for the case of the resources based economies, using the total GDP as a proxy of the economic growth could alter the causality between banking development and economic growth. (Bekaert and Harvey, 1998) suggested that studies of finance-growth relationship in resource-based economies should focus on non-resource growth rather than total GDP, because windfall resource revenues affect the latter. The uniqueness of this paper is representedin using new indicators of Islamic financial development suggested by (Laurent Gheeraer, 2014). In our study we will use the Non-Oil GDP as defined by the IMF; Non resource GDP is approximated by subtracting the real values of natural resources rents from total GDP in 2005 adjusted USD (Hamilton and Ruta, 2008).Natural resources give rise to rents because they are not produced; in contrast, for produced goods and services competitive forces will expand the supply until economic profits are driven to zero. An economic rent represents an excess return to a given factor of production (RabahArezki et al., 2011). Meanwhile, the selection of proxies for financial development was a subject for big divergence among the empirical studies. In this study we will use the following proxies for the dual banking sector variable 6 (Laurent Gheeraer, 2014):
6
For more about financial intermediation measurements, see (Gunther Capelle-Blancard and al,2008)
http://www.thejournalofbusiness.org/index.php/site
5
Belhadia and Belbouab, IJBSR (2014), 04(12): 01-15
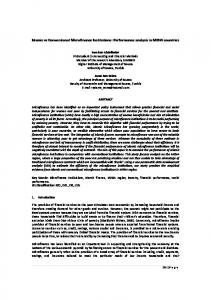
1. IFassets: it measures the part of Sharia-compliant assets in the contrary total, measures the penetration of Islamic banking in the overall banking system, this measure is not directly available in the database, and it is calculated.The Islamic penetration in assets in the country, expressed in percentage, is computed as: IFassets = Assets (IF) / Assets (total). Here Assets (IF) is the total sharia-compliant banking assets in US dollar (available in Ibis Online). And Assets (total); are the total naming assets (Islamic and conventional) in UD dollar (available from the world development indicators and the Central Bank of Bahrain annual reports) 2. IFdeposits: it measure the penetration of Islamic deposits in the banking system, is computed in a similar way using the same sources in the previous indicator: IFdeposits =deposits (IF) / deposits (total). Heredeposits (IF) are the total sharia-compliant banking deposits in US dollar (available in Ibis Online). Anddeposits (total); are the total naming deposits (Islamic and conventional) in UD dollar (available from the world development indicators and the Central Bank of Bahrain annual reports). 3. IF private: it measures the size of Islamic private credit relative to the domestic economy: PC/ GDP (IF) = PC(IF) / GDP HerePC (IF) is the amount of sharia-compliant private credit in US dollar. For PC (IF) is not available in any database, but is approximated by: PC (IF) = IFassets * PC (total). Where PC(total) is the total private credit in US dollar and IF assets is the Islamic penetration in banking assets defined as above. Unfortunately we don’t have a measure for Islamic credit penetration; we assume in this paper that Islamic assets penetration is a good approximation for Islamic private credit penetration. 4. Assets: it measures the part of conventional assets in the contrary total, measures the penetration of conventional banking in the overall banking system, this measure is not directly available in the database, and it is calculated by subtracting the Islamic penetration in assets in country. 5. Deposits: it measures the part of conventional deposits in the contrary total, measures the penetration of conventional banking in the overall banking system, this measure is not directly available in the database, and it is calculated by subtracting the Islamic penetration in deposits in country. 6. Private: it measures the part of conventional private credit in the contrary total, measures the penetration of conventional banking in the overall banking system, this measure is not directly available in the database, and it is calculated by subtracting the Islamic penetration in private credit in country. Figure 1
3.2E+10
60
2.8E+10
50
2.4E+10
40
2.0E+10
30
1.6E+10
20
1.2E+10
10
8.0E+09
0
4.0E+09
-10
0.0E+00
-20 90
92
94
96
98
00
02
04
Non-Oil GDP Oil and Gas USD GDP (current US$)
http://www.thejournalofbusiness.org/index.php/site
06
08
10
12
90
92
94
96
98
00
02
04
06
08
10
12
Conventional Private Credit % Islamic Private Credit PC(IF) % GDP
6
Islamic vs. conventional banking... 160
160
120
120
80
80
40
40
0
0
-40
-40
-80
-80 90
92
94
96
98
00
02
04
Conventional Assets % IFpen (Assets) %
3.02
06
08
10
12
90
92
94
96
98
00
02
04
06
08
10
12
Conventional Deposits % IFpen (Deposits)
METHODOLOGY
In order to determine the relationship between financial development and non-resources GDP,the econometric technique that we will use consists of three phases: first we have to check whether the time series are stationary or not, in o model for a correct evaluation, time series should be separated from all effects, and the series should be stationary. Thus logarithms of time series were taken. Augmented Dickey Fuller (1981) test was used. After that, Johansen Cointegration test was used to investigate the long-run relationship between financial development and non-resources GDP. If the Johansen Cointegration test was positive, then we have to apply the Vector Error Correction Model (VECM). But if the Johansen test was negative means there is no Cointegration between the variables, we have to apply unrestricted Vector Autoregressive (VAR) Model. We use Eviews 8 software to test and analyze the results. 1. Unit Root Test We used the Augmented Dickey Fuller test. In ADF test, we test the null hypothesis that the series are not stationary (there is unit root), against the alternative one that the series are stationary by calculating the ADF t-statistics value with the critical t-statistics value obtained from McKinnon’s table. If the series appears to be non-stationary, then we have to run the test again using the first or the second difference until stationary is achieved. 2. Johansen test for Cointegration The Johansen approach developed by Johansen and (Jesulius, 1990) and (Johansen, 1991) used to investigate the possible long-run relation existence between the study variables. Johansen approach uses two test statistics, as suggested by (Johansen, 1988) and (Oseterwald-Lenum, 1992) to determine the number of co-integrating vectors. These are the trace test and the maximum Eigenvalue test, represented by equation (3) and (4).
Here λ is the estimated values of the characteristic roots in assuming that the series are I (1). This number of observations and r, is the rank of the vector matrix. We test the null hypothesis of Trace test that there is at most (r) co-integrated relation against the alternative one that there are more than (r) co-integrated relations. In other words, a rejection of the null hypothesis means that there are more than (r) co-integrated relations. The Trace test rejects the null hypothesis if the trace statistics exceeds the critical value. On the other hand, we test the null that http://www.thejournalofbusiness.org/index.php/site
7
Belhadia and Belbouab, IJBSR (2014), 04(12): 01-15
there is (r) co-integrated relation versus (r+1) co-integrated relations. The test rejects the null hypothesis if the Eigenvalue test statistics exceeds the respective critical value. If the null hypothesis for both statistics is rejected, this indicates that there is one co-integrated relation among the variables under testing.
4.0
RESULTS AND DISCUSSION
Unit root test Results from ADF test implemented to the selected time series show that all the series belong to nonOil growth and financial development proxies are not stationary at level. So we run the ADF test again but this time by using the first difference. ADF results are shown in Table 1; from this table, we conclude that all series are stationary at the first difference at 1%, 5%, 10% level of significant. For PRIVATE for example, the P (value) before the first difference is 8.05%, which more than 5%, so we cannot reject the null hypothesis of ADF test.But after the first difference the P (value) become 4.53 % which is less than 5%, so we can reject the null hypothesis of ADF test. The rejection of the null hypothesis indicates that all the variables are stationary after the first difference. Table 1: Unit Root Test Unit root test Level 1 Variables IFassets IFdeposits IFprivate Assets Deposits Private GDP
ADF test 1st difference
t-statistics P (value) -0.492064 (0.4906) -0.205014 (0.6004)
t-statistics P (value) -3.995555 (0.0304) ** -4.170479** (0.0223)
-1.110732 (0.2331) -1.197085 (0.2040) -3.376317 (0.0805) -2.328510 (0.4029)
-3.995555*** (0.0304) -4.170479** (0.0223) -3.768075** (0.0453) -4.418340** (0.0117)
Level 1
Phillips-Person Test 1st difference
t-statistics P (value)
t-statistics P (value)
*, **, *** Significant at 1%, 5%, 10% level respectively
Johansen Co-integration Test The number of optimum lags used for the Cointegration model is selected by VAR lag Order selection criteria, which is based on AIC and SC. For the Islamic Banking Model we selected lag 1 to be used in Johansen and in VAR/VECM later. Regarding the conventional banking model we selected lag 2 according to AIC/SC criteria, VAR Lag Order Selection Criteria Endogenous variables: GDP IFASSETS IFDEPOSITS IFPRIVATE Exogenous variables: C Date: 08/07/14 Time: 03:01 Sample: 1990 2012 Included observations: 21 Lag
LogL
LR
FPE
0 1 2
-707.3505 -651.6800 -639.9586
NA 3.11e+24 84.83114* 7.38e+22* 13.39590 1.35e+23
http://www.thejournalofbusiness.org/index.php/site
AIC
SC
HQ
67.74766 63.96953* 64.37701
67.94662 64.96431* 66.16762
67.79084 64.18542* 64.76562 8
Islamic vs. conventional banking...
VAR Lag Order Selection Criteria Endogenous variables: GDP ASSETS DEPOSITS PRIVATE Exogenous variables: C Date: 08/07/14 Time: 03:04 Sample: 1990 2012 Included observations: 21 Lag LogL LR FPE AIC 0 -704.2196 NA 2.31e+24 67.44949 1 -650.0112 82.60327 6.29e+22 63.81059 2 -606.9672 49.19309* 5.85e+21* 61.23498*
SC HQ 67.64844 67.49266 64.80537 64.02648 63.02559* 61.62358*
- Co-integration in Islamic Banking Model Table 2 shows the results of Johansen test for a long relationship between Islamic Banking indicators and non-Oil economic growth. Table 2: Johansen test results for the Islamic Banking Model Cointegration Hypothesis Null Alternative
Trace statistics 30.44 17.53 6.25
None At most 1 At most 2
Critical values (5%) 47.85 29.79 15.49
MaxEigenvalue 12.90 11.28 6.14
Critical values (5%) 27.58 21.13 14.26
From table 2, the results from the first row show that the eigenvalue of test statistics (30.44) is less than the critical value at 95% confidence level (47.85). This confirmed that the null hypothesis is accepted. The null hypothesis indicates that there is no Cointegration relationship between Islamic Banking indicators and non-Oil economic growth in Bahrain. The same results are conformed by using Max-Eigen value. This Cointegration outcome indicates that we can run only VAR model not VECM. - Co-integration in Conventional Banking Model Table 3 shows the results of Johansen test for a long relationship between Conventional Banking indicators and non-Oil economic growth. Table 3: Johansen test results for the conventional Banking Model Cointegration Hypothesis Null Alternative
None At most 1 At most 2 At most 3
Trace statistics 96.52 44.72 12.48 4.83
Critical values (5%) 47.85 29.79 15.49 3.84
MaxEigenvalue 51.79 32.24 7.64 4.83
Critical (5%) 27.58 21.13 14.26 3.84
values
From table 3, the results from the second row show that the eigenvalue of test statistics (44.72) is more than the critical value at 95% confidence level (29.79). This confirmedthat the null hypothesis is rejected. The rejection of thenull hypothesis indicates that there are two Cointegration relationships between conventional Banking indicators and non-Oil economic growth in Bahrain. The same results are conformed by using Max-Eigen value. This Cointegration outcome indicates that we can run only VECM not VAR model. Causality Test Results Based on VECM in the Conventional Banking Model Table 4: Causality Test Results Based on VECM Dependent Lagged
ΔGDP Coefficient. P-Value ()
ΔAssets Coefficient. P-Value ()
http://www.thejournalofbusiness.org/index.php/site
ΔDeposits Coefficient. P-Value ()
ΔPRIVATE Coefficient. P-Value () 9
Belhadia and Belbouab, IJBSR (2014), 04(12): 01-15
ECT 1 ECT 2 DGDP (-2) Chi-square (P-Value) DAssets(-2) Chi-square (P-Value) DDeposists(-2) Chi-square (P-Value) DPRIVATE(-2) Chi-square (P-Value) R2 F-Statistics P-value F-ARCH test JB Normal Breusch-Godfrey
-2.80 (0.01380)* 3.24 (0.0467)
5.96 (0.2764) -8.30E-08 (0.0359) *
-18.66 (0.0393) * 7.17 (0.1121)
10.97759 (0.0087) -11.49706 (0.0173) *
-
5.723904 (0.0572)
8.282764 (0.0159) *
13.58772 (0.0011) *
5.458799 (0.06553)
-
1.504155 (0.4714)
2.21055 (0.3640)
8.491897 (0.0143) *
6.406112 (0.0406) *
-
11.71175 (0.0029) *
10.72251 (0.0047) * 0.87453 7.096654 0.003481 0.422816 (0.5242) 1.259421 (0.532746) 0.449677 (0.5025)
15.91123 (0.0004) * 0.914387 9.612440 0.001118 0.273907 (0.6075) 0.299998 (0.860709) 1.766861 (0.4067)
22.84202 (0.0000) * 0.935731 13.10354 0.000331 0.175578 (0.6804) 0.204458 (0.902823) 1.095235 (0.2953
0.932783 12.48940 0.000401 0.004279 (0.9486) 0.320097 (0.852102) 0.060295 (0.8060)
*Means that there is significance at 5%
Long-run Causality Results According to the first row in table 2 and 3 results we can conclude the following interpretations: 1. The coefficient on the ECT1 (Error Correction Term) for GDP is negative and significant at 5% level. This means there is long-run causality from Conventional banking indicators to the non-Oil GDP. The magnitude of ECT is (-2.80) implying that adjustment coefficient is fairlyhigh and deviation from the long-run equilibrium is eliminated rapidly with ahigher rate of correction. 2. The coefficient on the ECT2 (Error Correction Term) for Assets is negative and significant at 5%, the magnitude of ECT is (-8.30E-08). So we can conclude that there is long-run causality running from nonOil GDP to Assets. 3. The coefficient on the ECT1 (Error Correction Term) for Deposits is negative and significant at 5%. So we can conclude that there is long-run causality running from non-Oil GDP to Deposits. The magnitude of ECT is (-0.0393) which means that short-term deviation will be adjusted slowly to the long-term equilibrium. 4. The coefficient on the ECT2 (Error Correction Term) for Private is negative and significant at 5%. So we can conclude that there is a long-run causality running from non-Oil GDP to Private. 5. As summary we can confirm that there is bidirectional long-run causality betweenconventional banking indicators and non-Oil GDP, in other words we can conclude that in the long run; the Non-Oil GDP is leaded by the development of the conventional banking sector in Bahrain.In the other side also, the developments in the conventional banking are affected by the growth of the non-Oil GDP. Short-run Causality Results From the results of table4, after applying Granger Causality/Block Erogeneity Wald test, we can conclude the following interpretations:
http://www.thejournalofbusiness.org/index.php/site
10
Islamic vs. conventional banking...
1. There is a short –run causality running from Deposits and Private to non-Oil GDP. Which means that in the short-term, conventional banking causes the economic growth in the non-Oil/Gas sectors in Bahrain. 2. There is short –run causality running from GDP to conventional banking indicators, which means that in the other side, the economic growth in the non-Oil/Gas sectors does cause the conventional banking deepening in the case of Bahrain. Causality Test Results Based on VAR in the Islamic Banking Model Table 5: Causality Test Results Based on VAR Dependent Lagged DGDP (-1) Chi-square (P-Value) DIfassets(-1) Chi-square (P-Value) DIfdeposists(-1) Chi-square (P-Value) DIfprivate(-1) Chi-square (P-Value) R2 F-Statistics P-value F-ARCH test JB Normal Breusch-Godfrey
ΔGDP Coefficient. P-Value ()
ΔIfassets Coefficient. P-Value ()
ΔIfdeposits Coefficient. P-Value ()
ΔIfprivate Coefficient. P-Value ()
-
0.006537 (0.9356)
0.016985 (0.8963)
1.311189 (0.2522)
12.21136 (0.0005)*
-
0.344238 (0.5574)
0.311322 (0.5769)
10.50838 (0.0012)*
0.466656 (0.4945)
-
0.506911 (0.4765)
33.92488 (0.0000) * 0.979623 2.043 0.0000 0.129836 (0.7226) 0.849356 (0.653980) 0.059398 (0.8074)
33.92488 (0.6045) 0.360155 2.392230 0.091265 0.070942 (0.7928) 98.70995 (0.0000) 1.077019 (0.2994)
0.518185 (0.4716) 0.457783 3.588193 0.026908 0.063523 (0.8037) 96.82659 (0.0000) 0.135305 (0.7130)
0.889627 34.25595 0.0000 0.199958 (0.6598) 4.085089 (0.129698) 1.137510 (0.2862)
*Means that there is significance at 5%
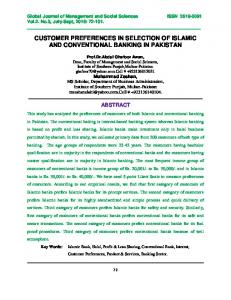
From table5 results, we can conclude that there is a unidirectional causality running from the Islamic banking indicators toward the non-Oil GDP in Bahrain. There is no evidence about the impact of the non-Oil GDP on the Islamic banking indicators. Impulse Response Function In signal processing, the impulse response, or impulse response function (IRF), of a dynamic system is its output when presented with a brief input signal, called an impulse. More generally, an impulse response refers to the reaction of any dynamic system in response to some external change. In both cases, the impulse response describes the reaction of the system as a function of time (or possibly as a function of some other independent variable that parameterizes the dynamic behavior of the system). In all these cases, the dynamic system and its impulse response may be actual physical objects, or may be mathematical systems of equations describing such objects. We tested first the stability of each model; Islamic Banking and Conventional Banking, in below are the results of stability diagnosis for both models: - Impulse Response Function in Conventional Banking Model We considered the first VECM function, where the non-Oil GDP is dependent variable and Conventional banking indicators are independent variables. From the VECM we found out that there is bidirectional long run causality between conventional banking and the Non-Oil GDP. By adding one standards
http://www.thejournalofbusiness.org/index.php/site
11
Belhadia and Belbouab, IJBSR (2014), 04(12): 01-15
deviation (positive shock) to the independent variables, the following figure shows the different scenarios for the next coming 5 years. Figure 2: Plots of CUSUM statistics 10.0
12
7.5
8
5.0 4
2.5 0.0
0
-2.5
-4
-5.0 -8
-7.5 -10.0
-12 2004
2005
2006
2007 CUSUM
2008
2009
2010
2011
2012
1996
1998
2000
2002
5% Significance
2004
CUSUM
2006
2008
2010
2012
5% Significance
Figure 3: IR functions in Conventional Banking Model Response to Cholesky One S.D. Innovations Response of GDP to GDP
Response of GDP to ASSETS
2,000,000,000
2,000,000,000
1,000,000,000
1,000,000,000
0
0
-1,000,000,000
-1,000,000,000
-2,000,000,000
-2,000,000,000 1
2
3
4
5
1
Response of GDP to DEPOSITS
2
3
4
5
Response of GDP to PRIVATE
2,000,000,000
2,000,000,000
1,000,000,000
1,000,000,000
0
0
-1,000,000,000
-1,000,000,000
-2,000,000,000
-2,000,000,000 1
2
3
4
5
1
2
3
4
5
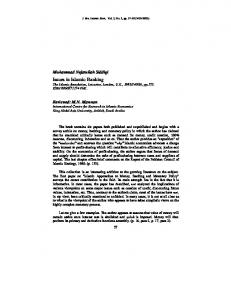
- Impulse Response Function in Islamic Banking Model We considered the first VAR function, where the non-Oil GDP is dependent variable and Islamic banking indicators are independent variables. From the VAR we found out that there is unidirectional long run causality from Islamic banking to Non-Oil GDP. By adding one standards deviation (positive shock) to the independent variables, the following figure in below shows the different scenarios for the next coming 5 years.
http://www.thejournalofbusiness.org/index.php/site
12
Islamic vs. conventional banking...
Figure 4: IR functions in Islamic Banking Model Response to Cholesky One S.D. Innovations ± 2 S.E. Response of GDP to GDP
Response of GDP to IFASSETS
1,500,000,000
1,500,000,000
1,000,000,000
1,000,000,000
500,000,000
500,000,000
0
0
-500,000,000
-500,000,000
-1,000,000,000
-1,000,000,000 1
2
3
4
5
1
Response of GDP to IFDEPOSITS
2
3
4
5
Response of GDP to IFPRIVATE
1,500,000,000
1,500,000,000
1,000,000,000
1,000,000,000
500,000,000
500,000,000
0
0
-500,000,000
-500,000,000
-1,000,000,000
-1,000,000,000 1
2
3
4
5
1
2
3
4
5
By the comparison between the two Impulse Response Functions, it is clear that the credit provided by the Islamic banks in Bahrain has a higher and stable impact on the non-Oil GDP growth than the one provided by the conventional banks during the next coming 5 years. The same result is observed for the conventional banks’ assets vs. Islamic banks’ assets. However, the credit provided to the private sector by Islamic banks appears to be more procyclical than the credit provided by the conventional banks. But the fluctuations in the conventional credit are sharper than the Islamic banks’ private credit.
5.0
CONCLUSION
In this paper, an investigation has been conducted to explore the relation between Banking developments indicators and non-resources GDP in Bahrain over the period 1990-2012, focusing on Granger causality effects within VECM and VAR environments. The VECM results of the conventional banking show that there is long-run bidirectional causality between all the conventional banking selected indicators and the non-Oil GDP. For the Islamic banking VAR model, the results show the existence of a unidirectional causality from Islamic banking indicators to the non-oil GDP. There is no evidence on the role of non-oil GDP on the Islamic banking development. The impulse response functions in the two models shows that through one standards deviation positive shock in Islamic vs, Conventional Credit provided to private sector, the non-Oil GDP growth will be much higher in the next five years if we stimulate the credit provided to private sector by the Islamic banks than the conventional banks. A secondary outcome of this paper is the credit provided to the private sector by Islamic banks appears to be more procyclical than the credit provided by the conventional banks. However, the fluctuations in the conventional credit are sharper than the Islamic banks’ private credit. This study provides the policy makers in Bahrain with the appropriate evidences to design their policies in fostering the non-Oil sector.
http://www.thejournalofbusiness.org/index.php/site
13
Belhadia and Belbouab, IJBSR (2014), 04(12): 01-15
REFERENCES Allen, F., & Santomero, A. M. (2001). What do financial intermediaries do? Journal of Banking & Finance, 25(2), 271-294. Allen F. & Carletti E. (2008). The Roles of Banks in Financial Systems. Work paper prepared for Oxford handbook of Banking. Allen, F., & Santomero, A. M. (1997). The theory of financial intermediation. Journal of Banking & Finance, 21(11), 1461-1485. Allen, F., & Gale, D. (1997). Financial markets, intermediaries, and intertemporal smoothing. Journal of Political Economy, 105(3), 523-546. Arezki, R., Kazimov, K., & Hamilton, K. (2011). Resource windfalls, macroeconomic stability and growth: the role of political institutions. International Monetary Fund. Bekaert, G., & Harvey, C. R. (1998). Capital markets: An engine for economic growth. Brown J. World Aff., 5, 33. Beck, T. H. L. (2011). Finance and Oil. Is there a Resource Curse in Financial Development? (No. 2011-017). Ben S Bernanke (2008). Reducing Systemic Risk. Speech presented at the federal reserve Bank of Kansas City's Annual Economic Symposium. Jackson Hole, Wyoming. Ben S Bernanke (2008). Risk Management in Financial institutions. Speech presented at the Federal Reserve Bank of Chicago on Bank structure and competition, Chicago, Illinois. Bertocco, G. (2008). Finance and development: Is Schumpeter’s analysis still relevant? Journal of Banking & Finance, 32(6), 1161-1175. Capelle-Blancard, G., Couppey-Soubeyran, J., & Soulat, L. (2008). The measurement of financial intermediation in Japan. Japan and the World Economy, 20(1), 40-60. De Gregorio, J., & Guidotti, P. E. (1995). Financial development and economic growth. World development, 23(3), 433-448. Diamond, D. W. (1996). Financial intermediation as delegated monitoring: A simple example. Economic Quarterly-Federal Reserve Bank of Richmond, 82, 51-66. Dickey, D. & Fuller, W. (1981). Likelihood Ratio Statistics for Auto-regressive Time Series with a Unit Root, Econometric journal, 49(4), 1017-1072. Greenwood, J. & Jovanovic, B. (1990). Financial development, growth, and the distribution of income. The Journal of Political Economy, 5(1), 1076-1107. Goldsmith, R. (1969). Financial Structure and Economic Growth in Advanced Countries. National Bureau Committee for Economic. Gurley, J. G., & Shaw, E. S. (1955). Financial aspects of economic development. The American Economic Review, 515-538. Hakenes, H. (2004). Banks as delegated risk managers. Journal of Banking & Finance, 28(10), 2399-2426. Hamilton, K., & Ruta, G. (2009). Wealth accounting, exhaustible resources and social welfare. Environmental and Resource Economics, 42(1), 53-64. Hay, M. (2000). Banques et croissance: Examen critique et analyse en données de panel. Papier présenté aux 17èmes Journées Internationales d’Economie Monétaire et bancaire Lisbonne, 7(8). Johansen, S. (1988). Statistical analysis of cointegration vectors. Journal of economic dynamics and control, 12(2), 231-254. Johansen, S., & Juselius, K. (1990). Maximum likelihood estimation and inference on cointegration— with applications to the demand for money. Oxford Bulletin of Economics and statistics, 52(2), 169210. khalid h.a. al-qudir (2004). The effect of financial Development on the Growth in Saudi Arabia. College of Administrative science, King saud University, Riyadh. Saudi Arabia. King, R. G., & Levine, R. (2004). Finance and Growth Schumpter Might Be Right. World Bank Publications. King, R. G., & Levine, R. (2004). Finance and Growth: Schumpeter Might be Right. The Quarterly Journal of Economics, 108( 3), 717-737. Levine, R. (1997). Financial development and economic growth: views and agenda. Journal of economic http://www.thejournalofbusiness.org/index.php/site
14
Islamic vs. conventional banking...
literature, 688-726. Laurence Scialom 1991. " EconomieBancaire" édition la Découverte. PARIS. Levine R. (2007). Finance and growth: theory and evidence. National bureau of economic research working paper 107661050 Massachusetts. Robert merton , Zvibadie. ''Finance'' 2 édition françaisedirigée par christophethibiergepearsoneduation France. Robinson, J. (1952). The Generalization of the General Theory in the Rate of Interest and Other Essays. London: Macmillan. Scholtens, B., & van Wensveen, D. (2003). The theory of financial intermediation: an essay on what it does (not) explain. SUERF Studies. Scholtens, B., & Van Wensveen, D. (2000). A critique on the theory of financial intermediation. Journal of Banking & Finance, 24(8), 1243-1251. Scholtens, B., & Van Wensveen, D. (2000). A critique on the theory of financial intermediation. Journal of Banking & Finance, 24(8), 1243-1251. Skeie, D. R. (2008). Banking with nominal deposits and inside money. Journal of Financial Intermediation, 17(4), 562-584. Schumpeter, Joseph A. (1934). The Theory of Economic Development. Translated by Redvers Opie, Cambridge, MA: Harvard University Press.
http://www.thejournalofbusiness.org/index.php/site
15