2518 • The Journal of Neuroscience, March 9, 2005 • 25(10):2518 –2521
Brief Communication
Isotropic Fractionator: A Simple, Rapid Method for the Quantification of Total Cell and Neuron Numbers in the Brain Suzana Herculano-Houzel and Roberto Lent Departamento de Anatomia, Instituto de Cieˆncias Biome´dicas, Universidade Federal do Rio de Janeiro, Rio de Janeiro, Brazil 21941-590
Stereological techniques that estimate cell numbers must be restricted to well defined structures of isotropic architecture and therefore do not apply to the whole brain or to large neural regions. We developed a novel, fast, and inexpensive method to quantify total numbers of neuronal and non-neuronal cells in the brain or any dissectable regions thereof. It consists of transforming highly anisotropic brain structures into homogeneous, isotropic suspensions of cell nuclei, which can be counted and identified immunocytochemically as neuronal or non-neuronal. Estimates of total cell, neuronal, and non-neuronal numbers can be obtained in 24 h and vary by ⬍10% among animals. Because the estimates obtained are independent of brain volume, they can be used in comparative studies of brain-volume variation among species and in studies of phylogenesis, development, adult neurogenesis, and pathology. Applying this method to the adult rat brain, we show, for example, that it contains ⬃330 million cells, of which 200 million are neurons, and almost 70% of these are located in the cerebellum alone. Moreover, contrary to what is commonly assumed in the literature, we show that glial cells are not the majority in the rat brain. Key words: cerebellum; cortex; glia; neuron; evolution; morphometry
Introduction Brain size varies by a factor of 100,000 across mammalian species (Haug, 1987). Several variables contribute to determine brain size within and across species: number of neurons, number of glial cells, cell-body size, dendritic and axonal arborization, vasculature, and extracellular space. Brain function is influenced by all of these variables, but little is known about how they combine to yield a brain with reproducible characteristics within each species or how they compare across development or between normal and pathological brains. Fundamental information is lacking, for example, about the human brain. Its total number of neurons was once estimated at ⬃85 billion (Williams and Herrup, 1988), but recent studies estimate a total of 105 billion neurons in the human cerebellum alone (Andersen et al., 1992). The ratio between neurons and glia is likely to have functional relevance (Nedergaard et al., 2003), and it is commonly assumed that glia outnumReceived Nov. 4, 2004; revised Jan. 19, 2005; accepted Jan. 21, 2005. This work was supported by Fundac¸a˜o Carlos Chagas Filho de Amparo a` Pesquisa do Estado do Rio de Janeiro Primeiros Projetos Grant E26/170.647/2004 (S.H.-H.), Conselho Nacional de Desenvolvimento Cientı´fico e Tecnolo´gico Edital Universal Grant 471623/2003-2 (R.L.), and Pronex Grant 171.213/2003 (S.H.-H., R.L.). We are grateful to Adiel do Nascimento for animal care, Elizabeth de Moraes for technical help, Vivaldo Moura-Neto and JeanChristophe Houzel for insightful discussions, Cristovam Picanc¸o-Diniz for the epitope-retrieval protocol, and Carlos Mandarim de Lacerda for pointing out the similarities between our method and the optical fractionator. Animals were maintained and manipulated according to Brazilian laws and international regulations, and the project was authorized by the Committee on Animal Care of the Instituto de Cieˆncias Biome´dicas, Universidade Federal do Rio de Janeiro. Correspondence should be addressed to either Suzana Herculano-Houzel or Roberto Lent, Universidade Federal do Rio de Janeiro, Departamento de Anatomia, Centro de Cieˆncias da Sau´de, Bloco F, Ilha do Funda˜o, Rio de Janeiro, Brazil 21941-590, E-mails:
[email protected] and
[email protected]. DOI:10.1523/JNEUROSCI.4526-04.2005 Copyright © 2005 Society for Neuroscience 0270-6474/05/252518-04$15.00/0
ber neurons in the brain (Raisman, 1991; Doetsch, 2003) and specifically in humans by a factor of 10 or 50 (Kandel, 2000), despite the lack of data for these assumptions. Stereological methods such as the optical dissector and fractionator (West, 1999) can estimate the number of cells and neurons in discrete brain regions (Korbo et al., 1990; Andersen et al., 1992). However, because these estimates are obtained from cell densities, they must be restricted to well defined structures of isotropic architecture and measurable volume (West, 1999). Using these methods to quantify total cell numbers in the brain would thus require the daunting task of dividing it into numerous regions of homogeneous cell density. Additionally, because stereological estimates are necessarily achieved by multiplying cell density by volume, the numbers obtained are not independent variables and therefore cannot be used in statistical comparisons against volume (Harrison et al., 2002). To obtain estimates of total numbers of neuronal and nonneuronal cells independently from brain volume and anisotropy, we developed a novel method that can be applied to the whole brain or any dissectable region thereof. It does not require familiarity with stereological techniques and yields reproducible estimates of total numbers of cells and neurons within 2 and 24 h, respectively. It relies on the single assumption that every cell in the brain contains one and only one nucleus and consists of processing fixed brains, as a whole or dissected into subregions, into an isotropic suspension of isolated nuclei, in which cytoarchitectural heterogeneities have been literally dissolved. Because this suspension has a known, defined volume and can be kept homogeneous by agitation, the total number of nuclei therein (and
Herculano-Houzel and Lent • Isotropic Fractionator
J. Neurosci., March 9, 2005 • 25(10):2518 –2521 • 2519
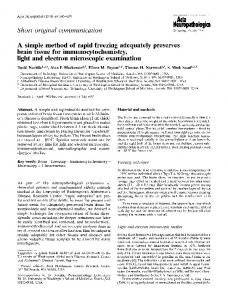
a hemocytometer (⬃5–10 million nuclei per milliliter, equivalent to 2 ml for rat olfactory bulb and 10 ml for cortex, cerebellum, or the remaining areas). After sufficient agitation, 5 l aliquots are removed for determination of nuclei density in a hemocytometer. DAPI-stained nuclei are counted under a fluorescence microscope at 400⫻ magnification. The suspension is considered homogeneous when counts vary by ⬍10% across aliquots. We also analyze DAPIstained aliquots of the supernatant to control for nuclei that may have failed to descend to the pellet. We count only intact nuclei or those slightly damaged that keep more than one-half of their circumference. Typically, we only find intact or almost-intact nuclei, and the suspension is practically devoid of free nucleoli (Fig. 1C). Preparations with nuclear debris and free nucleoli can be attributed to insufficient fixation and are discarded (Fig. 1 B). Once nuclear density in the suspension is determined by averaging over at least eight samples, the total number of cells in the original tissue is estimated by multiplying mean nuclear density by total suspension volume. If the brain is divided into subregions, the total number of cells can be calculated Figure 1. A, The isotropic fractionator is a 10-step method that requires little material and allows rapid determination of the by adding subtotals. Estimates are obtained in no total number of cells (2 h from steps 2– 8) and total numbers of neuronal and non-neuronal cells (24 h from steps 2–10) in more than 2 h for each brain. For estimates of total neuron number, a 200 – aldehyde-fixed brain tissue. Fr, Fraction. B, C, Appearance of isotropic suspensions of DAPI-stained nuclei prepared from unfixed (B) or paraformaldehyde-fixed (C) adult rat cortex, shown at the same magnification. Scale bars, 50 m. Although complete dissociation 500 l aliquot is removed from the nuclear suspension and immunoreacted for NeuN. Nuclei of unfixed tissue leads to nuclear destruction (B), fixed, dissociated nuclei are intact and have preserved morphology (C). in the aliquot are collected by centrifugation, resuspended in a 0.2 M solution of boric acid, therefore the total number of cells in the original tissue) can be pH 9.0, and heated for 1 h at 75°C for epitope retrieval. Subsequently, estimated by determining the density of nuclei in small aliquots. nuclei are again collected by centrifugation, washed in PBS, and incuOnce the total cell number is known, the proportion of neurons is bated overnight at room temperature with anti-NeuN mouse IgG (1:300 determined by immunocytochemical detection of neuronal nuin PBS; Chemicon, Temecula, CA). After being washed in PBS, nuclei are clear antigen (NeuN), expressed in all of the nuclei of most neuincubated in cyanine 3-conjugated goat anti-mouse IgG secondary antironal cell types but not in non-neuronal cells (Mullen et al., 1992; body (1:400 in 40% PBS, 10% goat serum, and 50% DAPI; Accurate Chemicals, Westbury, NY) for 2 h, collected by centrifugation, washed in Gittins and Herrison, 2004), and the number of non-neuronal PBS, and then suspended in a small volume of PBS for counting under the cells derived by subtraction. fluorescence microscope. To avoid counting bias, we register the presence or absence of NeuN immunoreactivity for all of the DAPI-stained nuclei in Materials and Methods each of the central fields of the hemocytometer chamber until at least 500 Four adult Wistar rats were killed by ether inhalation and perfused tranDAPI-stained nuclei have been examined. scardially with saline, followed by 4% buffered paraformaldehyde. Brains The proportion of NeuN-positive nuclei is determined separately for were removed from the skull using the foramen magnum as the inferior each region of interest and multiplied by the total number of nuclei to limit of the medulla oblongata. After 3–30 d postfixation, they were yield total number of neurons in each structure. Total number of “nondissected into four regions of interest: olfactory bulb, cortex, cerebellum, neuronal nuclei” is calculated by subtracting the number of NeuNand remaining areas, using consistent anatomical landmarks as criteria containing nuclei from the total number of nuclei. The whole procedure for dissection (see Fig. 2). lasts no more than 24 h, starting from the moment at which the fixed A suspension of nuclei is obtained through mechanical dissociation of brain is collected. the fixed brain regions in a standard solution (40 mM sodium citrate and 1% Triton X-100) (Lee et al., 1984), using a 40 ml glass Tenbroeck tissue Results homogenizer (Fig. 1 A). Complete homogenization is achieved by using We find that the adult rat brain has 331.65 ⫾ 8.84 million cells at least 1 ml of dissociation solution per 100 mg of brain tissue and (n ⫽ 4; 2–3 months of age) (Table 1, top). Although brain weight grinding until the smallest visible fragments are dissolved. When pervaries by 17% among our animals, their estimated total cell numformed on fixed tissue, this procedure lyses the plasmalemma but preber varies by only 3%. Moreover, when regions of interest are serves the nuclear envelope intact (Fig. 1 B, C). The homogenate is collected with a Pasteur pipette and transferred to considered separately, estimates of cell number yield coefficients 15 ml centrifuge tubes. To avoid loss of nuclei, the grinding pestle and of variation (CVs) that are always less than those for the corretube are washed several times with dissociation solution, and the washes sponding tissue weight (Table 1, top). In particular, CVs for corare also collected for centrifugation (10 min at 4000 ⫻ g). Once all of the tex and cerebellum are ⬍0.10. Such small CVs indicate that nuclei are collected in a pellet, the supernatant is pipetted carefully into a counting nuclei in brain homogenates is a reliable way to estimate separate tube. Pelleted nuclei are then suspended in PBS containing 1% cell numbers in the brain and its subregions. 4⬘,6-diamidino-2-phenylindole dihydrochloride (DAPI), a nonintercaAlthough the proportion of NeuN-immunoreactive nuclei is lating fluorescent DNA-specific dye (Molecular Probes, Eugene, OR), to very distinct among brain structures (Fig. 2), it is reproducible make all of the nuclei visible under ultraviolet illumination. The final within the same brain structures among animals, with CVs usually volume of this DAPI-stained nuclear suspension is adjusted empirically ⬍0.10 (Table 1). with PBS to yield a density of nuclei that is suitable for quantification in
Herculano-Houzel and Lent • Isotropic Fractionator
2520 • J. Neurosci., March 9, 2005 • 25(10):2518 –2521
Table 1. Cellular composition of the adult rat brain and its subregions Cortex Cerebellum
Weight (mg) n cells (⫻106) Cells (⫻103)/mg Percentage of NeuN⫹ nuclei n neurons (⫻106) Neurons (⫻103)/mg n non-neuronal cells (⫻106) Percentage of brain weight Percentage of all cells Percentage of all neurons
Olfactory bulb
Remaining areas
Total
Estimates
CV
Estimates
CV
Estimates
CV
Estimates
CV
Estimates
CV
770 ⫾ 113 76.71 ⫾ 3.02 101.52 ⫾ 17.40 40.58 ⫾ 5.34 31.02 ⫾ 3.03 41.09 ⫾ 8.00 45.69 ⫾ 5.68 42.86 ⫾ 1.74 23.15 ⫾ 1.23 15.48 ⫾ 0.94
0.15 0.04 0.17 0.13 0.10 0.19 0.12 0.04 0.05 0.06
272 ⫾ 38 168.18 ⫾ 12.57 631.24 ⫾ 128.58 82.78 ⫾ 3.24 139.17 ⫾ 11.19 522.69 ⫾ 108.85 29.01 ⫾ 6.28 15.17 ⫾ 1.00 50.69 ⫾ 3.16 69.57 ⫾ 4.37
0.14 0.07 0.20 0.04 0.10 0.21 0.08 0.06 0.06 0.06
77 ⫾ 23 20.87 ⫾ 5.80 272.43 ⫾ 33.89 53.60 ⫾ 4.28 11.26 ⫾ 3.68 146.92 ⫾ 27.50 9.61 ⫾ 2.42 4.24 ⫾ 0.77 6.31 ⫾ 1.83 5.64 ⫾ 1.90
0.30 0.28 0.12 0.08 0.10 0.19 0.33 0.18 0.29 0.34
683 ⫾ 153 65.90 ⫾ 9.64 99.57 ⫾ 23.97 28.12 ⫾ 3.14 18.68 ⫾ 4.24 27.81 ⫾ 6.17 47.22 ⫾ 5.98 37.72 ⫾ 2.55 19.86 ⫾ 2.74 9.31 ⫾ 1.96
0.22 0.15 0.24 0.11 0.10 0.22 0.23 0.07 0.14 0.21
1802 ⫾ 313 331.65 ⫾ 8.84 188.79 ⫾ 36.65 60.31 ⫾ 2.35 200.13 ⫾ 12.17 113.98 ⫾ 23.16 131.52 ⫾ 6.11
0.17 0.03 0.19 0.04 0.06 0.20 0.05
Values are mean ⫾ SD. CV ⫽ SD/mean. n cells, total number of cells (in millions); Cells (⫻103)/mg, cell density per milligram of tissue (in thousands); n neurons, total number of neurons (in millions); Neurons (⫻103)/mg, neuronal density per milligram of tissue (in thousands); n non-neuronal cells, total number of non-neuronal cells (in millions, defined as n cells ⫺ n neurons). Large SD and CV values for olfactory bulb weight can be partly explained by the difficulty of dissecting this structure undamaged.
Combining our estimates of total cell number and percentage of NeuNcontaining nuclei in each brain region, we find that adult rat cortex contains ⬃80 million cells, 40% of which (⬃30 million) are neurons. In comparison, rat cerebellum contains more than twice as many cells (⬃170 million), ⬎80% of which are neurons (Table 1, top). Therefore, the adult rat brain contains almost five times as many neurons in the cerebellum (⬃140 million) than in the cerebral cortex. When all of the brain regions are taken into consideration, the cerebellum thus accounts for more than one-half of the cells and ⬃70% of all of the neurons of the entire rat brain (Table 1, bottom). Overall, we estimate that of all of the cells in the adult rat brain, 60%, or 200.13 ⫾ 21.17 million, are neurons. Glial cells, therefore, contrary to common belief, are not the most numerous cell type in the rat brain.
Discussion
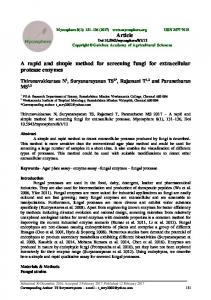
Figure 2. The total number of neurons in dissected brain regions (top; cortex, cerebellum, olfactory bulb, and remaining areas) is estimated by determining the proportion of DAPI-stained nuclei in isotropic suspensions (left) that are also NeuN positive (center; right, merged images). All of the photomicrographs are shown at the same magnification. Scale bars, 50 m. Notice that the proportion of NeuN-positive nuclei is distinct among the four regions of interest. “Cortex” refers to gray and white matter of neocortex, hippocampus, and adjacent paleocortices lateral to the olfactory tract; “Cerebellum” refers to cerebellar cortex, deep nuclei, and cerebellar white matter, including the cerebellar peduncles. “Remaining areas” include accessory olfactory nuclei, basal ganglia, diencephalon and optic chiasm, and brainstem. Smaller, precise regions can also be quantified using the isotropic fractionator, provided constant criteria are used for dissection (e.g., specific cortical areas and gyri, subcortical nuclei, basal ganglia, diencephalon, midbrain, pons, and medulla). In addition, dissections can also be performed from vibratome sections.
Stereological techniques are useful for determining densities of structural elements in discrete, isotropic brain regions, such as subcortical nuclei. To minimize the problem of investigating anisotropic structures, such as cortex, one particular stereological technique (the optical fractionator) proposes to parcel the structure of interest into small volumes that can be less heterogeneous and more accurately sampled by microscopy (West, 1999). Our method takes this idea farther by turning brain tissue isotropic, or completely fractionated, through dissociation that preserves only the cell nuclei. By analogy, we refer to it as the isotropic fractionator. The isotropic fractionator allows determination of total cell and neuron numbers in the brain or in any dissectable region thereof. It is fast and inexpensive, does not require specific stereological techniques, and can be applied to the determination of total cell and neuron numbers in studies of phylogenesis, development, adult neurogenesis,
Herculano-Houzel and Lent • Isotropic Fractionator
and pathology. Counting nuclei in our suspensions might also be achieved with fluorescence-activated cell sorting, although our method has the advantages of (1) using visual inspection of the samples to discern stained debris from labeled nuclei, (2) allowing the identification of specific cell types by their nuclear morphology, and (3) being readily accessible to any laboratory. Despite these advantages, a few critical points deserve consideration. Because only intact nuclei are counted, any damage or loss of nuclei during the procedures will result in variability and underestimation of total cell number. However, (1) nuclear damage is minimal, because nuclear morphology is well preserved by fixation, with ⬍1% of nuclei showing signs of damage, (2) nuclear loss is avoided by extensive washing, and virtually no nuclei are found in the supernatant, (3) our results in the adult rat cortex give larger numbers than those obtained by a previous stereological study (Korbo et al., 1990), (4) counts are very consistent, with CVs lower than those for brain weight, and (5) although NeuN is not expressed by Purkinje cells, inferior olive neurons, and mitral cells in olfactory bulb (Mullen et al., 1992), these cells can be expected to contribute very little to the total number of neurons in the brain (Andersen et al., 1992). We are presently unable to identify NeuN-negative nuclei as belonging to either glial, endothelial, or ependymal cells. Therefore, until specific nuclear markers are described for these cell types, this NeuN-negative population has to be referred to as non-neuronal nuclei. However, this population indicates the maximum possible number of glial cells in a given brain structure and shows that neurons, and not glia, are the most numerous cell type in the rat brain. Several groups have used stereology to estimate cell density in rat cerebral cortex, obtaining values of 106,140 cells/mg (Brizzee et al., 1964) and 119,000 cells/mm 3 (Nurnberger and Gordon, 1957) in somatosensory cortex. Estimates based on nuclear DNA content (Gray and DeLuca, 1956) also give similar values of 112,000 cells/mg in somatosensory cortex (Brizzee et al., 1964). Using the isotropic fractionator, we found an average cell density in the entire rat cortex of 101,520 cells/mg (Table 1), a value that is compatible with previous estimates in the literature. Total numbers of neurons in the adult rat cerebral cortex have been estimated previously using stereology at 21 million (Korbo et al., 1990) and 30 million (Tinsley et al., 2000). With a CV of 0.04, the latter value is identical to our estimate of 31 million. However, total numbers of cells and neurons obtained with the optical fractionator or the dissector are variables that depend on structure volume and therefore cannot be used in statistical comparisons against brain volume (Harrison et al., 2002). For this reason, comparative studies of brain-volume variation across species have been primarily limited to volumetric data published by a few laboratories, often based on measurements of very few brains of each species (Stephan et al., 1981; Frahm et al., 1982). Because of the lack of direct estimates of total cell and neuron number in the brain, subsequent studies have been reanalyses of the same volumetric data sets (Finlay and Darlington, 1995; Barton and Harvey, 2000; de Winter and Oxnard, 2000; Zhang and Sejnowski, 2000; Clark et al., 2001; Stevens, 2002). In contrast, the isotropic fractionator offers estimates of total cell and neuron numbers that are independent of brain volume and are therefore useful for unveiling allometric rules in brain evolution (Herculano-Houzel and Lent, 2004). Because of its simplicity and low cost and because it allows total cell, neuronal, and non-neuronal numbers to be determined quickly and reliably in the whole brain and specific brain regions, the isotropic fractionator will provide fundamental pieces of in-
J. Neurosci., March 9, 2005 • 25(10):2518 –2521 • 2521
formation that so far have been lacking in the literature. After all, understanding how the brain is built in evolution and development and how it works in health and disease requires knowing what it is made of: how many cells, how many neurons, and how many non-neuronal cells.
References Andersen BB, Korbo L, Pakkenberg B (1992) A quantitative study of the human cerebellum with unbiased stereological techniques. J Comp Neurol 326:549 –560. Barton RA, Harvey PH (2000) Mosaic evolution of brain structure in mammals. Nature 405:1055–1058. Brizzee KR, Vogt J, Kharetchko X (1964) Postnatal changes in glia/neuron index with a comparison of methods of cell enumeration in the white rat. Prog Brain Res 4:136 –149. Clark DA, Mitra PP, Wang SS (2001) Scalable architecture in mammalian brains. Nature 411:189 –193. de Winter W, Oxnard CE (2000) Evolutionary radiations and convergences in the structural organization of mammalian brains. Nature 409:710 –714. Doetsch F (2003) The glial identity of neural stem cells. Nat Neurosci 6:1127–1134. Finlay BL, Darlington RB (1995) Linked regularities in the development and evolution of mammalian brains. Science 268:1578 –1584. Frahm HD, Stephan H, Stephan M (1982) Comparison of brain structure volumes in Insectivora and Primates. I. Neocortex. J Hirnforsch 23:375–389. Gittins R, Herrison PJ (2004) Neuronal density, size and shape in the human anterior cingulated cortex: a comparison of Nissl and NeuN staining. Brain Res Bull 63:155–160. Gray DE, DeLuca HA (1956) Use of desoxyribonucleic acid as a reference standard in metabolic experiments. Am J Physiol 184:301–303. Harrison KH, Hof PR, Wang SS (2002) Scaling laws in the mammalian neocortex: does form provide clues to function? J Neurocytol 31:289 –298. Haug H (1987) Brain sizes, surfaces, and neuronal sizes of the cortex cerebri: a stereological investigation of man and his variability and a comparison with some mammals (primates, whales, marsupials, insectivores, and one elephant). Am J Anat 180:126 –142. Herculano-Houzel S, Lent R (2004) How to build a bigger brain: comparison of total cell and neuron numbers in small and large rodent brains. Soc Neurosci Abstr 30:89.18. Kandel ER (2000) Nerve cells and behavior. In: Principles of neural science, Ed 4 (Kandel ER, Schwartz JH, Jessell TM, eds), pp 19 –35. New York: McGraw-Hill. Korbo L, Pakkenberg B, Ladefoged O, Gundersen HJ, Arlien-Soborg P, Pakkenberg H (1990) An efficient method for estimating the total number of neurons in rat brain cortex. J Neurosci Methods 31:93–100. Lee GM, Thornthwait JT, Rasch EM (1984) Picogram per cell determination of DNA by flow cytofluorometry. Anal Biochem 137:221–226. Mullen RJ, Buck CR, Smith AM (1992) NeuN, a neuronal specific nuclear protein in vertebrates. Development 116:201–211. Nedergaard M, Ransom B, Goldman SA (2003) New roles for astrocytes: redefining the functional architecture of the brain. Trends Neurosci 26:523–530. Nurnberger JI, Gordon MW (1957) The cell density of neural tissues: direct counting method and possible applications as a biologic referent. In: Progress in neurobiology, Vol II, Ultrastructure and cellular chemistry of neural tissue (Waelsch H, ed), pp 100 –128. New York: Hoeber. Raisman G (1991) Glia, neurons, and plasticity. Ann NY Acad Sci 633:209 –213. Stephan H, Frahm H, Baron G (1981) New and revised data on volumes of brain structures in insectivores and primates. Folia Primatol (Basel) 35:1–29. Stevens CF (2002) An evolutionary scaling law for the primate visual system and its basis in cortical function. Nature 411:193–195. Tinsley CJ, Bennett GW, Mayhew TM, Parker TL (2000) Stereological analysis of regional brain volumes and neuron numbers in rats displaying a spontaneous hydrocephalic condition. Exp Neurol 168:88 –95. West MJ (1999) Stereological methods for estimating the total number of neurons and synapses: issues of precision and bias. Trends Neurosci 22:51– 61. Williams RW, Herrup K (1988) The control of neuron number. Annu Rev Neurosci 11:423– 453. Zhang K, Sejnowski T (2000) A universal scaling law between gray matter and white matter of cerebral cortex. Proc Natl Acad Sci USA 97:5621–5626.