Journal of Biomimetics, Biomaterials and Biomedical Engineering ISSN: 2296-9845, Vol. 31, pp 1-10 doi:10.4028/www.scientific.net/JBBBE.31.1 © 2017 Trans Tech Publications, Switzerland
Submitted: 2017-02-03 Revised: 2017-03-15 Accepted: 2017-03-20 Online: 2017-03-30
Stereometric Parameters of Butterfly Wings GARCZYK Żaneta1,a, STACH Sebastian1,b, ŢĂLU Ştefan2,c, SOBOLA Dinara3,d *, WRÓBEL Zygmunt1,e 1
University of Silesia, Faculty of Computer Science and Materials Science, Institute of Informatics, Department of Biomedical Computer Systems, ul. Będzińska 39, 41-205 Sosnowiec, Poland 2
Technical University of Cluj-Napoca, Faculty of Mechanical Engineering, Department of AET, Discipline of Descriptive Geometry and Engineering Graphics, 103-105 B-dul Muncii St., Cluj-Napoca 400641, Cluj, Romania 3
Brno University of Technology, Faculty of Electrical Engineering and Communication, Physics Department, Technická 8, 616 00 Brno, Czech Republic a
[email protected], b
[email protected], c
[email protected], d
[email protected], e
[email protected]
Keywords: butterfly wings surface, stereometric analysis, atomic force microscopy, segmentation, 3D surface morphology.
Abstract. This paper analyses the data stereometric of three samples obtained using the atomic force microscope. The data concern the two butterfly species: Euploea mulciber (known as “Striped Blue Crow”) and Morpho didius (also named as “Giant Blue Morpho”). These species have a strong correlation color wings of the angle of incidence of light. This is structural coloration and it depends on the surface topography. Here we present a method for the topography evaluation. A script created in Matlab software version R2012 by MathWorks® was used for segmentation data stereometric and analysis of localized motifs occurring on the surface of the samples. An analysis of the data using stereometric software MountainsMap® Premium version 7.3.7746 by Digital Surf was made to compare the results obtained using the script developed in Matlab, for identification of all sorts of motifs, such as peaks, pits, or irregular shapes in correlation with the surface statistical parameters. The analysis of motifs is essential when choosing the appropriate technique for imaging the 3-D (three-dimensional) microtextured features of butterfly wings surfaces. This stereometric analysis proves to be an effective method that can be successfully used for estimation of micro- and nano- topography by processing of AFM data. Introduction Biological materials and systems could be described by mathematical processing of their parameters. Evolution creates a great number of geometrical structures, which in turn make possible a variation of physical properties. For example, butterfly wing scales have structures which define the coloration, wettability, aerodynamic properties of the wings. The mentioned coloration helps to control temperature regulation of the butterfly and has camouflage function. The coloration which is created by geometrical structure of the materials relates to the physical coloration. The lows of geometrical optics work here for emphasis of the colors. Such colors are often iridescent and can demonstrate the dependence on the angle of observation. For example, an artist can create the desired color by changing the density of the color layer and its morphology (roughness, etc): it helps to bring additional color information. Evolution provides combination of chemical and physical coloration for living organisms. The chemical coloration is determined by composition of the material, amount and nature of pigments. The physical coloration is defined by stereometric parameters of the surface topography. In case of butterfly wing, the inner structure is also very important and it is reported in several studies [1, 2]. Here we report the surface stereometric characteristics of the scale surface. It also influences the coloration: the scale surface represents diffraction grating with the sizes comparable to the wave of the light. The size characteristics of these structures could be described and even simulated by All rights reserved. No part of contents of this paper may be reproduced or transmitted in any form or by any means without the written permission of Trans Tech Publications, www.ttp.net. (#90955685-06/06/17,07:42:33)
2
Journal of Biomimetics, Biomaterials and Biomedical Engineering Vol. 31
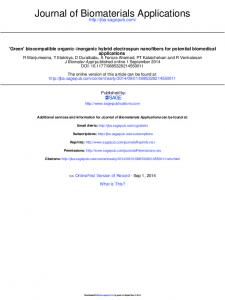
numerical methods [3, 4]. Study of profile, size, and position of the surface features of biological materials is difficult and important task. These materials are a source of inspiration for a number of applications [5-7]. There are some attempts for the replication of such materials [8]. The evolution creates such complex structures which exhibit not only vivid colors but also physical and chemical effects such as superhydrophobicity, self-cleaning, sensing capabilities, fluorescence [9]. Application of numerical methods to description optical wave’s propagation in dependence on structure was made last century [10]. This approach is still in the attention of scientists. The reason is a large variety of physical structures (organic and inorganic) and computational methods for study [11-17]. The purpose of this paper is to apply the stereometric analysis of the wings surface topography of two butterfly species: Euploea mulciber and Morpho didius. The objective of the analysis is extraction and comparison of information from AFM data about surface features. Materials and methods Materials. The determination of stereometric parameters is carried out three times. It is calculated twice for the scales with blue color (dark blue and bright iridescent blue), and once for black color. Two butterfly species are chosen for the study of the scales surface: Euploea mulciber (dark blue color area) and Morpho didius (bright iridescent blue and black areas). The surface topography of the scales has the structures with sizes at micro- and nanometer scales. The place for investigation is chosen in the center or close to the center of the forewings. The optimal scan (observation) area was set up for registration of the micro- and nano-topography. Atomic force microscopy. Scanning probe microscopy provides a lot of possibilities to study the surface of the materials. Atomic force microscopy (AFM) belongs to the family of the probe microscopy and provide significant amount of data about surface properties and appearance. Due to visualization of topography, AFM improves perception and understanding of the surface structure (Fig.1). It is not enough to consider only pigment and inner structure to describe the coloration of the wings. The geometrical shape of the surface feature plays a role at distribution of light waves. Wellcalibrated AFM provides real values of features sizes. The results of scanning are marix data which can be export in Matlab. So, the data can be used for further investigation of the topography. AFM data analysis using a test method created in Matlab software. A script created in Matlab software version R2012 by MathWorks® [18] is used for segmentation data stereometric and analysis of localized motifs occurring on the surface of the samples. AFM data analysis using the software MountainsMap® Premium. Stereometric data segmentation of analyzed samples is also made with the MountainsMap® Premium software [19]. Using segmentation watershed algorithm, the program can detect motives area - hills, hollows, irregular shapes. It is also possible to characterize them, because the program includes advanced surface analysis of samples [19-22].
Journal of Biomimetics, Biomaterials and Biomedical Engineering Vol. 31
a
3
b
c Fig. 1. Data stereometric of the a) first, b) second and c) third analyzed the samples submitted in the form of a surface image Results The calculation of the parameters using a script developed in Matlab. The stereometric data of the analysed samples were uploaded into the Matlab workspace. To avoid oversegmentation, the local maxima were pre-determined by creating the extended-maxima transform. The transform eliminates the maxima lower than or equal to the specified value of the parameter h. The local minima were designated for the completed input data, at points where the extended-maxima transform was non-zero, i.e. the points corresponding to the local maxima. Then, the watershed transformation was carried out, which determined the watershed lines and identified individual areas created around the local minima. The transformation result is a label matrix with values greater than or equal to 0. The zero-valued elements are the watershed lines separating the individual regions. The use of the watershed transformation allowed for the segmentation of images of the sample surfaces, and as a result they were divided into the motifs of significant peaks. In order to detect surface pits, the local minima were first determined by creating the extendedminima transform. Then, at the points where the extended-minima transform was non-zero (corresponding to the local minima), the local minima were determined for the input data. The watershed transformation result was segmentation of surface images of the analysed samples and separation of the motifs of significant surface pits [18]. The border has been designated motifs drawn line course in the case of the hills and the topline for cavities. The implemented script also enables the calculation of the parameters relating to segmented hills area (Table 1).
4
Journal of Biomimetics, Biomaterials and Biomedical Engineering Vol. 31
Table 1. Mean values of parameters concerning the surface elevation data stereometric individual samples Material research Parameter Number of reasons Average height [µm] The average circuit [µm] The average area [µm2] Average minimum diameter [µm] Average maximum diameter [µm] The average diameter of the standard [µm] The average diameter of the minimum angle [°] The average maximum angle diameter [°] Average equivalent diameter [µm] The average aspect ratio Mean increase Average roundness The average content Average orientation [°]
Sample 1
Sample 2
Sample 3
14 0.464 41.200 28.201 1.559 19.309 9.853 20.44 -71.822 5.860 0.220 12.515 0.096 0.308 71.822
24 0.718 35.245 16.242 0.937 16.482 8.404 57.489 -20.316 4.307 0.191 17.076 0.082 0.282 20.316
12 1.131 43.353 33.167 1.584 20.393 10.708 -7.773 80.661 6.379 0.211 13.631 0.099 0.312 99.339
Using the script also obtained parameters associated with the surface of the recesses (Table 2). Table 2. Mean values of the surface recesses for data stereometric individual samples Material research Parameter Number of reasons Average height [µm] The average circuit [µm] The average area [µm2] Average minimum diameter [µm] Average maximum diameter [µm] The average diameter of the standard [µm] The average diameter of the minimum angle [°] The average maximum angle diameter [°] Average equivalent diameter [µm] The average aspect ratio Mean increase Average roundness The average content Average orientation [°]
Sample 1
Sample 2
Sample 3
15 0.528 38.677 26.326 1.461 17.979 9.279 19.807 -71.916 5.556 0.235 11.990 0.105 0.322 71.916
24 0.633 35.924 16.272 0.939 16.257 8.352 66.450 -20.503 4.313 0.192 16.943 0.092 0.295 20.503
12 1.554 42.239 33.182 1.653 19.601 10.429 -6.515 80.381 6.382 0.229 12.031 0.108 0.327 99.619
The calculation of the parameters using the software MountainsMap® Premium. Stereometric data segmentation analyzed samples are also made with the software MountainsMap® Premium. Divisions of the surface of the sample on the themes (elevations and depressions) are designated by watershed segmentation algorithm, taking into account the filtering and thresholding. For this purpose, the data of the samples are loaded into the program. The three-dimensional view of the surface of the sample is created, and it is displaying elements such as scale, axis system, lock dimensions and identification card [20].
Journal of Biomimetics, Biomaterials and Biomedical Engineering Vol. 31
5
Operation analysis of the motives allows detection of elevations occurring on the surface tested. To reduce the detection of very local peaks, which may result from noise, used smoothing filter size of 3 × 3, and set the minimum height of the motives of 3% of the maximum height of surface. Generated are the parameters for all themes, such as the number of themes, the average, a mean, average perimeter, average equivalent diameter, mean average diameter, the average minimal average maximum diameter, the average minimum and maximum angle diameter, the average aspect ratio, lengthening the average, the average roundness, the average density, the average orientation [20]. Chutes areas are also extracted using the operations analysis motives. Used smoothing filter size of 3 × 3, and set the minimum height motifs equal to 3% of the maximum height of surface. At the same time they set the parameters for all segmented recesses surface [20]. To validate the parameters set for segmented altitude surface samples analyzed, summarizes the parameters that have been calculated using a script and those generated using the program MountainsMap® Premium (Table 3). Confirmation of the validity of the results is closely related to the verification of the functionality and usefulness of the script developed, designed for data analysis stereometric. Table 3. The values of parameters concerning the surface elevation data stereometric individual samples. Obtained using a script developed in Matlab and software MountainsMap® Premium Material research Program
Sample 1
Sample 2
Sample 3
Matlab
Mountains Map Premium
Matlab
Mountains Map Premium
Matlab
14
14
24
24
12
Average height [µm]
0.464
0.427
0.718
0.621
1.131
0.971
The average circuit [µm]
41.200
41.115
35.245
35.408
43.353
43.579
28.201
28.796
16.242
16.798
33.167
33.595
1.559
1.569
0.937
0.944
1.584
1.654
19.309
17.815
16.482
15.510
20.393
19.137
9.853
4.119
8.404
2.737
10.708
4.421
20.440
16.357
57.489
56.292
-7.773
-20.5
-71.822
-72.286
-20.316
-20.125
80.661
81.167
Parameter Number of reasons
The average area [µm2] Average minimum diameter [µm] Average maximum diameter [µm] The average diameter of the standard [µm] The average diameter of the minimum angle [°] The average maximum angle diameter [°]
Mountains Map Premium 12
6
Journal of Biomimetics, Biomaterials and Biomedical Engineering Vol. 31
Average equivalent diameter [µm] The average aspect ratio Mean increase Average roundness The average content Average orientation [°]
5.860
5.769
4.307
4.221
6.379
6.263
0.220
0.215
0.191
0.189
0.211
0.202
12.515
11.655
17.076
15.964
13.631
11.670
0.096
0.119
0.082
0.107
0.099
0.106
0.308
0.340
0.282
0.314
0.312
0.325
71.822
72.763
20.316
21.213
99.339
95.571
The relevant settings for segmented recesses of the surface of the analyzed samples are determined by using a script and program MountainsMap® Premium (Table 4). Table 4. The values for the surface recesses stereometric data for each sample obtained by using a script developed in Matlab software and MountainsMap® Premium Material research Program
Sample 1
Sample 2
Sample 3
Matlab
Mountains Map Premium
Matlab
Mountains Map Premium
Matlab
Mountains Map Premium
15
15
24
24
12
12
Average height [µm]
0.528
0.494
0.633
0.590
1.554
1.442
The average circuit [µm]
38.677
39.104
35.924
36.118
42.239
43.467
26.326
26.876
16.272
16.798
33.182
33.595
1.461
1.495
0.939
0.922
1.653
1.680
17.979
16.894
16.257
15.556
19.601
18.850
9.279
3.897
8.352
2.718
10.429
4.435
19.807
15.267
66.450
57.333
-6.515
-13.917
Parameter Number of reasons
The average area [µm2] Average minimum diameter [µm] Average maximum diameter [µm] The average diameter of the standard [µm] The average diameter of the minimum angle [°]
Journal of Biomimetics, Biomaterials and Biomedical Engineering Vol. 31
The average maximum angle diameter [°] Average equivalent diameter [µm] The average aspect ratio
-71.916
-72.667
-20.503
-20.75
80.381
80.833
5.556
5.467
4.313
4.217
6.383
6.269
0.235
0.221
0.192
0.183
0.229
0.209
Mean increase
11.990
11.079
16.943
16.458
12.031
11.255
Average roundness
0.105
0.125
0.092
0.109
0.108
0.113
0.322
0.347
0.295
0.315
0.327
0.335
71.916
73.337
20.503
21.2263
99.619
95.647
The average content Average orientation [°]
7
Discussion The analysis of the parameters determinated using a script developed in Matlab. Mean values of parameters concerning the surface elevation data stereometric individual samples. The number of separate, resulting in segmentation, elevations is the largest on the sample surface and the other is 24 motifs. In the case of the first sample segmented 14 rise by 2 more than a third of the sample surface. The sample is thus characterized by the third smallest of the analyzed samples the number of hills. However, their average height is the largest and is 1.131 µm. The lowest average height of the hills is characterized by a sample first (0.464 µm). Circuits and area hills are greatest for the third sample (average circumference: 43.353 µm, average surface area: 33.167 μm2), and the lowest for the second sample (average circumference: 35.245 µm, average surface area: 16.242 μm2). Second sample also has the smallest average value of minimum diameters (0.937 µm), the maximum diameters (16.482 µm), average diameter (8.404 µm) and a diameter equivalent (4.307 µm). In contrast to the third sample for which these parameters are the highest values (average diameter minimum: 1.584 µm, maximum: 20.393 µm, average: 10.708 µm equivalent: 6.379 µm). Similarly, the average of the maximum angles of the diameters has the largest sample value of the third (80.661 °) and the second smallest sample (-20.316 °), which is also the highest average angles of the smallest diameter of the theme of 57.489 °. The lowest value of this parameter, among the tested samples, a sample of the third (-7.773 °). Parameters such as aspect ratio, elongation, compactness and circularity are used to determine the horizontal shape of the motifs. Designs, wherein the aspect ratio, roundness and density, close to unity in a round shape. The values for these parameters motives of elongated shape are close to 0. Aspect ratio is informative parameter in wave-optics since it describes the wall size of the diffraction grating and diffraction angle. It could be different for every specie. Butterflies use the position of wings in dependence on ambient for control of vital functions. The geometry and sizes of wings differs and consequently, there is a variation of aspect ratio parameters at the scales. The highest average aspect ratio has a sample first (0.220). A similar value of the average aspect ratio has a third of the sample (0.211), which also has the highest average roundness (0.099) and compactness (0.312). Parameter values are not close to unity. You can not therefore speak of the motives in the shape of disks. The mean aspect ratio (0.191), the average roundness (0.082) and density (0.282) has a second sample, the surface of which is therefore the most longitudinal designs. This is also confirmed in the case of the highest sample mean aspect ratio equal 17.076. This
8
Journal of Biomimetics, Biomaterials and Biomedical Engineering Vol. 31
parameter for the motives of a shape similar to the disk is close to unity. A high value indicates an oblong shape theme. The lowest average elongation of a sample first is (12.515). On its surface are therefore the least elongated hills. The last parameter is the average orientation, that is, the average value of the angles of maximum diameters theme (between 0 ° and 180 °). The greatest value of this parameter characterizes sample and the third is 99.339 °, and the smallest second refers to a sample (20.316 °). Mean values on the surface recesses for data stereometric individual samples. Segmentation and surface depressions generated characterizing these parameters provided similar results for analysis inclines. Also on the surface of the second sample separated most, because 24 motifs. Least motifs set on the sample surface of the third - 12 motifs. The first sample has about 3 themes more. The average value of the height is greatest in the case of the third sample (1.554 µm), and the smallest for the first sample (0.528 µm). Both the average length of the circuit and the average surface area is greatest - as it was during the analysis hills - for the third sample (average circumference: 42.239 µm, average surface area: 33.182 μm2), and the lowest for the second sample (average circuit: 35.924 µm, average surface area: 16.272 μm2). Also, for the second sample average value of the minimum diameter (0.939 microns), maximum diameter (16.257 µm), average diameter (8.352 µm) and equivalent diameter (4.313 µm) has the smallest value. In contrast to the third sample for which these parameters are the highest (average diameter minimum: 1.653 µm, maximum: 19.601 µm, average: 10.429 µm, equivalent to 6.383 µm). The sample has the second smallest of the analyzed samples the average value of the angles of the greatest diameter theme (-20.503 °), but at the same time the highest average angles of the smallest diameter theme of 66.450 °. In contrast to the third sample, which has the highest average of the maximum angles of the diameters (80.381 °) and the smallest average diameter of the minimum angles (-6.515 °). The largest value of the average aspect ratio is characterized by a sample first (0.235). A similar parameter is the third sample of (0.229), which also has the highest average roundness (0.108) and density (0.327). Parameter values are not close to 1. It can not therefore speak of the motives in the shape of disks. The mean aspect ratio (0.192), the average of roundness (0.092), and the average density (0.295) has a second sample, which is characterized to be the most longitudinal recess. This is also confirmed in the case of the highest sample mean aspect ratio equal 16.943. The lowest average elongation of a sample first is (11.990). On its surface is, therefore, at least the longitudinal recess. The highest average value orientation has a third sample (99.619 °), and the smallest second refers to a sample (20.503 °). Light wave manipulation by surface structure is defined by a number of topography parameters. Motifs features define the size of the surface reflective diffraction grating. After analysis and comparison of parameters that can be found segmented motifs on the surface of the samples tested, it can be said that the first sample is characterized by the lowest height elevations and depressions. This is the black color scale which does not exhibit angle-dependent coloration. They are also the least extended. On the surface of the sample is the second most motifs. However, they have the smallest surface area and circumference and the most elongated shape. These small themes are responsible for characteristic diffraction grating effect. Also, the diameter and the maximum diameter angles motifs have the smallest value for this sample (the largest minimum angles of the diameters). In contrast to the third sample, the surface of which is at least motifs. Instead, they have the largest surface area, circumference and height. The sample is characterized by the longest major diameter and the maximum diameter angles (angles of the smallest minimum diameter). Themes of the third sample have an elongated shape. However, among the samples analyzed they are the most round and compact. It is also necessary to take into consideration that scales have inner structure and pigments which also play a role in coloration. By this reason the third sample has the largest average height of hills: the light continues propagation and interferes at the scales lamellas.
Journal of Biomimetics, Biomaterials and Biomedical Engineering Vol. 31
9
The analysis of the parameters calculated using the software MountainsMap® Premium. Software MountainsMap® Premium possible to obtain a surface analysis of test samples either graphically or by means of the parameters generated on the grounds. Segmentation of data stereometric carried out using the program was to verify the correctness of the results obtained from the use of the script, developed in Matlab. Verification of the results. Parameters related to segmented surface elevations and depressions, which were determined using a script implemented in Matlab and those generated by the software MountainsMap® Premium, have similar values. After their comparison it can be concluded that the segmentation method used in the script, which allows localized hills, and then the cavity surface samples and the method of calculating the parameters characterizing the individual motives, yielded very good results. List of parameters thus confirmed the correctness of the results obtained using the developed script, which is a functional tool to analyze the motives of surface samples. Conclusions In this study we focus on the experimental description of the wings surface. Stereometric analysis of the topography can find a place in the entomology. Since the insects applies the microand nano-size structures to ensure survival. These biological solutions can be useful in design of photonic and optical devices. The stereometric data of three samples was obtained using atomic force microscopy. Being a precision method of measurement, AFM ensures a good quality topography imaging. The data concern the two butterfly species: Euploea mulciber (known as “Striped Blue Crow”) and Morpho didius (also named as “Giant Blue Morpho”) showing a strong correlation color wings of the angle of incidence of light. Stereometric analysis allows investigation of topographical characteristics of the surface structures and textures. Comparison of the analyzed data and parameters shows differences between the surfaces of the different colored scales. The Matlab script was created: it provides segmentation of the 3D-topography and investigation of motives characteristics. It is possible to define the situation of the motives by means of watershed segmentation algorithm. The script concerns to the metrological problems of modern measurements and nanotechnology. The AFM topography scans were divided into mountains and lowness shapes. These forms have they individual characteristics in comparison to other shapes and forms. MountainsMap® Premium software was also applied for confirmation of the results precision. By comparison of the Matlab script results and values from the program, we can conclude that the script is functional and the found parameters are accurate and correct. In summary, this analysis proves to be a good method for estimation of micro- and nanotopography by processing of AFM data. Based on these results, a specific contact mechanical model for analysis with the finite element method (FEM) can be performed. Acknowledgements Research described in the paper was financially supported by the Ministry of Education, Youth and Sports of the Czech Republic under the project CEITEC 2020 (LQ1601), by project Sensor, Information and Communication Systems SIX CZ.1.05/2.1.00/03.0072 and by the Grant Agency of the Czech Republic under no. GAČR 15-05259S.
10
Journal of Biomimetics, Biomaterials and Biomedical Engineering Vol. 31
References [1]
[2] [3] [4] [5] [6] [7]
[8]
[9] [10] [11]
[12] [13] [14] [15]
[16] [17] [18] [19] [20]
[21]
[22]
F. Mika, J. Matějková-Plšková, S. Jiwajinda, P. Dechkrong, M. Shiojiri, Photonic Crystal Structure and Coloration of Wing Scales of Butterflies Exhibiting Selective Wavelength Iridescence. Materials 5 (2012) 754-771. Sh. Niu, B. Li, Zh. Mu, M. Yang, J. Zhang, Zh. Han, L. Ren, Excellent Structure-Based Multifunction of Morpho Butterfly Wings: A Review. J. Bionic Eng. 12 (2015) 170–189. Ş. Ţălu, Micro and nanoscale characterization of three dimensional surfaces. Basics and applications. Napoca Star Publishing House, Cluj-Napoca, Romania, 2015. J.A. Adam, Mathematics in Nature: Modeling Patterns in the Natural World, Princeton University Press, USA, 2003. J.G. Kingsolver, Butterfly Engineering. Sci. Am. 253, 2 (1985) 106-113. A. Gruverman, B.J. Rodriguez, S.V. Kalinin, Nanoscale electromechanical and mechanical imaging of butterfly wings by Scanning Probe Microscopy, JSPM, 1, 2 (2006) 74-78. L.P. Biro, Z. Balint, K. Kertesz, Z. Vertesy, G.I. Mark, Z.E. Horvath, J. Balazs, D. Mehn, I. Kiricsi, V. Lousse, J.-P. Vigneron, Role of photonic-crystal-type structures in the thermal regulation of a Lycaenid butterfly sister species pair. Phys. Rev. E, 67, 2 (2003), 021907(1-7). J. Zhang, Y. Liang, J. Mao, X. Yang, Zh. Cui, Sh. Zhu, Zh. Li, 3D microporous Co3O4carbon hybrids biotemplated from butterfly wings as high performance VOCs gas sensor. Sensor Actuat. B-Chem. 235 (2016) 420–431. K. Liu, A. Vitae, L. Jiang, Bio-inspired design of multiscale structures for function integration. NanoToday 6, 2 (2011) 155–175. T. Alieva, F. Agullo-Lopez, Optical wave propagation of fractal fields. Opt. Commun. 124 (1996) 267-274. Ş. Ţălu, Mathematical methods used in monofractal and multifractal analysis for the processing of biological and medical data and images. Anim. Biol. Anim. Husb., 4, 1 (2012) 1-4. Ş. Ţălu, Texture analysis methods for the characterisation of biological and medical images. Extreme Life, Biospeology & Astrobiology, 4, 1 (2012) 8-12. R. Jovani, L. Perez-Rodrıguez, F. Mougeot, Fractal geometry for animal biometrics: a response to Kuhl and Burghardt. Trends Ecol.Evol. 28 (2013) 499-500. L. Perez-Rodriguez, R. Jovani, F. Mougeot, Fractal geometry of a complex plumage trait reveals bird's quality, P Roy. Soc. Edinb. B 280 (2013) 1755. A.A. Castrejón-Pita, A. Sarmiento-Galán, J.R. Castrejón-Pita, R. Castrejón-García, Fractal Dimension in Butterflies’ Wings: a novel approach to understanding wing patterns? J. Math. Biol., 50, 5 (2005) 584-594. D. Dallaeva, P. Tomanek, AFM study of structure influence on butterfly wings coloration, AEEE 10, 2 (2012) 120-124. D. Dallaeva, Sh. Ramazanov, E. Prokopyeva, P. Kaspar, P. Tománek, AFM Imaging of natural optical structures. AEEE 12, 6 (2014) 639-644. MathWorks® documentation for Matlab, http://www.mathworks.com/help MountainsMap® 7 Software (Digital Surf, Besançon, France). Available from: http://www.digitalsurf.fr (last accessed February 10th, 2017). S. Stach, Ż. Garczyk, Ş. Ţălu, S. Solaymani, A. Ghaderi, R. Moradian, B. Nezafat Negin, S.M. Elahi, H. Gholamali, Stereometric Parameters of the Cu/Fe NPs Thin Films, J. Phys. Chem. C, 119, 31 (2015) 17887-17898. DOI: 10.1021/acs.jpcc.5b04676. S. Stach, W. Sapota, Ş. Ţălu, A. Ahmadpourian, C. Luna, N. Ghobadi, A. Arman, M. Ganji, 3-D surface stereometry studies of sputtered TiN thin films obtained at different substrate temperatures, J Mater Sci: Mater. Electron, 28, 2 (2017) 2113 - 2122. DOI: 10.1007/s10854016-5774-9. R. Leach, Characterisation of Areal Surface Texture, Springer, Berlin, 2013.