Journal of Mechatronics, Electrical Power, and Vehicular Technology 8 (2017) 95–102
Journal of Mechatronics, Electrical Power, and Vehicular Technology e-ISSN: 2088-6985 p-ISSN: 2087-3379
www.mevjournal.com
The performance of surface barrier discharge in magnetic field driven by half bridge series resonance converter Fri Murdiya a, *, Febrizal a, Amun Amri b a Department of Electrical Engineering, Faculty of Engineering, Universitas Riau Jl. H.R. Subrantas KM. 12,5 Kampus Binawidya Simpang Baru Panam, Pekanbaru, Riau, Indonesia b Department of Chemical Engineering, Faculty of Engineering, Universitas Riau Jl. H.R. Subrantas KM. 12,5 Kampus Binawidya Simpang Baru Panam, Pekanbaru, Riau, Indonesia
Received 25 September 2017; received in revised form 13 December 2017; accepted 15 December 2017 Published online 28 December 2017
Abstract This paper reports an application of a series resonance converter as a high voltage generator to drive a surface barrier discharge with a magnetic field. The high voltage was about 5 kV with the frequency of 25 kHz. It was connected to circular aluminum plates as the anode electrode and a rectangular aluminum plate as the cathode electrode. These electrodes were separated by a glass dielectric as the barrier. The experiment result indicated that the discharge current with magnetic field was lower than without magnetic field. The plasma on the surface barrier with magnetic field was more luminous than without magnetic field. It also indicated that the area of Lissajous diagram for the surface barrier discharge with magnetic field was slightly decreased than without magnetic field. It could be concluded that the magnetic field affects the plasma progress on the surface barrier. Molecular dynamic (MD) could be used in understanding the ionization process of air molecules. The ionization energies for CO2, N2, and O2 were 0.0502 kcal/mol, 0.0526 kcal/mol and 0.430 kcal/mol, respectively in 1,000 seconds. The highest ionization energy was O2. ©2017 Research Centre for Electrical Power and Mechatronics - Indonesian Institute of Sciences. This is an open access article under the CC BY-NC-SA license (https://creativecommons.org/licenses/by-nc-sa/4.0/). Keywords: Surface barrier discharge; magnetic field; series resonance converter; molecular dynamic; ionization energy.
I. Introduction High voltage plasma generator has been used in many areas such as in medical, chemistry, physics, etc. This technology includes high voltage generator, electrodes, and dielectric. One way to get the plasma is by increasing the voltage until that material was initiated into the plasma (discharge) and eyes can see it. In the theory of high voltage engineering, the plasma formation process is the unsuccessful of the material to defend itself as an insulating material. This process was known as electron discharges or gas ionization. High voltage plasma technology was applied in the ozone generation, bacteria destruction in the drinking water, decomposition of dangerous organic compounds in the drinking water and also the decomposition of NOx compounds from diesel engine fumes [1], [2]. Ayman et al. reported about decomposition of naphthalene * Corresponding Author. Tel: +62 812 8881 6276 E-mail address:
[email protected]
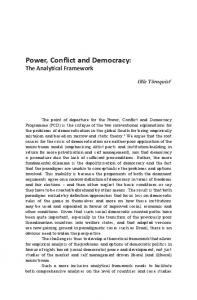
using high voltage with mica dielectric material [3], [4]. In this decomposition, ozone is needed. This ozone was formed from oxygen using high voltage plasma. Lukes et al. have designed cylindrical electrodes and a ceramic dielectric made of aluminum compounds (Al2O3) to produce plasma in the water [5]. Currently, the most common application of the high voltage plasma generators is the ozone generator through an air ionization process under corona exposure with dc voltage [6]. In order to produce high voltage plasma in the reactor, there are some configurations of barrier discharge such as cylindrical, planar, and surface barrier discharges as presented in Figure 1. The presence of dielectric layer between metallic electrodes is to increase the electric field density in the gap or surface and it leads to occur the barrier discharge process in the gap. Typical materials for dielectric barriers are glass, teflon, acrylic, quartz, and ceramics. The most important characteristics in dielectric barrier discharge are the presence of a capacitive coupling of
https://dx.doi.org/10.14203/j.mev.2017.v8.95-102 2088-6985 / 2087-3379 ©2017 Research Centre for Electrical Power and Mechatronics - Indonesian Institute of Sciences (RCEPM LIPI). This is an open access article under the CC BY-NC-SA license (https://creativecommons.org/licenses/by-nc-sa/4.0/). Accreditation Number: (LIPI) 633/AU/P2MI-LIPI/03/2015 and (RISTEKDIKTI) 1/E/KPT/2015.
F. Murdiya et al. / Journal of Mechatronics, Electrical Power, and Vehicular Technology 8 (2017) 95–102
96
Figure 1. Dielectric barrier discharge configuration; (a). Cylindrical barrier discharge; (b) Planar barrier discharge; (c) Surface barrier discharge [7]
the insulation material that can be driven by high frequency alternating current and pulsed dc voltage as well [7]. Power supply with the frequency from 22 kHz to 50 kHz has been used to initiate plasma between the electrode and dielectric material. High frequency was chosen for this power supply to decrease the transformer dimension. This transformer was used to convert low voltage into high voltage up to 8 kV [1]. Salam et al. reported another research about power supply without transformer, for then it can be applied to make ozone from oxygen [8]. This power supply used the boost converter with a voltage of 4 kV. Fly back converter was also used to initiate dielectric barrier discharge for argon initiation process [9], [10]. T. C Manley proposed the measurement technique of power dissipation from high voltage plasma generator using Lissajous diagram as referring to Figure 2 [11]. In addition, it was also used in high voltage research like oil insulation test using Sawyer-Tower circuit [12]. In order to determine Lissajous figure as referring to Figure 2, we can use the formula for the electric energy consumed per voltage cycle ( 𝐸𝑒𝑙 ) and the electric power (𝑃𝑒𝑙 ). The electric energy consumed per voltage cycle 𝐸𝑒𝑙 is closed integral of applied voltage (U) and total charge (Q), and it can be derived by using equation (1). 𝐸𝑒𝑙 = ∮ 𝑈(𝑡)𝑑𝑄
(1)
Park et al. investigated the characteristic of plasma by using multi needles as high voltage electrodes, which were placed above the dielectric material [13]. There was a gap between the needles and the dielectric material. In this experiment, he was also investigated
the effect of magnetic field on the performance of plasma. The position of the magnetic field was perpendicular to the electric field [13]. Pakarek et al. also research the use of a needle as a high-voltage electrode [14]. The position of the permanent magnet was parallel to the needle electrode. The permanent magnet induced the movement of electrons after the plasma released in the gas insulation [14]. Liu et al. conducted a study to figure out the differences between planar barrier discharge in the magnetic field and without a magnetic field in the air. The nanosecond pulsed power source was installed on the planar barrier discharge. It was found that the characteristics of barrier discharge in magnetic field and without magnetic field were slightly different [15]. Generally, another investigation is the surface barrier discharge to produce the ozone gas. The researchers have applied this technology, and they did not considered the effect of the magnetic field to plasma progress. The comparison of the performance of surface barrier discharge with and without magnetic field is very interesting. These data will answer why we should use magnetic field to produce plasma on the surface barrier. The effect of the magnetic field on the surface barrier discharge needs to be verified by several things such as plasma, discharge current, and power dissipation, etc. In order to study the differences between surface barrier discharge with magnetic field and without magnetic field, we need to do research. In this research, a high voltage plasma generator has been tested using an aluminum plane electrode and a glass dielectric. It was controlled by a high voltage power supply up to voltage level of 5 kV with the frequency of 25 kHz using an LC resonance oscillation circuit. This power supply converts the dc input voltage into high voltage up to 5 kV using a Ferrite transformer. In this investigation, we attempted to find the effect of the magnetic field to the surface barrier discharge progress on the surface glass material as a dielectric. Some measurements have been done such as power dissipation, current, and output voltage of the plasma generator. We used air as the gas insulation.
II. Molecular dynamic theory
Figure 2. U-Q Lissajous figure [11]
The general content of the air consists of several elements of gases such as N2, CO2, and O2. Air ionization is caused by sunlight, high electric fields and collisions between electrons from gas molecules. This ionized air in high voltage leads to the event of isolation
F. Murdiya et al. / Journal of Mechatronics, Electrical Power, and Vehicular Technology 8 (2017) 95–102
failure or better known as the failure process of Streamer and Townsend. In order to study on ionized air, molecular dynamic (MD) can be used to understand the ionization process of the molecule. MD was developed to provide a thermodynamically accurate mess scale model capable of describing nonequilibrium process such as shocks. There are many factors that will influence to the MD simulation. The important characteristic of MD simulation is the Planck constant [16], [17]. The Planck constant (denoted ℎ, also called Planck's constant) is a physical constant that is the quantum of action, central in quantum mechanics. Generally, it can be written as follow: 𝐸 = ℎ𝑣
III. Research Method A. Experimental set-up
(2)
where 𝐸 is energy, ℎ is planck constant and 𝑣 is frequency. Based on this equation, if the energy is higher, planck constant and frequency is also will be increasing. The other factor is volume, the original formulation of the isothermal-isobaric ensemble can be traced back to 1939, where Guggenheim wrote the partition function, ∆(𝑁, 𝑃, 𝑇), as follow: (3)
∆(𝑁, 𝑃, 𝑇) = 𝑋 𝑉 𝑄(𝑁, 𝑉, 𝑇)𝑒 − 𝑃 𝑉 /𝑘𝐵𝑇
where kB is Boltzmann constant, 𝑄(𝑁, 𝑉, 𝑇) is the canonical ensemble partition function of a system composed of 𝑁 particles held in a volume 𝑉 , and at a temperature 𝑇, and 𝑃 is the external pressure to which the system is exposed as the volume is allowed to fluctuate. The third factor is timing, time-dependent statistical mechanics is important in the MD simulation. Firstly, in recent years, there have been significant advances in the understanding of molecular dynamics algorithms, which have arisen out of an appreciation of the formal operator approach to classical mechanics. Second, an understanding of equilibrium time correlation functions, their link with dynamical properties, and especially their connection with transport coefficients, is essential in making contact with experiment. Third, the last decade has seen a rapid development of the use of nonequilibrium molecular dynamics, with a better understanding of the formal aspects, particularly the link between the dynamical algorithm, dissipation, chaos, and fractal geometry [18], [19].
The experiment was carried out by arranging the electrical circuit in Figure 3. High Voltage generator was installed at the left side of Figure 3 such as a half bridge converter and it was connected to an LC resonance and then, they were connected to a ferrite transformer with ratio 1:200. The input power supply was 220 V AC and frequency of 50 Hz and 150 Watt. The frequency of resonance converter was 25 kHz. The maximum output voltage at seconder ferrite transformer was about 5 kV. The seconder transformer terminal was connected to an anode electrode (circular aluminum plate with dimension 8 cm in diameter and thickness of 1 mm) and the cathode electrode (aluminum plates with dimension 100 mm x 100mm x 1mm) was connected to another side of transformer terminal. A dielectric glass (with dimension 100x100x5 in mm) was put above the cathode electrode. This dielectric was the window glass. If the high voltage power supply was energized, it would initiate electrical discharge (plasma) in the air on the surface barrier. We installed a permanent magnet under a cathode electrode with a density of magnetic field in this research was about 315 mT, it was measured by FH51 gauss tesla meter. The plasma occurred on surface barrier was recorded by a digital camera (Sony Xperia 14 Megapixels). The high voltage power supply was measured by using a high voltage probe P2300C and it was connected to a digital oscilloscope (Hantek bmv5200). In order to achieve Lissajous figure, the voltage of capacitor Cs was measured by an oscilloscope probe with setting 1x and it was known as Sawyer-Tower circuit [12]. Discharge current was recorded by Hantek cc650 probe. During the experiment, the free air was used in this study. We did not use a pump to spray air into the discharge medium. The experiment was conducted under room temperature and air pressure of 1 atm. We compared the properties of surface barrier discharge progress in the magnetic field (model I) and without magnetic field (model II).
High Voltage Probe P2300C 300 MHz _Metal Plate Camera Gap 0.5 cm
AC 220 V 50 Hz
C
Half Bridge
L
97
Magnet
Glass 5 mm Cs
Ferrite Transformer 1 : 200
Current Probe CC650 Hantek
Figure 3. Schematic diagram of experiment
Hantek Oscilloscope
F. Murdiya et al. / Journal of Mechatronics, Electrical Power, and Vehicular Technology 8 (2017) 95–102
98
B. Molecular Dynamic Simulation Molecular dynamics simulation consists of a stepby-step numerical solution of the classical equations of motion. In addition, calculations might give a guide to the “best” molecular force-field; also a comparison of simulation results with thermo physical properties and vibration frequencies was invaluable in force-field development and refinement. A separate family of force fields, such as AMBER17, AMBER18, CHARMM19, and OPLS20 was geared to larger molecules (proteins, polymers) in condensed phases; their functional form was simpler. A preliminary study of molecular dynamics simulation was performed using NAMD (NAnoscale Molecular Dynamics program; v 2.9), it has been done to see the ionization process of gas O2, N2, CO2. CHARMM19 (Chemistry at HARvard Macromolecular Mechanics) was selected as a force field, NPA was then used as an algorithm and NVT was used as an ensemble parameter [16]. 315 mT
0 mT
Figure 5. Result of typical of plasma in magnetic field and without magnetic field
IV. Results and discussion A. Surface barrier discharge The development of plasma on surface barrier was occurred because of air failure to maintain itself as the gas insulation. This was also marked by the use of high voltage with high frequency that can decrease the air breakdown voltage and the air can be ionized. This ionized air (especially oxygen) easily formed itself into an ozone gas. The charge transfer on surface dielectric material was mainly determined by the sort of dielectric and the width of the gas gap. The surface barrier discharge released the plasma and it was fully separated at the end of electrode. The color of plasma was purple. Both plasmas developed on the surface barrier in magnetic field and without magnetic field were shown in Figure 4. The plasma on surface barrier was sometimes clearly displayed or not clearly displayed for both models in magnetic field and without magnetic field. We attempted to take pictures until a half hour when the plasma progress on the surface barrier. In the investigation of surface barrier discharge, the development of plasma on surface barrier was unstable discharge. It was shown that plasma in the model with magnetic field was more luminous rather than without magnetic field as they were presented in Figure 4 and
Figure 5. Both plasmas progressed in the models with magnetic field and without magnetic field showed similar types of plasma as presented in Figure 5. They produced many micro discharges at the end side of the circular electrode. The applied voltage that was connected to an anode electrode was maximum 5 kV and the frequency was 25 kHz. The applied voltage and discharge current were sinusoidal waves. The development of plasma on the surface barrier in the model with magnetic field was started from zero to a positive half cycle of apply voltage and then, it also progressed at a half of negative cycle as shown in Figure 6. There were many current pulses for both cycles. However, for the model II, the current pulses occurred at both positive and negative cycles of apply voltage, refer to Figure 7. The current pulses occurred at near end of a half cycle of apply voltage. There were no pulses at the maximum or minimum value of current. However, plasma progressed in the model with magnetic field (model I) contributed the current pulses at the maximum or minimum value of current, and after a quarter cycle of apply voltage, there were no pulses for both negative and positive cycles until the current Applied Voltage
3.0
3
1.5
0
0 -1.5
-3
0 mT
-3.0
Pulses generation
-6
315 mT
Discharge Current
0
20
40
60
Current (mA)
Voltage (kV)
6
80
Time (us)
Figure. 4. Result of surface barrier discharge in magnetic field and without magnetic field
Figure 6. Apply voltage and discharge current graphs in magnetic field
F. Murdiya et al. / Journal of Mechatronics, Electrical Power, and Vehicular Technology 8 (2017) 95–102
Applied Voltage
6
were released from a circular electrode at every quarter cycle of apply voltage. However, it was different to the series of micro discharges in the model without magnetic field, they have released almost a half cycle of apply voltage. U-q Lissajous parallel diagram shapes for surface barrier discharge in the model without magnetic field and in the model with magnetic field was presented in Figure 8. During the experiment, it was difficult to find stable area of Lissajous figures for both models. The area always varied versus discharge times. However, the figures of Lissajous were almost similar with many pulses. It was indicated that the Lissajous figures that recorded by using a digital oscilloscope were the electrical discharge in air. The area Lissajous for both were almost similar
Discharge Current
1.5
0
0 -1.5
-3
-3.0
Pulses generation
-6 0
20
40
60
Current (mA)
Voltage (kV)
3.0 3
99
80
Time (us)
Figure 7. Apply voltage and discharge current graphs without magnetic field
B. Molecular dynamic simulation
manages to zero. It also shown that the current amplitude for the model without magnetic field was higher than with magnetic field. The amplitude of current in the model without magnetic field was about twice of the current in the model with magnetic field. Every current pulse corresponded to a series of micro discharges on the surface barrier material [7]. From Figure 6, it could be concluded that the series of micro discharges in the model with magnetic field
In order to study on ionized air, molecular dynamic can be used to understand the ionization process of the molecule. For the CO2 molecule, the best pose selected was time value of 1,000 s, energy of 0.0502 kcal/mol, and a temperature of 120.440 K, respectively. Like the other gas, the N2 molecule was seen to be stable for the ionization process. From the best poses, time value of 1,000 s, energy of 0.0526 kcal/mol, with a temperature
(a)
(b) Figure 8. Lissajous diagram for surface barrier discharge; (a) without magnetic field; (b) in magnetic field
100
F. Murdiya et al. / Journal of Mechatronics, Electrical Power, and Vehicular Technology 8 (2017) 95–102
of 205.949 K. Based on the molecular dynamics results, the ionization process of molecule O2 occurred at the time value of 1,000, the energy of 0.430 kcal/mol, and a temperature of 0.0104. The ionization process in CO2, N2 and O2 were presented in Figures 9, 10, and 11, respectively.
Molecule CO2 was seen to be able to ionize since this CO2 molecule observed the energy and the lowest time, respectively. The pink dot was shown the stable condition of molecule CO2. Like the other gas, the N2 molecule was seen to be stable for the ionization process. Likewise, in the case of gas O2, based on the
Figure 9. The ionization process of CO2 molecule
Figure 10. The ionization process of N2 molecule
F. Murdiya et al. / Journal of Mechatronics, Electrical Power, and Vehicular Technology 8 (2017) 95–102
101
Figure 11. The ionization process of O2 molecule
Table 1. Simulation result Gases CO2 N2 O2
Energy (kcal/mol) 0.0502 0.0526 0.430
molecular dynamic results, it shown that the gas (O2) was ionized on time value of 1,000, energy of 0.430 kcal/mol. The simulation result in Table 1 presented the ionization energy. It was shown that the ionization in N2 gas was easier than O2 gas.
V. Conclusion The effect of magnetic field for producing plasma on the surface barrier had a very detail difference with the surface barrier discharge without magnetic field. The current produced by the plasma progressed on surface barrier with magnetic field was lower than the current produced by the plasma progressed on surface barrier without magnetic field. The amplitude of current for the model I was almost a half of current for the model II. There were many current pulses in the both models. These pulses indicated that micro discharges developed on the surface dielectric material for both of these models. The micro discharges in the model I occurred for a quarter cycle of apply voltage. However, it was different with the micro discharges in the model II that was occurred almost of a half cycle of applied voltage. The plasma progressed on surface barrier in magnetic field was more luminous than the plasma progressed on surface barrier without magnetic
field. The typical of micro plasma released from a circular electrode was similar for both plasma models. The typical Lissajous figures for both models were similar with many pulses. It also can be concluded that the effect magnetic field will influence the plasma progress on the surface barrier. Molecular dynamic can be used to understanding the ionization process of molecule. The ionization process can be obtained by using the energy ionization. The ionization in N2 gas was easier than O2 gas.
Acknowledgement We thanks Kementerian Ristek-Dikti for financial support through Penelitian Produk Terapan 2017.
References [1] N. Osawa et al., “Investigation on reactor configuration of nonthermal plasma catalityc hybrid method for NOx removal of diesel engine exhaust”, International Journal of Plasma and Enviromental Science and Technology, Vol. 6, No.2, September 2012. [2] K. Shimizu et al., “Water treatment by low voltage discharge in water”, International Journal of Plasma and Enviromental Science and Technology, Vol. 4, No.1, March 2010. [3] Ayman A.A et al., “Influence of applied voltage waveforms on the performance of surface dielectric barrier discharge reactor for decomposition of naphthalene”, Journal of Physics D: Applied Physics, Vol. 48, No. 19, 2015. [4] Ayman A.A, et al.,” Influence of nitrogen excited species on the destruction of naphthalene in nitrogen and air using surface dielectric barrier discharge,” Journal Of Hazardous Materials 246-247, December 2012, c:26-33 · [5] P. Lukes et al., “Pulsed Electrica Discharge in Water Generated Using Porous-Ceramic-Coated Electrodes”, IEEE Transactions On Plasma Science, Vol. 36, No. 4, August 2008
102
F. Murdiya et al. / Journal of Mechatronics, Electrical Power, and Vehicular Technology 8 (2017) 95–102
[6] J. Chen and P. Wang, “Effect of Relative Humidity on Electron Distribution and Ozone Production by DC Coronas in Air,” IEEE Transactions on Plasma Science, Vol. 33, , 2005, pp.808812. [7] H.-E. Wagner et al., ”The barrier discharge: basic properties and applications to surface treatment”, Vacuum, Vol. 71, Issue 3, 19 May 2003, Pages 417–436 [8] Z. Salam et al., "Transformerless power supply based on single switch resonant inverter for ozone generation," 2013 TwentyEighth Annual IEEE Applied Power Electronics Conference and Exposition (APEC), Long Beach, CA, USA, 2013, pp. 3330-3333. [9] C. Yong-Nong and K. Chih-Ming, “Design of Plasma Generator Driven by High-frequency High-voltage Power Supply”, Journal of Applied Research and Technology, Vol. 11, 2013, pp.225-234. [10] V. J. Law et al., ” Handheld Flyback driven coaxial dielectric barrier discharge: Development and characterization”, Review of Scientific Instruments, Vol. 79, Issue 9, 2008. [11] T.C. Manley, “The Electric Characteristics of the Ozonator Discharge”, J. Electrochem. Soc. 1943 Vol. 84, issue 1, 83-96. [12] F. Murdiya et al., "Creeping discharge developing on vegetablebased oil / pressboard interface under AC voltage," in IEEE
[13]
[14]
[15]
[16]
[17] [18]
[19]
Transactions on Dielectrics and Electrical Insulation, Vol. 21, no. 5, 2014, pp. 2102-2110. J.Y Park et al., ”NOx Removal Using DC Corona Discharge with Magnetic Field”Combustion Science and Technology, Vol. 133 Issue 1-3, 1998, pp. 65-77, Taylor & Francis S. Pekarek “Experimental Study of Nitrogen Oxides and Ozone Generation by Corona-Like Dielectric Barrier Discharge with Airflow in a Magnetic Field”. Plasma Chem Plasma Process, Vol. 37, 2017, pp. 1313–1330, Springer Y. Liu et al., “ The impacts of magnetic field on repetitive nanosecond pulsed dielectric barrier discharge in air “, Physic of Plasmas, Vol. 23, 2016. M. J. Uline and D. S. Corti, “Molecular Dynamics at Constant Pressure: Allowing the System to Control Volume Fluctuations via a “Shell” Particle”. Entropy 2013, 15, 3941-3969. H. H. Rugh, “Dynamical approach to temperature”. Phys. Rev. Lett. 1997, 78, 772–774. O. G. Jepps et al., “Microscopic expressions for the thermodynamic temperature”. Phys. Rev. E. 2000, 62, 4757– 4763. K. P. Travis and C. Braga, “Configurational temperature and pressure molecular dynamics: Review of current methodology and applications to the shear flow of a simple fluid”. Mol. Phys. 2006, 104, 3735–3749.