3 Mitsubishi Electric Research Labs, Cambridge, MA 02139, USA. Email: {Peter. ... environments, the capacity of wireless MIMO systems can be- come very low ...
MITSUBISHI ELECTRIC RESEARCH LABORATORIES http://www.merl.com
Keyhole Effects in MIMO Wireless Channels - Measurements and Theory
Almers, P.; Tufvesson, F.
TR2003-136
December 2003
Abstract It has been predicted theoretically that for some environments, the capacity of wireless MIMO systems can become very low even for uncorrelated signals; this effect has been termed keyhole or pinhole. In this paper the first unique measurements of this effect are presented. The measurements were performed in a controlled indoor environment that was designed to obtain a keyhole. We analyze limitations for measurement-based capacity calculations and keyhole investigations. We further present error bounds for the capacity and eigenvalue distributions due to measurement imperfections such as finite signal-to-noise ratio and multipath leakage. The bounds are compared to the measurement results and show excellent agreement. Finally, we analyze the envelope distribution and, as expected from theory, if follows a double Rayleigh.
This work may not be copied or reproduced in whole or in part for any commercial purpose. Permission to copy in whole or in part without payment of fee is granted for nonprofit educational and research purposes provided that all such whole or partial copies include the following: a notice that such copying is by permission of Mitsubishi Electric Research Laboratories, Inc.; an acknowledgment of the authors and individual contributions to the work; and all applicable portions of the copyright notice. Copying, reproduction, or republishing for any other purpose shall require a license with payment of fee to Mitsubishi Electric Research Laboratories, Inc. All rights reserved. c Mitsubishi Electric Research Laboratories, Inc., 2003 Copyright 201 Broadway, Cambridge, Massachusetts 02139
MERLCoverPageSide2
Publication History: 1. First printing, TR-2003-136, December 2003
Keyhole Effects in MIMO Wireless Channels Measurements and Theory Peter Almers1,2 , Student Member, IEEE, Fredrik Tufvesson1 and Andreas F. Molisch1,3 , Senior Member, IEEE 1
Dept. of Electroscience, Lund University, Box 118, SE-221 00 Lund, Sweden. 2 TeliaSonera AB, Box 94, SE-201 20 Malmö, Sweden. 3 Mitsubishi Electric Research Labs, Cambridge, MA 02139, USA. Email: {Peter.Almers, Fredrik.Tufvesson, Andreas.Molisch}@es.lth.se
Abstract— It has been predicted theoretically that for some environments, the capacity of wireless MIMO systems can become very low even for uncorrelated signals; this effect has been termed ”keyhole” or ”pinhole”. In this paper the first unique measurements of this effect are presented. The measurements were performed in a controlled indoor environment that was designed to obtain a keyhole. We analyze limitations for measurement-based capacity calculations and keyhole investigations. We further present error bounds for the capacity and eigenvalue distributions due to measurement imperfections such as finite signal-to-noise ratio and multipath leakage. The bounds are compared to the measurement results and show excellent agreement. Finally, we analyze the envelope distribution and, as expected from theory, if follows a double Rayleigh
effect experimentally. The measurements were performed in a controlled indoor environment, where the propagation from one room to the next could only occur through a waveguide or a hole in the wall. The measurement results show almost ideal keyhole properties; the capacity is low, the rank of the transfer matrix is nearly one though the correlation between the antenna elements is low. The experiments were based on a theoretical analysis of the requirements on both the measurement parameters and the considered environment, for finding keyholes in MIMO measurement. We present this analysis, error bounds for the capacity and eigenvalue distributions due to measurement imperfections.
I. I NTRODUCTION Multiple-input multiple-output (MIMO) wireless communication systems are systems that have multi-element antenna arrays at both the transmitter and the receiver side. It has been shown that they have the potential for large informationtheoretic capacities, since the system can provide several independent communication channels between transmitter and receiver [1]. In an ideal multipath channel, the MIMO capacity is approximately N times the capacity of a single-antenna system, where N is the smaller of the number of transmit or receive antenna elements. Correlated signals at the antenna elements leads to a decrease in the capacity - this effect has been investigated both theoretically [2][3], and experimentally [4]. It has recently been predicted theoretically that for some propagation scenarios, the MIMO channel capacity can be low (i.e., comparable to the SISO capacity) even though the signals at the antenna elements are uncorrelated [5][6]. This effect has been termed ”keyhole” or ”pinhole”.1 It is related to scenarios where rich scattering around the transmitter and receiver leads to low correlation of the signals, while other propagation effects, like diffraction or waveguiding, lead to a rank reduction of the transfer function matrix. Several previous measurement campaigns have searched for the keyhole effect due to corridors, tunnels, or diffraction in real environments, but the effect has been elusive and, to our knowledge, no unique measurements of a keyhole have been presented in the literature. In this paper, we present the results of a unique measurement campaign that for the first time shows the keyhole
II. C APACITIES AND KEYHOLES With the assumption of flat fading, we use the conventional MIMO model for the received signal vector as
1 We are using in this paper the original definition of keyholes. Recently, some authors have called ”keyhole” any scenario that shows a reduction of the rank of the transfer function matrix (compared to the i.i.d. complex Gaussian case). This definition would imply that any scenario with strong correlation (small angular spread) is a ”keyhole”.
(1)
y = Hx + N,
where Hi is the channel transfer matrix normalized as, h 2 E kHkF = NR NT , x is the transmitted signal vector, and ¢ ¡ N ∈CN 0, σ2n I represents noise. For equal power allocation between the transmitter elements the channel capacity [bit/s/Hz] for the channel model in (1) can be calculated as [1] µ µ ¶¶ γ C = log2 det I + eval HH† (2) NT µ ¶ K X γ eval ¯¯ (H) ¯¯2 log2 1 + = (3) ¯s ¯ , NT k k=1
(H)
†
where [·] denotes the complex conjugate transpose, sk , is the k :th singular value of H and γ eval is the signal-to-noise ratio (SNR) that the capacity is evaluated for. The latter is defined as i h E hkl h†kl σ2 1 i = 2h = 2 , γ eval = h (4) † σ σ n n E n n kl kl
where E [·] is the expectation, hkl and nkl are the kl entry in H and N, respectively, σ 2h is the variance of the complex entries in H. It is assumed that x has unity energy. It is well known that correlation between the antenna elements at the transmitter or receiver reduces the capacity. The channel transfer matrix is often modeled as [2][7][8]:
0-7803-7975-6/03/$17.00 (C) 2003
1/2
T /2
H = RR GRT ,
(5)
[mm]
noise include thermal noise, interference and channel changes during the measurements. The measurements yielded the elements of the channel matrix H, and via Eq. 2, the capacity. This allows plotting a cumulative distribution of the capacity and the determination of the outage capacity [1]. In order to compare the capacity reduction due to correlation to the capacity reduction due to the keyhole effect, we ˆ T and R ˆ R from the first estimate the correlation matrices R measurements as
1300 Shielded chamber
40 600
420
300
16 7
0
2070 60 0
30 0
Network analyzer
5400
40
Absorbing material 11000
=
ˆR R
=
5400
Fig. 1.
1/2
ˆT R
Overview of the measurement setup.
1/2
where RR and RT describes the correlation between the signals at receiver and transmitter elements, respectively, and G is a matrix with independent and identically distributed (i.i.d.) complex Gaussian entries, G ∈ CN (0, I). The square ¡ ¢† root is defined as R1/2 R1/2 = R. According to this model, the channel, and thus the capacity, is completely determined by the correlations at transmitter and receiver. However, in [5] it is shown that a more general model is 1/2
T /2
H = RR GR T1/2 GT RT ,
(6)
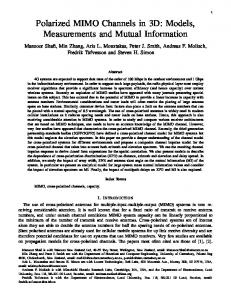
where GR and GT are both i.i.d. complex Gaussian matrices, and where T1/2 describes the transfer matrix between the transmitter and receiver environments. For a perfect keyhole, e.g. a single-mode waveguide [6] between the transmitter and the receiver environment, T1/2 has rank one. This results in a total channel transfer matrix, H, of rank one as well, even 1/2 1/2 though RR , RT , GR and GT have full rank. III. M EASUREMENT SETUP The measurements were performed with one antenna array located in a shielded chamber, and the other array in the adjacent room. A hole in the chamber wall was the only propagation path between the rooms. We measured three different hole configurations: 1) A hole of size 47 × 22 mm with a 250 mm long waveguide attached (referred to as ”waveguide”). 2) A hole of size 47 × 22 mm without waveguide (”small hole”). 3) A hole of size 300× 300 mm without waveguide (”large hole”). The large hole is intended as test measurement, in which we do not anticipate a keyhole effect. Linear virtual arrays with 6 antenna positions and omnidirectional conical antennas are used both at the transmitter and the receiver; the measurements were done during night time to ensure a static environment. In Fig. 1 an overview of the measurement setup is presented. The measurements were performed using a vector network analyzer (Rohde & Schwarz ZVC) at 3.5 − 4.0 GHz, where M = 101 complex transfer function samples spaced 5 MHz apart were recorded. The received signal was amplified by 30 dB with an external low noise power amplifier to achieve a high SNR. The measurement SNR was estimated to 26 dB, where in this case
M ¤T 1 X£ † Hm Hm , MNR m=1
(7)
M 1 X Hm H†m , MNT m=1
(8)
and then we use the Kronecker model in Eq. (5). As an example of the spatial correlation of the ”waveguide” measurements ˆ T and R ˆR we here present the first column of R T |ˆ rT | = [ 1.0 0.41 0.087 0.22 0.46 0.59 ] (9) T
|ˆ rR | = [ 1.0 0.42 0.37 0.24 0.17 0.18 ]
(10)
These values were obtained with a limited number of transfer function samples (M = 101) due to the long duration of the measurements. The correlation matrices allow a prediction of the decrease in capacity due to signal correlation (i.e., an effect that is different from a keyhole effect). Inserting the measured correlations into Eq. (5) gives the capacity distribution in a correlated, non-keyhole channel. IV. C APACITY ANALYSIS AND RESULTS In this section we analyze the influence of using nonideal transfer function measurements when calculating the capacity, and analyze their effect on our experiment. When measuring a transfer matrix, the measured quantity will consist of contributions not only from multi-path components (MPCs) but also from measurement noise. For keyhole measurements, the measured transfer matrix will in addition to the noise and the keyhole transfer matrix also consist of MPC leakage, as described below. The measured keyhole transfer matrix can be modelled as ˜ Hmeas = Hkey +Hleak + N, (11) ¢ ¡ ˜ ∈CN 0, σ2 I denotes the noise. For an ideal keywhere N n ˜ hole the keyhole transfer matrix has rank one with entries belonging to a double complex Gaussian distribution [5]. The keyhole transfer matrix can therefore be modeled as Hkey = gR gT† , where gR , gT are column vectors gR , gT ∈CN (0, σkey I). The MPC leakage describes MPCs propagating between the transmitter and the receiver via other paths than through the keyhole. The leakage matrix is modeled as Gaussian and as a worst case assumption, in terms of measuring a keyhole, it¢ is ¡ assumed to have independent entries, Hleak ∈CN 0, σ2leak I . Under these assumptions the noise leads to the same destruction of the keyhole effect as leakage. In order to check the effect on the evaluated capacity, we lump the two effects ˇ = Hleak + N. ˜ Assume that Hkey , Hleak into a single matrix, N ˜ are independent, the ”measurement SNR” (including and N
0-7803-7975-6/03/$17.00 (C) 2003
In Fig. 2 simulations of the 50% outage capacity for three different measurement SNRs, versus the evaluated SNR are plotted [9]. Additionally we plot the capacity for our keyhole measurement, which, as mentioned before, has an estimated measurement SNR of 26 dB. From the figure it 25
50% outage capacity [bit/s/Hz]
20
sim. γ = 20 dB meas = 25 dB sim. γ meas waveguide γ = 26 dB meas = 30 dB sim. γ meas = ∞ dB sim. γ
shows a capacity that is more than 11 bit/s/Hz higher than the ”waveguide” measurement. The increase in capacity for more 25
20 50% outage capacity [bit/s/Hz]
leakage) from a keyhole measurement point of view, γ meas , can therefore be defined as · ³ ´† ¸ key key E hkl hkl σ2key i h i = . (12) γ meas = h ¡ leak ¢† † σ2nˇ + E n ˜ h E hleak (˜ n ) kl kl kl kl
i.i.d. large hole correlation model small hole waveguide perfect keyhole
15
10
5
meas
0 1
2
3
15
5
6
Fig. 3. 50% outage channel capacity vs. the antenna array size, where NR = NT .
10
5
0 0
4 Array size
5
10
15
20
25
30
Evaluation SNR [dB]
Fig. 2. The estimated capacities for different simulated measurement SNRs {20, 25, 30, ∞} versus evaluation SNR [dB] togehter with the measured keyhole with a estimated keyhole SNR of 26 dB.
can be concluded that the SNR of the keyhole measurement has to be around 10 dB better than the SNR used in the evaluation to give capacity values close to the ideal case. For an evaluation SNR of 15 dB the contribution from noise and leakage components has to be 25 dB lower than the contributions from the keyhole. This can be difficult to find for ”real-life” keyhole situations, e.g. tunnel waveguiding or diffraction, which might explain the difficulty in finding keyholes in previous measurement campaigns. The shielded chamber in our measurements made sure that the leakage was very small. The SNR (including leakage) was estimated to 26 dB. Therefore an evaluation SNR of 15 dB is appropriate in this case. In Fig. 3 the measured 50% outage capacities versus the number of antenna elements, NR = NT , are shown for an SNR of 15 dB (capacity CCDFs in [10]). For comparison, the figures also presents the i.i.d. capacity, the correlated capacity and the capacity for a perfect theoretical keyhole. We see that the measured 50% outage capacity for the ”waveguide” setup is very close to the simulated perfect keyhole. With the ”large hole” the capacity is close to an i.i.d. channel and its measured capacity is in between the curves for the i.i.d. model and the correlated model. The difference in 50% outage capacity between the measured ”waveguide” and ”large hole” configuration is up to 17 bit/s/Hz, for array sizes of 6 × 6. The correlation model shows the decrease in capacity related to the receive and transmit antenna correlation, and
antenna elements is due to the antenna gain of the receiver array. The capacity of the ”large hole” increases almost as the capacity for the i.i.d. channel. This shows that the keyhole effect has disappeared entirely when the ”large hole” of size 300 × 300 mm is the (only possible) path between transmitter and receiver. V. S INGULAR VALUE ANALYSIS AND RESULTS The rank of an ideal keyhole is one, and in order to characterize a measured keyhole it is therefore of interest to study the distribution of the singular values (or eigenvalues). Especially, the ratio between the largest and second largest singular values should be large. For a measured keyhole, however, this difference is dependent on the measurement SNR of the keyhole, γ meas . Again we consider the leakage as part of the noise, and add the leakage and the measured noise together ˜ The difference between the k :th ordered ˇ = Hleak + N. as, N singular value of the measured transfer matrix (11), denoted ˇ) (Hkey +N sk , and the k :th ordered singular value of the keyhole (H ) transfer matrix, sk key , is limited by [11] ¯ ¯ ¯ (Hkey +N ˇ) ˇ) (N (Hkey ) ¯¯ ¯s − s (13) k ¯ ≤ s1 , ¯ k where the ordered singular values for the rank one keyhole matrix, Hkey , are ( (H ) sk key > 0 , k = 1 . (14) (H ) sk key = 0 , k > 1
From (13) and (14) the second largest singular value of the measured keyhole transfer matrix can now be upper bounded as ˇ) ˇ) (Hkey +N (N s2 ≤ s1 . (15) ˆ = N, ˇ where N ˆ is With the variable transformation, √γ1 N meas ° °2 °ˆ° normalized as °N ° = NR NT , the second largest singular
0-7803-7975-6/03/$17.00 (C) 2003
F
value of the measured keyhole is upper bounded as a function of the measurement SNR. The second largest singular value of the measured keyhole transfer matrix is bounded by the largest singular value of the noise matrix as (Hmeas )
s2
≤√
ˆ) 1 (N s . γ meas 1
(16)
This means that if the second largest singular value of the measured transfer matrix exceeds the threshold (16), we do not have measured a keyhole with ideal properties. · ¸ ˆ) (N 1 The expectation, E √γ s1 , of the largest singular
difference between the mean of the largest and second largest eigenvalue is almost 30 dB for the measured keyhole. As a comparison, the difference between these eigenvalues for the ideal i.i.d. channel is around 2 dB. The difference between the largest and smallest eigenvalues (i.e., the condition number of the matrix Hm H†m ) is almost 50 dB for the ”waveguide” and around 20 dB for the i.i.d. channel. 20
10
where
s · ¸ sZ ˆ †N ˆ) (N E λ1 =
∞
λ1 fΛ1 (λ1 ) dλ1 ,
(18)
Mean eigenvalue [dB]
meas
ˆ can be found from the density function of ordered value of N ˆ ˆ † N, eigenvalues [12] of the semi definite Wishart matrix N since those eigenvalues are equal to the magnitude squared of ˆ therefore the singular values of, N, ¯¸ · ¸ ·¯ ¯ (H+N ˇ )¯ ˆ) 1 (N ¯ ≤ E s E ¯¯s2 √ 1 ¯ γ meas ¯s · ¸¯ ˆ †N ˆ ) ¯¯ 1 ¯¯ (N = √ ¯ E λ1 ¯ , (17) ¯ γ meas ¯
0
-10
-20
i.i.d. large hole correlation model small hole waveguide
-30
-40
1
2
Fig. 5.
3 4 Ordered eigenmodes
5
6
Mean of the ordered singular values [dB].
0
and the marginal density function of the largest eigenvalue, fΛ1 (λ1 ), is given in [12]. In Fig. 4 the bound for the second largest singular value is plotted for different measurement SNRs together with simulated values of the largest and second largest singular values of an ideal keyhole with measured additive white Gaussian noise, and our measured mean values of the largest and second largest singular values. 20 15
where K is the number of eigenmodes. The discrepancy in capacity compared to a theoretical keyhole, ε (E[Ckey ]), could then be upper bounded from the results in (16) as à · ¸2 ! ˆ) γ eval (N E s1 ε (E[Ckey ]) < (K − 1) log2 1 + . NT γ meas (20) In Fig. 6 simulated errors and the error bounds are presented for different measurement SNRs and evaluation SNRs for the case with K = 6 singular values. The bound is however not that tight in the region where γ meas /γ eval < 10 dB.
Mean eigenvalue [dB]
10 5 0 -5 -10 -15 -20 -5
bound sim. eig. 1 sim. eig. 2 meas. eig. 1 meas. eig. 2
0
A. Keyhole capacity error For a keyhole measurement the capacity from a theoretical keyhole could be upper bounded in respect to measurement SNR, γ meas , using the results in (16) and Jensen’s inequality as µ ¶ γ eval h (Hkey ) i2 E s1 E[Ckey ] < log2 1 + (19) NT Ã ! · ¸2 ˆ) γ eval (N E s1 . + (K − 1) log2 1 + NT γ meas
5
10 15 Measurement SNR [dB]
20
25
30
Fig. 4. The mean of the largest and the second largest singular value together with the upper bound for the second largest eigenvalue, both as a function of the measured SNR. The waveguide measurement with an estimated measurement SNR of γ meas ≈ 26 dB is also plotted.
In Fig. 5 the mean of the measured ordered eigenvalues for the different channel setups are presented. It can be clearly seen that the ”waveguide” channel is of low rank. The
VI. E NVELOPE DISTRIBUTION If no keyhole is present, then the amplitudes of the entries in H follow a Rayleigh distribution. However, if a keyhole exists, the transfer matrix T1/2 in (6) is the all one matrix [5], ¯ and ¯ ¯ ¯ the amplitude statistics for the normalized channel, a = ¯hkey mn ¯, follow a double-Rayleigh distribution. It can be shown that the PDF of the envelope distribution can be expressed as ³ ´ 4aK0 σ2a 2 key fA (a) = , (21) 4 σkey
0-7803-7975-6/03/$17.00 (C) 2003
10 9 50% outage capacity error [bit/s/Hz]
8 7
sim. γmeas = 20 dB sim. γ = 25 dB meas sim. γ = 30 dB meas bound γ = 20 dB meas bound γ = 25 dB meas bound γ = 30 dB meas
6 5 4 3 2 1 0 0
Fig. 6.
5
10 Evaluated SNR [dB]
15
20
Capacity discrepancy from theoretical capacity of a keyhole.
where K0 (·) is the zeroth ordered Bessel function · modified ³ ´† ¸ key key of the second kind and σ 2key = E hmn hmn = 1 for the
PDF and histogram
normalized transfer matrix. In Fig. 7 we present histograms of the received amplitudes in the experiment, both for the ”waveguide” case and the ”large-hole” case. As a reference we have also shown the PDFs for the amplitude of a Rayleigh variable and a double Rayleigh variable. waveguide double Rayleigh Rayleigh
1
0.8 0.6 0.4 0.2
PDF and histogram
0 0
0.5
1
1.5
2
2.5
3
large hole double Rayleigh Rayleigh
1
0.8 0.6 0.4 0.2 0 0
0.5
1 1.5 2 Envelope of channel coefficients
2.5
3
Fig. 7. Envelope distribution for the ”waveguide” and for the ”large hole” measurements.
The received amplitudes with the ”waveguide” correspond well to the double-Rayleigh distribution, which agrees with theory. The received amplitudes for the ”large hole”, however, correspond to a Rayleigh distribution since in this case the channel can be described as one rich scattering channel though all paths into the chamber is through the large hole.
ideal properties: the correlations at both the receiver and at the transmitter are low but still the capacity is very low and almost identical to a theoretical perfect keyhole. In our measurements we use a waveguide, a small hole, and a hole of size 300 × 300 mm as the only path between the two rich scattering environments. For the waveguide case, we found almost ideal keyhole properties, but for the large hole the capacity is almost as large as for a theoretical Gaussian channel with independent fading between the antenna elements. We then presented an analysis of the sensitivity of the keyhole measurement with respect to noise and alternative propagation paths. We found that both the noise and the alternative propagation paths during the channel sounding must be approximately 10 dB weaker than the noise level considered for the capacity computations. From this we can conclude that the keyhole effect due to real-world waveguides like tunnels or corridors will usually be very difficult to measure. Acknowledgement: Part of this work was financed by an INGVAR grant from the Swedish Foundation for Strategic Research. R EFERENCES [1] G. J. Foschini and M. J. Gans, “On limits of wireless communications in fading environments when using multiple antennas,” Wireless Personal Communications, vol. 6, pp. 311–335, 1998. [2] D. Shiu, G. J. Foschini, M. J. Gans, and J. M. Kahn, “Fading correlation and its effect on the capacity of multi-element antenna systems,” IEEE Transactions on Communications, vol. 48, pp. 502–513, March 2000. [3] C. N. Chuah, D. N. C. Tse, J. M. Kahn, and R. A. Valenzuela, “Capacity scaling in MIMO wireless systems under correlated fading,” IEEE Transactions on Information Theory, vol. 48, pp. 637 –650, 2002. [4] A. F. Molisch, M. Steinbauer, M. Toeltsch, E. Bonek, and R. S. Thoma, “Capacity of MIMO systems based on measured wireless channels,” IEEE Journal on Selected Areas in Communications, vol. 20, pp. 561– 569, April 2002. [5] D. Gesbert, H. Bölcskei, D. A. Gore, and A. J. Paulraj, “MIMO wireless channels: Capacity and performance prediction,” in Proc. GLOBECOM, vol. 2, pp. 1083–1088, IEEE, 2000. [6] D. Chizhik, G. J. Foschini, M. J. Gans, and R. A. Valenzuela, “Keyholes, correlations, and capacities of multielement transmit and receive antennas,” IEEE Transactions on Communications, vol. 1, pp. 361–368, April 2002. [7] H. Bölcskei and A. J. Paulraj, “Performance of space-time codes in the presence of spatial fading correlation,” in Proc. Asilomar Conference on Signals, Systems and Computers, vol. 1, pp. 687–693, IEEE, November 2000. [8] D. A. Gore and A. J. Paulraj, “MIMO antenna subset selection with space-time coding,” IEEE Transactions on Signal Processing, vol. 50, pp. 2580–2588, October 2002. [9] P. Kyritsi, R. A. Valenzuela, and D. C. Cox, “Channel and capacity estimation errors,” IEEE Communications Letters, pp. 517–519, December 2002. [10] P. Almers, F. Tufvesson, and A. F. Molisch, “Measurement of keyhole effect in a wireless multiple-input multiple-output (MIMO) channel,” IEEE Communications Letters, vol. 7, pp. 373–375, August 2003. [11] R. A. Horn and C. R. Johnson, Topix in Matrix Analysis. London: Cambridge University Press, 1991. [12] I. E. Telatar, “Capacity of multi-antenna Gaussian channels,” European Transactions on Telecommunications, vol. 10, November–December 1999.
VII. C ONCLUSIONS In this paper the first experimental evidence of the keyhole effect in wireless MIMO systems is presented. Using a controlled indoor environment, we found a keyhole with almost
0-7803-7975-6/03/$17.00 (C) 2003